Local Waters Alternative to the Lake Powell Pipeline 2.0 - July 1, 2021
←
→
Page content transcription
If your browser does not render page correctly, please read the page content below

Local Waters Alternative to the
     Lake Powell Pipeline
             2.0

            July 1, 2021
Prepared by Peter Mayer, P.E., Principal, WaterDM
for Western Resource Advocates

Acknowledgements
WaterDM and Western Resource Advocates gratefully acknowledge the guidance, review, and
recommendations provided by John Gerstle, C.E., MNIF, David Rosenberg, Ph.D., John Berggren
Ph.D., and Jane Whalen of Conserve Southwest Utah.

Cover photo: Sand Hollow State Park and Reservoir, Washington County, Utah (www.utah.gov)

                                                                           Western Resource Advocates
                                                                          2260 Baseline Road, Suite 200
                                                                                     Boulder, CO 80302
                                                                         westernresourceadvocates.org

                                                                           WATER DEMAND MANAGEMENT
                                                                                  1339 Hawthorn Ave.
                                                                                   Boulder, CO 80304
                                                                                        waterdm.com

                                                     2
TABLE OF CONTENTS
LIST OF FIGURES .............................................................................................................................. 5
LIST OF TABLES ................................................................................................................................ 6
EXECUTIVE SUMMARY .................................................................................................................... 7
   The Lake Powell Pipeline Proposal ............................................................................................. 7
   Lake Powell Pipeline is an Expensive and Uncertain Future Supply ........................................... 7
   A Better Option: The Local Waters Alternative 2.0 .................................................................... 8
   Local Waters 2.0 Means: Utilize the Virgin River System ........................................................... 8
   Local Waters Alternative 2.0 Means: Manage Water Demand in Washington County ............. 9
   Local Waters Alternative 2.0 Means: Rely on Realistic Water Demand Forecast .................... 10
   Local Supply Option Less Vulnerable, More Robust ................................................................. 11
LOCAL WATER ALTERNATIVE 2.0 FOR WASHINGTON COUNTY, UT ............................................. 12
   The Lake Powell Pipeline Proposal ........................................................................................... 12
   Washington County, Utah......................................................................................................... 12
Water Supply................................................................................................................................. 13
   The Virgin River ......................................................................................................................... 13
   Existing Supply .......................................................................................................................... 14
   Future Supply ............................................................................................................................ 15
       Agricultural Conversion ........................................................................................................ 16
   Combined Existing and Planned Future Supplies of the WCWCD and Municipalities Without
   the Lake Powell Pipeline ........................................................................................................... 16
   Additional Supplies Not Reported in the DEIS .......................................................................... 17
       Water Supply Excluded ......................................................................................................... 17
       147 Individual Water Rights.................................................................................................. 17
       Quail Creek and Sand Hollow Reservoirs .............................................................................. 18
       Substantial Groundwater Supply .......................................................................................... 18
   Additional Local Sources of Reliable Supply for Washington County ...................................... 19
       Cap Secondary Water Systems and Treat Future Secondary Water to Culinary Quality ..... 19
       Store Virgin River Water in High-Flow Years ........................................................................ 21
       Aquifer Storage and Recovery .............................................................................................. 21
       Wastewater Reuse ................................................................................................................ 22
   Revised Supply Portfolio for Washington County .................................................................... 23
   Utah Division of Water Resources Comments on Supply Diversity.......................................... 28

                                                                       3
System Diversity and Reliability ............................................................................................ 28
       Provide System Redundancy ................................................................................................ 30
       Account for Climate Variability ............................................................................................. 30
       Account for Long-Term Uncertainty ..................................................................................... 31
   Water Supply Metrics – Lake Powell Pipeline vs. Virgin River and Local Resources ................ 32
       Resilience .............................................................................................................................. 32
       Vulnerability .......................................................................................................................... 32
       Robustness ............................................................................................................................ 33
Water Demand.............................................................................................................................. 35
   Total Water Demand................................................................................................................. 35
   Per Capita Water Use ................................................................................................................ 38
DEIS Water Demand Forecast ....................................................................................................... 38
   Forecast Population and Water Requirements ........................................................................ 38
   Per Capita Use Forecast ............................................................................................................ 40
   System Per Capita ..................................................................................................................... 40
   Per Capita Use Has Declined Nationally ................................................................................... 41
   Per Capita Comparisons Show High Usage in Washington County .......................................... 43
   Water Efficiency Impacts Not Considered After 2045 .............................................................. 45
   Secondary Water Use Improperly Forecast .............................................................................. 45
   Future Per Capita Use Improperly Inflated ............................................................................... 46
   System Loss Forecast ................................................................................................................ 46
Significance of Forecast Accuracy ................................................................................................. 47
Current Water Demand Management in Washington County..................................................... 49
   Definition: Water Demand Management ................................................................................. 49
   Comparative Evaluation of Water Conservation Programs...................................................... 50
       What Hypothetical Population Could Be Served by 120,000 AF? ........................................ 56
   Utah Division of Water Resources Comments on Water Conservation ................................... 57
Recommended Water Demand Management for Washington County ....................................... 60
   Regional Approach to Water Demand Management ............................................................... 60
   Strengthen Development and Landscape Codes ...................................................................... 61
   Water Budget-Based Rates ....................................................................................................... 61
   Water Loss Control ................................................................................................................... 63
   Incentivize Gradual Transformation to Climate-Adapted Landscapes ..................................... 64

                                                                        4
Incentivize Toilet Replacement for Low-Income Customers .................................................... 65
   Customer Leak Detection and Abnormal Usage Alerts ............................................................ 66
Local Waters 2.0 Revised Demand Forecast ................................................................................. 66
Conclusions ................................................................................................................................... 73
   Local Supply is Sufficient and Resilient ..................................................................................... 73
   Lake Powell is an Uncertain Future Supply............................................................................... 73
   Utilize the Virgin River System .................................................................................................. 74
   Manage Water Demand in Washington County....................................................................... 75
   Realistic Water Demand Forecast............................................................................................. 76
   Local Supply Option is Best ....................................................................................................... 76
Appendix A – Materials Considered ............................................................................................. 78
   Literature, Reports, & Publicly Available Sources..................................................................... 78
Appendix B – Listing of 147 Water Rights of the WCWCD ........................................................... 83
Appendix C – Resume of Peter Mayer, P.E. .................................................................................. 95

LIST OF FIGURES
Figure 1: Annual flow volume of the Virgin River at St. George (source USGS) ........................... 14
Figure 2: Reliable water yield comparison, DEIS and Local Waters Alternative 2.0..................... 25
Figure 3: Reliable water yield comparison, DEIS and Local Waters Alternative 2.0 including
          additional groundwater and surface water supplies not included in the DEIS ............. 26
Figure 4: Linear correlation between annual Lake Powell inflow and annual Virgin River Flows 29
Figure 5: Municipal water demand in Washington County, Utah, 2016 – 2019 .......................... 37
Figure 6: Pie chart of average municipal water demand by sector in Washington County, Utah,
          2016 – 2019 ................................................................................................................... 37
Figure 7: DEIS water demand forecast for Washington County, Utah (2015 – 2075).................. 40
Figure 8: US Public Supply Withdrawals and Population, 1950 – 2015........................................ 41
Figure 9: US Public Supply Withdrawals and gpcd, 1950 – 2015 ................................................. 42
Figure 10: Comparison of per capita residential water use in the US, 2015. ............................... 43
Figure 11: Comparison of single-family potable/culinary estimated monthly bills from
          Washington County and agencies in Maddaus Report ................................................. 55
Figure 12: Hypothetical population that could be served with 120,000 AF ................................. 56
Figure 13: The Garden at Tonaquint Park and the Red Hills Desert Garden, water conservation-
          oriented projects of the WCWCD. ................................................................................. 65
Figure 14: Local Waters Alternative 2.0 and DEIS Demand Forecasts ......................................... 68
Figure 15: Local Waters Alternative 2.0 forecast for potable, secondary and water loss ........... 70
Figure 16: Local Waters Alternative 2.0 potable forecast by sector, with secondary and water
          loss ................................................................................................................................. 70

                                                                        5
LIST OF TABLES
Table 1: Current Water Supplies for WCWCD produced from Table 4.2-1 from the DEIS ........... 15
Table 2: Local Planned Project by Washington County WCD produced from Table 4.2-2 from the
          DEIS ................................................................................................................................ 16
Table 3: Combined existing and planned future supplies of the WCWCD and municipalities
          without the Lake Powell Pipeline .................................................................................. 17
Table 4: Local Waters Alternative 2.0 - revised portfolio of existing and potential future reliable
          supplies of the WCWCD and municipalities, without the Lake Powell Pipeline ........... 24
Table 5: Historic water demand in Washington County, Utah ..................................................... 35
Table 6: Water demand in Washington County, Utah, 2016 - 2019 ............................................ 36
Table 7: Per capita water use in Washington County, 2016 - 2019 ............................................. 38
Table 8: Future Water Requirements for Washington County WCD produced from Table 6.2-1
          from the DEIS ................................................................................................................. 39
Table 9: Per capita comparisons, ranked in descending order..................................................... 44
Table 10: Surveyed agency information and calculated gpcd from 2018 Maddaus Report ........ 53
Table 11: Single-family potable/culinary water rates and estimated monthly bills from
          Washington County and agencies in Maddaus Report ................................................. 54
Table 12: Per Capita Comparisons including Local Waters Alternative 2.0 forecast, sorted in
          descending order ........................................................................................................... 69
Table 13: Local Waters Alternative 2.0 and DEIS demand forecasts for Washington County, Utah
          (2021 – 2075) ................................................................................................................. 72

                                                                        6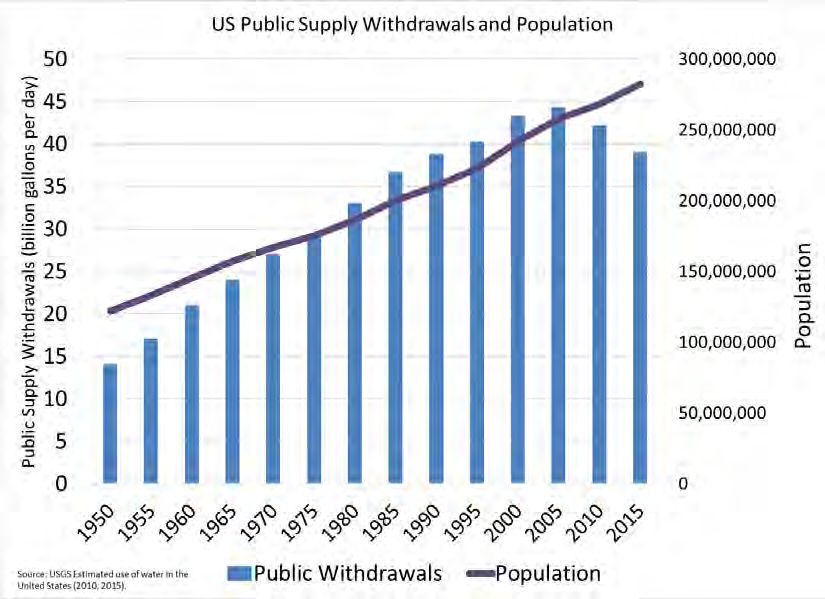
EXECUTIVE SUMMARY
The Lake Powell Pipeline Proposal
The Lake Powell Pipeline Project is proposed to deliver 86,249 acre-feet (AF) of water annually
from Lake Powell to Washington County, Utah to supplement approximately 100,000 AF of local
surface water supplies to meet a forecast water demand in 2075 of 184,593 AF.

In 2019, the 171,040 residents of Washington County used a total of 57,373 AF. The
Washington County Water Conservancy District (WCWCD) forecasts that by 2075, 594,660
people in Washington County will need 184,593 acre-feet of water. They have proposed the
Lake Powell Pipeline to fill the gap.

Lake Powell Pipeline is an Expensive and Uncertain Future Supply
Despite its massive size, Lake Powell sits in a vortex of climate change and interstate water
policy that makes it a highly uncertain future supply. The entire Colorado River Basin is
imperiled by the impacts of climate change. Scientists understand it took years to fill Lake
Powell and it may never fully refill again.1 The Lake Powell Pipeline may be delayed for years. It
may never be successfully constructed. If it is constructed, and regardless of Utah’s assumed
Colorado River entitlement, the Lake Powell Pipeline will still be the most recent and junior
withdrawal on the system and will remain under the microscope and a lightning rod for conflict.

In 2021, bad forecasts for the Colorado River system have swiftly become dire. The US Bureau
of Reclamation forecasts Lake Powell to be at 29% of capacity by the end of September 2021,
the lowest level since the reservoir first started filling in 1963. The WCWCD’s stated belief that
the Colorado River and Lake Powell offer “the most reliable water supply in the Western US” 2 is
highly questionable.

The Utah Board of Water Resources has proposed that the Lake Powell Pipeline, which draws
from the same overallocated Colorado River Basin as the Virgin River, offers improved system
reliability and supply diversity for Washington County. This is a questionable notion at best and
ignores the impacts of climate change on the entire basin 3 and the fact that the Virgin River and
the Colorado River are inextricably linked.

The Lake Powell Pipeline also presents a significant financial risk to the region. Paying for the
estimated $2 billion (and growing) project will fall upon impact fees, water sales, and property
taxes paid by current and future Washington County residents. Impact fees and water sales are

1
 Salt Lake City Tribune. 1/20/2019. https://www.sltrib.com/news/environment/2019/01/20/lake-powell-could-
become/ (accessed 3/5/21)
2
 Statement by Zach Renstrom, General Manager of the WCWCD to the Washington County Republican Women’s
Luncheon. 3/4/2021.
3
 Milly, P.C. and K. A. Dunne. 2020. Colorado River flow dwindles as warming-driven loss of reflective snow
energizes evaporation. Science. 13 MAR 2020 : 1252-1255

                                                        7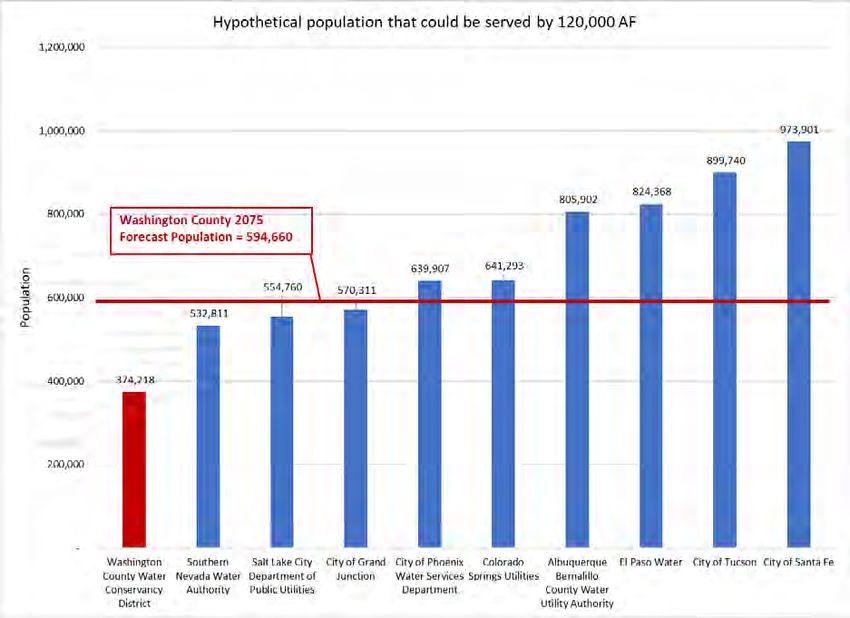
both dependent upon population growth forecast by the Kem Gardner Policy Institute 4 and
inflated assumptions about future water demand produced by the WCWCD. If the projected
population growth and/or projected water demand does not materialize, repayment of the
Lake Powell Pipeline becomes more challenging for the WCWCD and much more costly for
existing customers.

A Better Option: The Local Waters Alternative 2.0
Rather than build the Lake Powell Pipeline, Washington County, and the WCWCD have the
excellent option of relying on local water supplies. The 2013 Local Waters Alternative to the
Lake Powell Pipeline proposed greater water efficiency and a reliance on local supplies to meet
future demand.5 WaterDM prepared a revised portfolio of future water supply and demand
management options which update and build upon the Local Waters Alternative. The Local
Waters Alternative 2.0 analysis concurs with the key recommendations in the 2013 Local
Waters Alternative report in finding that a combination of local water supply resources and
sensible and cost-effective demand management options can provide a reasonable, reliable
water supply to meet the 2075 forecast future population of Washington County at a much
lower cost and less risk.

Aside from minimum flow requirement for fish and other species, Utah claims the entire
contents of the Virgin River and Kanab Creek and this claim does not appear to be in dispute.
The Lake Powell Pipeline, in comparison, is such a highly contentious project that all six fellow
Colorado River Basin states have written the Secretary of the Interior requesting that she block
the Bureau of Reclamation from completing its ongoing environmental impact statement until
the seven states achieve a “consensus regarding outstanding legal and operational concerns”
having to do with the pipeline’s moving water from the Colorado River’s Upper Basin to the
southwest corner of Utah, draining into the Lower Basin. 6

Local Waters 2.0 Means: Utilize the Virgin River System
The best way for the WCDWD and municipalities in Washington County to account for long-
term uncertainty is to take advantage of available local resources and to implement cost-
effective water demand management policies. The local supply that Washington County
controls, the Virgin River, provides a more certain, resilient, and cost-effective long-term supply
option than the Lake Powell Pipeline.

The Virgin River system offers greater robustness for water users in Washington County, under
a wide variety of future situations and circumstances, than relying on the Lake Powell Pipeline.
The Local Waters Alternative 2.0 includes all the existing water rights holdings of the WCWCD

4
 The Kem C. Gardner Policy Institute, part of the David Eccles School of Business at the University of Utah,
prepares economic, demographic, and public policy research including the population estimates relied upon by the
WCWCD for the Lake Powell Pipeline DEIS.
5
    Nuding, A. 2013. The Local Waters Alternative to the Lake Powell Pipeline. Western Resource Advocates.
6
 Salt Lake City Tribune. 9/9/2020. https://www.sltrib.com/news/environment/2020/09/09/surrounding-states-
bash/ (accessed 3/5/21)

                                                          8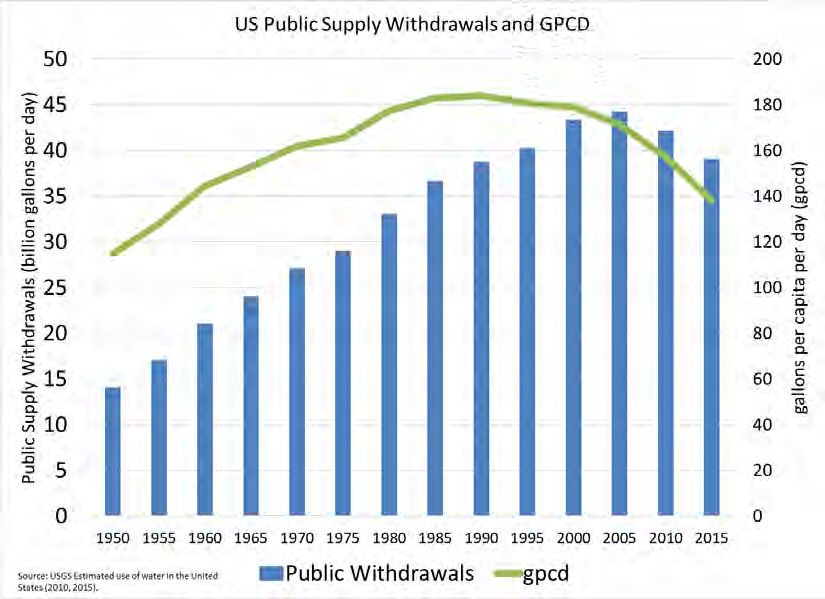
and the other water providers in Washington County, and identified local projects and
agricultural transfers already planned and available to the WCWCD along with the additional
supply recommendations below.

The Local Waters Alternative 2.0 proposes:

1.         Cap secondary water systems at their current size. Focus on expanding potable supply.
2.         Store excess Virgin River water in high-flow years.
3.         Further explore and expand aquifer storage and recovery.
4.         Expand capability for wastewater reuse – to be scaled as required.
5.         Cost-effective water demand management.

This revised portfolio provides a reliable future supply of at least 111,212 AF of culinary water 7
and an ongoing 15,693 AF of secondary water, which is sufficient supply to meet anticipated
average year future demands, and offers a much less expensive, less risky, locally controlled
approach for providing water into the future.

Local Waters Alternative 2.0 Means: Manage Water Demand in Washington County
The 2013 Local Waters Alternative proposed a 1% increase in efficiency per year for
Washington County 8, which is the typical level of improvement achieved by water providers
across the United States over the past 20 years. 9 For the Local Water Alternative 2.0, WaterDM
developed a separate analysis of potential demand reductions that can be achieved in
Washington County over the next 50 years and found that the 1% annual per capita reduction
proposal is reasonable and achievable and is an important part of the best, least risky, and most
resilient local supply option.

In the Local Water Alternative 2.0, WaterDM proposes a series of measures and policies to
improve water demand management in Washington County and to help manage demand,
particularly outdoor use, into the future. Key components of the recommended water demand
management options are:

       •   A regional approach to water demand management
       •   Strong development and landscape codes
       •   Water budget-based rates
       •   Water loss control
       •   Landscape transformation for climate-adaptation
       •   Incentives for low-income toilet replacement
       •   Customer leak detection and monitoring

7
 Additional water reuse could be developed beyond what is proposed by WaterDM and provide a future supply
cushion if required.
8
    Nuding. A. 2013.
9
 DeOreo, W.B., P. Mayer, J. Kiefer, and B. Dziegielewski. 2016. Residential End Uses of Water, Version 2. Water
Research Foundation. Denver, CO.

                                                        9
The Local Waters Alternative 2.0 analysis of water demand and water rates in Washington
County shows that the WCWCD’s annual water conservation budget could be invested more
effectively. One reason for high water demand in Washington County is the comparatively low
cost of water charged for high levels of irrigation use. For the Local Water Alternative 2.0,
WaterDM compared the expected monthly water bill for a customer who uses 40,000 gallons in
one month (a significant volume) and found that customers in Washington County pay
hundreds of dollars less than customers in peer communities using the same volume of water.
Customers in Washington County using secondary water pay even less. The lack of a price signal
for high volumes of irrigation and outdoor use is one reason water demand in Washington
County is higher than in many other parts of the western and southwestern U.S.

Local Waters Alternative 2.0 Means: Rely on Realistic Water Demand Forecast
The Draft Environmental Impact Statement (DEIS) prepared by Reclamation 10 failed to include
the impacts of ongoing water efficiency after 2045, improperly inflated secondary water
demand, and projected a remarkably high level of system water loss that is never shown to
improve over 50 years. The result is a highly inflated and unrealistic demand forecast for
Washington County.

For the Local Water Alternative 2.0, WaterDM developed a separate water demand forecast for
Washington County that includes the impacts of water loss control and ongoing water
efficiency beyond 2045, which were missing from the DEIS forecast.

The Local Waters Alternative 2.0 forecast uses the same population forecast as the DEIS and
includes the same population in 2075 of 594,660. The Local Waters forecast starts from the
same assumed 2020 level of water use as the DEIS and the two forecasts track closely initially.
From 2025 – 2045, the Local Waters 2.0 forecast includes improvements to water loss control
practices and building, plumbing, and landscape codes which assure new construction in
Washington County will be water efficient from the start.

Starting in 2045, the DEIS assumes that no additional efficiency improvements are possible, and
it simply extends a value of 240 gallons per capita per day (gpcd) out to 2075 to develop the
final demand estimate. The DEIS assumes that new customers in Washington County will use
water just as inefficiently as existing customers without change or improvement for 35 years.

The Local Waters 2.0 forecast includes ongoing efficiency improvements for existing customers
in Washington County and it assumes that new customers will join the system as water efficient
users from the start due to building and plumbing and landscape development codes. The Local
Waters 2.0 forecast for total per capita demand in 2075 (potable + secondary) is 183.5 gpcd and
a potable demand alone will be 146.4 gpcd. For comparison, this level of use is about the same
as what is used in Grand Junction Colorado today, according to the data from a 2018 study

10
  Reclamation. 2020. Lake Powell Pipeline Project, Draft Environmental Impact, Statement, Coconino and Mohave
Counties, Arizona, Kane and Washington Counties, Utah. U.S. Department of the Interior, Bureau of Reclamation.
June 2020.

                                                     10
commissioned by the WCWCD (the Maddaus Report)11. The Local Waters 2.0 forecast also
aligns closely with the demand forecast prepared in the 2013 Local Waters Alternative and
confirms the reasonableness of the 1% per year efficiency proposal.
In 2075, the Local Waters Alternative 2.0 forecast estimates that water use in Washington
County will still be higher than many comparable utilities with additional conservation potential
remaining. It is quite possible per capita use in Washington County will be even lower in 2075
than the level included in the Local Waters 2.0 forecast.
Local Supply Option Less Vulnerable, More Robust
The Local Waters 2.0 analysis shows the local supply option to be less vulnerable, more robust,
and more resilient than the expensive and highly uncertain Lake Powell Pipeline. A local water
supply option with the recommended water demand management measures offers significant
advantages to Washington County water users and advantages that have been ignored as plans
for the Lake Powell Pipeline are promoted. There are substantial financial, legal, and political
risks associated with the Lake Powell Pipeline. The local supply option significantly alleviates
these issues.
The current and future water users in Washington County will be better served today and into
the future by adopting a plan optimizing local resources and manage demands.
11
Maddaus Water Management Inc. 2018. Water Conservation Programs: A Comparative Evaluation. Prepared for
the Washington County Water Conservancy District.
11LOCAL WATER ALTERNATIVE 2.0 FOR WASHINGTON COUNTY, UT
The Lake Powell Pipeline Proposal
The Lake Powell Pipeline Project is proposed to deliver 86,249 acre-feet (AF) of water annually
from Lake Powell to Washington County, Utah to supplement approximately 100,000 AF of local
surface water supplies to meet a forecast water demand in 2075 of 184,593 AF. 12 The preferred
alignment of the Lake Powell Pipeline would withdraw water near the Glen Canyon Dam in
Page, Arizona and would run 141 miles crisscrossing Utah and Arizona before reaching
Washington County.
The Washington County Water Conservancy District (WCWCD) is the sole project participant in
the Lake Powell Pipeline. Kane County Water Conservancy District was previously a project
participant but withdrew in April 2020 after Reclamation determined that projected demand in
2060 did not outpace the estimated future reliable water supply of Kane County.13
Washington County, Utah
Washington County is in the southwestern corner of Utah and borders Arizona and Nevada.
Terrain in Washington County is rocky and arid, with little area devoted to agriculture.
Washington County is made up of three major geographic areas, the Colorado Plateau in the
east-northeast, the Great Basin in the northwest and the Mojave Desert in the south-
southwest.
Most of the population is centered in the south-central part of the county near the Arizona
border around St. George. The climate of this section of the county is typical of the Mojave
Desert in which it lies; its annual rainfall is 8 inches, and it is the lowest elevation in Washington
County, making it particularly hot and dry compared to the rest of the county. Most homes are
in subdivisions characteristic of a growing urban sprawl.14
The WCWCD supplies water wholesale to local providers and retail directly to select customers
in Washington County. Most of the WCWCD’s water is delivered to municipal utilities who
provide retail water service to about 90% of the county’s population. WCWCD’s municipal
customers include the communities of St. George, Washington, Hurricane, Ivins, Santa Clara, La
Verkin, Toquerville and Leeds. 15
12
Reclamation. 2020. Lake Powell Pipeline Project, Draft Environmental Impact, Statement, Coconino and Mohave
Counties, Arizona, Kane and Washington Counties, Utah. U.S. Department of the Interior, Bureau of Reclamation.
June 2020. Table 6.2-2 Future Water Requirements of the Washington County Water Conservancy District.
13
Reclamation. 2020. LPP DEIS. p.3.
14
https://en.wikipedia.org/wiki/Washington_County,_Utah (accessed 2/10/2021).
15
https://www.wcwcd.org/about-us/customers/municipal/ (accessed 2/10/2021).
12Water Supply
The available water supply for the Washington County Water Conservancy District includes
resources from the WCWCD itself and resources belonging to municipalities in Washington
County such as the cities of St. George and Hurricane. The current water supply for the WCWCD
and municipalities comes from a combination of surface water and groundwater diversions
from the Virgin River watershed, a tributary of the Colorado River.
The Utah portion of the Kanab Creek/Virgin River Basin covers about 3,500 square miles and
spans three counties: Washington, Iron, and Kane. The Virgin River and Kanab Creek drainages
are tributaries of the Colorado River entering the mainstream at Lake Mead. The Virgin and
Kanab drainages sit geographically in the Lower Basin of the Colorado River. 16
Utah believes it has the right to develop and use the flows of the Virgin River based on the
decree in Arizona v. California which left the tributaries of the Boulder Canyon Project Act (Lake
Mead) to the exclusive use of the state in which they arise.17
The Virgin River
How much water is available from the Virgin River? The 1993 Utah State Water Plan for the
Kanab Creek / Virgin River Basin states that long-term annual flows of the Virgin River near
Virgin, UT to be 130,610 AF and near St. George, UT to be 126,675 AF. The total water
diversions from the broader Virgin/Kanab basin at that time were: 20,330 AF for
culinary/potable, 15,960 for secondary/raw water irrigation, and 133,300 AF for agricultural
irrigation. Total depletions for these uses were 73,050 AF. 18
The 2018 Evaluation of the Potential Conversion of Irrigation Water to Municipal Use in the
Virgin River Basin measured the long-term annual flows of the Virgin River near Virgin, Utah
(1988-2017) to be 123,400 AF.19 The report stated that if a full water supply is available, total
potential annual agricultural diversions would be about 74,700 AF with a depletion 42,900 AF
and that another 21,400 AF (11,700 AF depletion) of water has already been converted from
irrigation to municipal uses. 20
Flow data from the USGS gauge at St. George, Utah (ID No. 09413500) are available starting in
late 1991. 21 Average annual flows from 1991 – 2020 were 126,287 AF, remarkably similar to the
average from the 1993 Utah State Water Plan which was based on a much older data set and
16
Anderson, L.D. 2002. Utah’s Perspective - The Colorado River. Utah Division of Water Resources.
17
Anderson, L.D. 2002.
18
Utah DNR. August 1993. State Water Plan Kanab Creek / Virgin River. Utah Department of Natural Resources.
Salt Lake City. (p 2-3).
19
Olds, J. 2018. Evaluation of the Potential Conversion of Irrigation Water to Municipal Use in the Virgin River
Basin, Washington County. (Attachment E to January 2019 Water Use Conservation Update) (December 2018)
20
Olds, J. 2018.
21
https://waterdata.usgs.gov/usa/nwis/uv?09413500 accessed Feb. 2021.
13the 2018 study, which is based data from 1988-2017. However, from 2011 – 2020 average
annual flows of the Virgin River at St. George were 105,715 AF, more than 20,000 AF less than
the long-term average. Figure 1 shows the annual flow volume of the Virgin River from 1991 –
2020.
Figure 1: Annual flow volume of the Virgin River at St. George (source USGS)
Just like the rest of the Upper and Lower Colorado River Basin, climate change is impacting
precipitation, river flows, and runoff in southern Utah. Flows on the Virgin River that are below
the recent 10-year average of 105,715 AF should be expected more frequently in the future due
to climate change, just as lower flows have been forecast across the Colorado River Basin. 22
Existing Supply
As shown in Table 1 which is reproduced from the Draft Environmental Impact Statement (DEIS)
prepared by Reclamation, the total current reliable water supplies for the WCWCD are 59,172
AF of potable culinary water and 8,505 AF of raw secondary water for irrigation. The DEIS
estimates total current reliable supplies of the WCWCD at 67,677 AF.
22
Udall, Bradley & Overpeck, Jonathan. (2017). The 21st Century Colorado River hot drought and implications for
the future. Water Resources Research. 53. 10.1002/2016WR019638.
14Table 1: Current Water Supplies for WCWCD produced from Table 4.2-1 from the DEIS
As calculated from Table 1, the WCWCD’s reliable potable/culinary water yield is 32,047 AF
which corresponds to the volume reported in the 2015 WCDWD Water Conservation Plan.23
The member providers of the WCWCD possess their own municipal water supplies which total
27,125 AF as reported in the DEIS.
Future Supply
The DEIS minimizes future water supply options available in Washington County. As shown in
Table 2, which is reproduced from the DEIS prepared by Reclamation, the planned local water
supply projects of the WCWCD and its members, without the Lake Powell Pipeline, are 13,670
AF of potable culinary water and 17,380 AF of raw secondary water for irrigation. The DEIS
estimates the planned local water supply projects of the WCWCD and its members will create a
reliable future supply of just 31,050 AF.
23
Washington County Water Conservancy District. December 2015. Water Conservation Plan. (Table 2-1).
15Table 2: Local Planned Project by Washington County WCD produced from Table 4.2-2
from the DEIS
Agricultural Conversion
The 2018 Evaluation of the Potential Conversion of Irrigation Water to Municipal Use in the
Virgin River Basin estimated the amount of irrigation water that could potentially be converted
to municipal uses in the Virgin River Basin. This report concludes that an estimated 23,200 AF of
potential municipal depletions (e.g., consumptive use) from current irrigation water could be
potentially converted to municipal use in the future. 24
The 2018 Evaluation Report screened out junior water rights and rights of poor quality through
the analysis process to ensure the available water would be suitable for municipal uses. The
report states that the 23,200 AF of potential municipal depletions represents a “reliable water
supply that should be expected even during times of drought with manageable shortages.” The
report further states that if municipalities (or the WCWCD) have “other sources to augment”
the 23,200 AF “available from later priority water rights, then additional supplies could be made
available.” 25
Combined Existing and Planned Future Supplies of the WCWCD and Municipalities Without the Lake
Powell Pipeline
Based on information from the DEIS and subsequent official updates the combined existing and
planned future supplies of the WCWCD and its members is 121,905 AF. This includes existing
and planned reliable culinary and secondary yield. These supplies are summarized in Table 3.
24
Olds, J. 2018.
25
Olds, J. 2018.
16Table 3: Combined existing and planned future supplies of the WCWCD and
municipalities without the Lake Powell Pipeline
Water Supply Reliable Culinary Water Reliable Secondary
Yield (AF) Water Yield (AF)
Current Supplies of the WCWCD 32,047 178
Current Supplies of Washington County 27,125 8,505
Municipal Providers
Planned Local Projects 13,370 17,380
Agricultural conversion 23,300
Total 95,842 26,063
Additional Supplies Not Reported in the DEIS
The WCWCD and municipalities hold substantial additional surface and groundwater rights not
included in the DEIS. The DEIS does not discuss the full extent of water resources currently
available to the WCWCD and municipalities in its focus the Lake Powell Pipeline. For the Local
Water Alternative 2.0, WaterDM reviewed the water rights holdings of the WCWCD as well as
their reservoir capacity and publicly reported groundwater potential and estimated that there
are at least 50,000 AF - 150,000 AF or more of additional water supplies available and belonging
to the WCWCD and municipalities than are reported in the DEIS. Some of this water may
require additional treatment and conveyance but could still be part of a cost-effective local
supply solution.
Water Supply Excluded
First, the WCWCD avoids reporting all of its potential water supply in the DEIS by only disclosing
water meeting specific minimum EPA water quality requirements, when in fact it possess
numerous water supplies of lower quality. 26 Water treatment methods continue to advance
and treating water of lower quality is an obvious alternative to the Lake Powell Pipeline that the
DEIS has ignored.
147 Individual Water Rights
The WCWCD holds more than 147 individual water rights, many of which are not reported in
the DEIS.27 A complete listing of these 147 water rights is provided in Appendix B. The water
rights include small and large, approved and unapproved and withdrawn groundwater and
surface water rights. For the Local Water Alternative 2.0, WaterDM reviewed the rights in this
26
“Water supplies that meet the EPA’s secondary untreated MCL for drinking water of TDS less than 500 mg/L are
deemed usable for culinary purposes in this assessment.” – MWH. 2016. Lake Powell Pipeline Water Needs
Assessment. Final. Utah Division of Water Resources.
27
WCWCD. 2009. Washington County Water Conservancy District Change of Address (involving 147 District Water
Right). https://www.waterrights.utah.gov/docimport/0525/05256641.pdf.
17portfolio using the Utah Division of Water Resources online search tool and found the
WCWCD’s water rights holdings to include: 28
• 10,000 AF from Ash Creek and the Upper Ash Creek Reservoir (81-351)
• 31,820 AF from the Virgin River and Quail Creek (81-1381 and 81-1382)
• 28,891 AF from the Virgin River (81-2273)
• Unapproved rights totaling 60,000 AF from Beaver Dam Wash and Ft. Pearce Wash. (81-
3693 and 81-3699)
• 15,000 AF from Sand Hollow Reservoir/Groundwater Recharge and Sand Hollow
Reservoir/Ground Water Recovery Wells (81-4428 and 81-4436)
• 15,000 AF from Sand Hollow Reservoir/Sand Mountain Navajo/Kayenta Aquifer (RC004)
• 50,000 AF from the Virgin River via Quail Lake diversion (81-4211 (a22832))
• More than 130 additional WCWCD water rights holdings from across the region.
The WCWCD holds water rights from the Virgin River and its tributaries that total more than
100,000 AF through multiple water rights holdings, yet it reports just 32,047 AF as its reliable
culinary yield in the DEIS.
The municipalities possess their own water supplies which total 27,125 AF as reported in the
DEIS and these agencies also hold additional water rights not listed in the DEIS.
Further, The State of Utah Board of Water Resources holds a Virgin River water right 81-507
amounting to 147,500 AF.
Quail Creek and Sand Hollow Reservoirs
Quail Creek Reservoir has a capacity of 40,000 AF and Sand Hollow Reservoir has a capacity of
50,000 AF for a combined capacity of 90,000 AF. Both of these reservoirs typically fill every year
with water from the Virgin River basin.29 In the DEIS, the declared combined yield of these
reservoirs in declared to be 26,922 AF – just 30% of capacity. In most years, these reservoirs
can provide substantially more water than has been declared in the DEIS.
Substantial Groundwater Supply
The WCWCD has groundwater rights and systems not included in the DEIS. Groundwater
reserves in Washington County provide a robust backup supply that can be used to supplement
during times of surface water shortage.
A 2015 report from Fitch Ratings noted that, “the district is operating a groundwater recharge
program that currently provides access to 100,000 AF of stored water and will ultimately
28
Utah Division of Water Rights, Water Rights Search - https://www.waterrights.utah.gov/search/.
29
Statement by Zach Renstrom, General Manager of the WCWCD, to the Washington County Republican Women’s
Luncheon. 3/4/2021.
18provide up to 300,000 AF.” 30 The Fitch report was based on information provided by the
WCWCD itself to the credit rater.
A 2005 report from the WCWCD stated that there are groundwater rights claims of more than
300,000 AF within the Navajo/Kayenta and Upper Ash Creek aquifers:
Based on the Utah Division of Water Rights point of diversion coverage, there are 1,276
active underground water rights with points of diversion within the Navajo/Kayenta and
the Upper Ash creek aquifers. These water rights claim 590 CFS or 332,760 acre-
feet/year from the petitioned aquifers. Accounting for the fact that some water rights
declare more than one type of use, there were 160 commercial water rights, 249 stock
watering rights, 296 domestic rights, and 969 Irrigation rights (DWR Database, 2000).
The Utah Division of Drinking Water indicated there are 23 public water systems with 49
public drinking water wells with water quality data. – Washington County Water
Conservancy District. 2005. Petition for the Classification of the Navajo/Kayenta and
Upper Ash Creek Aquifers 31
The DEIS does not discuss the full extent of groundwater resources in Washington County now
and into the future and thus does not provide a complete picture of the water supply condition.
Additional Local Sources of Reliable Supply for Washington County
There are reasonable and reliable local alternatives to the Lake Powell Pipeline that are far less
expensive and environmentally damaging. The local supply options recommended in the Local
Water Alternative 2.0 include capping secondary water systems, diverting more water from the
Virgin River in wet years, treatment and utilization of secondary water, water reuse, aquifer
storage, and recovery and demand management measures which are discussed later in this
report.
Cap Secondary Water Systems and Treat Future Secondary Water to Culinary Quality
In the hotter and drier future, Washington County’s potable/culinary supply should be
maximized, and outdoor demands reduced. The first and most obvious water management
changes that should occur in Washington County (if the Lake Powell Pipeline is built or not) are:
1. Secondary water systems should be capped at their current size.
30
Business Wire. 2015. Fitch Affirms Washington County Water Conservancy Dist, UT's LTGOs at 'AA+'; Outlook
Stable. https://www.businesswire.com/news/home/20150522005845/en/Fitch-Affirms-Washington-County-
Water-Conservancy-Dist-UTs-LTGOs-at-AA-Outlook-Stable
31
Hansen, Allen & Luce, Inc. July 2005. Petition for the Classification of the Navajo/Kayenta and Upper Ash Creek
Aquifers. Prepared for the Washington County Water Conservancy District.
192. Municipal landscape design rules should be adopted to ensure future landscapes
are better adapted to local climate conditions and require substantially less
supplementary water. 32
3. Proposed future secondary water should be treated and used for culinary
purposes.
Across the western US, water users are working to reduce, not increase outdoor water use.
Secondary supply systems are a remnant of a historical era when water was thought to be more
plentiful (and cheap) than it is today. In the future, in the arid urban west, many secondary
supply systems will be converted to support urban potable uses, including in Washington
County. This transformation could be accomplished strategically and in a coordinated manner
that maximizes utilization of secondary water where it is located.
To ensure reduced municipal irrigation demands into the future, landscape design codes should
be adopted that mandate climate-appropriate landscapes. Examples of just a few water
providers in the Colorado River Basin that have strict landscape codes include:
• City of Las Vegas, Nevada 33
• Salt Lake County, Utah 34
• Los Angeles, (and all major cities) California 35,36
The WCWCD should implement a water budgeting approach to landscape water management
to determine the water requirement of current and future landscapes and help customers
manage water use to reasonable volumetric targets. A 2018 report from Western Resource
Advocates illustrates approaches to successfully integrating water efficiency and land use
planning. 37 It is easier and more cost effective to install appropriate landscaping on new
32
Landscape design rules to limit outdoor use have been implemented by water providers throughout the
Colorado River Basin including: Las Vegas Valley Water District, the Southern Nevada Water Authority, LADWP, San
Diego County Water Authority, and many others.
33
https://library.municode.com/nv/las_vegas/codes/code_of_ordinances?nodeId=TIT14PUSE_CH14.11DRPL_14.11.
150NETUINES
34
Chapter 19.77 - WATER EFFICIENT LANDSCAPE DESIGN AND DEVELOPMENT STANDARDS
https://library.municode.com/ut/salt_lake_county/codes/code_of_ordinances?nodeId=TIT19ZO_CH19.77WAEFLA
DEDEST
35
City of Los Angeles Landscape Ordinance. Ordinance No. 170,978
https://planning.lacity.org/odocument/3de931fb-5553-4db1-8d0b-
a1b4fcfaf0d5/Landscape_Guidelines_%5BCity_of_Los_Angeles_Landscape_Ordinance_Guidelines%5D.pdf
36
California Model Water Efficient Landscape Ordinance. https://water.ca.gov/Programs/Water-Use-And-
Efficiency/Urban-Water-Use-Efficiency/Model-Water-Efficient-Landscape-Ordinance
37
Western Resource Advocates. 2018. Integrating Water Efficiency Into Land Use Planning in the Interior West: A
Guidebook for Local Planners. https://westernresourceadvocates.org/publications/integrating-water-efficiency-
into-land-use-planning/
20construction at the time of construction rather than to wait and later pay to replace existing
water wasting landscapes.
Capping secondary water use at current levels of approximately 15,663 AF (average of recent
annual secondary water use from Table 6), provides up to 10,192 AF of additional reliable new
potable supply. Reducing future irrigation demand that might have used this water and
planning to convey and treat secondary water to culinary quality in the future is a necessary
management step. Secondary water systems can continue to use water and potentially expand
as long as average secondary demand does not exceed about 15,663 AF per year. By using
secondary water more efficiently, Washington County can effectively stretch this supply and
continue irrigation of lands currently receiving secondary water.
Store Virgin River Water in High-Flow Years
The variability in the hydrologic record indicates there will be above average flow years in the
future, but they may occur less frequently. For instance, data from the USGS indicate that from
2011 – 2020 average annual flows of the Virgin River at St. George were 105,715 AF, more than
20,000 AF less than the long-term average. 38 The DEIS states:
The Virgin River gage in Virgin, Utah is located upstream from any major diversions. The
long-term mean annual streamflow at this gage is 182 CFS. Annual streamflow is usually
greater than 100 CFS and in high water years can exceed 300 to 400 CFS. 39
In the hotter and likely drier future, the WCWCD and municipalities must develop systems for
diverting and storing water opportunistically in wet years when flows are high and water is
available. Underground storage using aquifer storage and recovery techniques would be the
best option for longer term storage and utilization of water from the Virgin River, but all
available storage options should be considered.
The purpose of this proposed opportunistic storage, and of most groundwater resources in
Washington County in the future, should be to provide safe yield supply in normal years and
essential backup supply during dry years when Virgin River flows are below average.
Aquifer Storage and Recovery
Managed aquifer recharge and recovery is already being pursued in Washington County40 and
should be expanded in the future to maximize utilization of underground storage to the extent
38
https://waterdata.usgs.gov/usa/nwis/uv?09413500 accessed Feb. 2021.
39
US Bureau of Reclamation. 2020. Lake Powell Pipeline Project, Draft Environmental Impact, Statement, Coconino
and Mohave Counties, Arizona, Kane and Washington Counties, Utah. U.S. Department of the Interior, Bureau of
Reclamation. June 2020.
40
The 2016 Final Water Needs Assessment states, “The Sand Hollow well field includes 13 wells that draw water
from pre-reservoir groundwater rights and from water recharged to the Navajo Sandstone Aquifer by Sand Hollow
Reservoir. Water is chlorinated and pumped to two storage tanks with a total of 3 million gallons of storage
capacity prior to delivery to RWSA municipal customers and Sky Ranch and Cliff Dwellers retail customers.”
21possible. Managed aquifer storage and recovery offers significant advantages over surface
water storage, such as eliminating evaporative losses and reducing environmental concerns
associated with reservoir projects.
An ongoing evaluation of aquifer storage and recovery at Sand Hollow is reported by USGS. 41
The 2016 Final Water Needs Assessment estimated that there is approximately 106,000 AF
stored in the aquifer that could be used. As is proposed for the storage of excel Virgin River
flows, the Water Needs Assessment recommends most of the recharged water stored in the
Navajo Sandstone Aquifer be reserved for use during dry periods to compensate for any deficit
between annual supply and demand.42
The success of the managed storage and recovery project at Sand Hollow Reservoir proves this
method of water storage is not only feasible for Washington County, but can generate
significant volumes of stored water. Additional advantageous locations should be explored so
that excess surface water flows can be opportunistically stored.
Adding underground water storage will increase reliability and enable Washington County to
better and more easily manage through drought periods when flows on the Virgin River are
below requirements.
Wastewater Reuse
As shown in Table 2, the DEIS lists an additional 7,300 AF of reliable secondary water yield that
will be available. Additional wastewater reuse capacity has long been proposed and planned for
by the WCWCD and the City of St. George.
Most recently, the 2019 Sewer Master Plan prepared for St. George by Bowen Collins &
Associates recommended the City continue exploring a satellite/decentralized treatment plant
that would provide additional reuse capacity.43 The report noted that while potentially more
expensive than expanding the centralized facility, a satellite wastewater facility could treat and
deliver reuse quality water closer to where it is needed. For example, the City of Hurricane
could treat wastewater from its existing sewer lagoons to produce reuse water for local golf
courses that currently rely on potable supply.
Plans for reusing water from the Lake Powell Pipeline, should it be completed, have also been
put forward in the 2016 final Water Needs Assessment which proposed an additional 17,120 AF
of reuse.44
41
USGS. 2018. Assessment of Managed Aquifer Recharge at Sand Hollow Reservoir, Washington County, Utah,
Updated to conditions Through 2016. Prepared in Cooperation with the Washington County Water Conservation
District. Open-File Report 2018-1140.
42
MWH. 2016. Lake Powell Pipeline Water Needs Assessment. Final. Utah Division of Water Resources.
43
Anderson, A. 2019. Sewer Master Plan, City of St. George. Bowen Collins & Associates.
44
MWH. 2016. Lake Powell Pipeline Water Needs Assessment. Final. Utah Division of Water Resources.
22Even without the Lake Powell Pipeline, additional wastewater reuse could be accomplished in
the future if additional supplies are needed. WaterDM estimates that up to an additional
15,000 AF per year of wastewater reuse could be developed. It can be developed far in the
future using indirect or even direct potable reuse methods as they become permissible.
Additional water reuse represents a valuable variably sized supply cushion which is available to
Washington County in the future, if needed.
Revised Supply Portfolio for Washington County
Rather than build the Lake Powell Pipeline, Washington County and the WCWCD have the
excellent option of relying on local water supplies. The Local Waters Alternative 2.0 includes a
revised portfolio of future water supply, updated demand management programs, and revised
demand forecast presented later in this report. This combination provides a reliable water
supply to meet the forecast future population of Washington County with much lower cost with
higher reliability and less risk.
The differences between Table 3 (based on information from the DEIS and subsequent official
updates) and the revised portfolio in Table 4, are that the revised portfolio includes:
1) A cap on additional secondary supply projects
2) A shift of 10,192 AF from planned secondary to planned culinary projects
3) Additional wastewater reuse (could be expanded to more than 15,000 AF if necessary)
4) Additional 50,000 AF – 150,000 AF of water supply not included in the DEIS 45
This revised portfolio provides a reliable future supply of 111,212 AF of culinary water and
15,693 AF of secondary water.
45
Listing of 147 water rights owned by the WCWCD is provided in Appendix B.
23Table 4: Local Waters Alternative 2.0 - revised portfolio of existing and potential
future reliable supplies of the WCWCD and municipalities, without the Lake Powell
Pipeline
Water Supply Reliable Culinary Water Reliable Secondary
Yield (AF) Water Yield (AF)
Current Supplies of the WCWCD 32,047 178
Current Supplies of Washington County 27,125 8,505
Municipal Providers
Planned Local Projects 23,740 7,010
Agricultural conversion 23,300
Subtotal 106,034 15,693
Additional Wastewater Reuse 5,000 – 15,000
111,212 – 15,693
Total 121,212
Additional groundwater and surface
50,000 – 150,000 AF
water supplies not included in the DEIS
Total Supply = Culinary + Secondary 176,905 – 286,905 AF
Figure 2 shows a comparison of the reliable water yields from the DEIS (Table 3) and the Local
Waters Alternative 2.0 (Table 4). The notable differences in the Local Water Alternative 2.0 are
the conversion of some planned local projects from secondary to culinary and the inclusion of
wastewater reuse, scaled to the requirements of the local community.
24You can also read