A new tropical cyclone surge index incorporating the effects of coastal geometry, bathymetry and storm information
←
→
Page content transcription
If your browser does not render page correctly, please read the page content below
www.nature.com/scientificreports
OPEN A new tropical cyclone surge index
incorporating the effects of coastal
geometry, bathymetry and storm
information
Md. Rezuanul Islam1*, Chia‑Ying Lee2, Kyle T. Mandli3 & Hiroshi Takagi1
This study presents a new storm surge hazard potential index (SSHPI) for estimating tropical cyclone
(TC) induced peak surge levels at a coast. The SSHPI incorporates parameters that are often readily
available at real-time: intensity in 10-min maximum wind speed, radius of 50-kt wind, translation
speed, coastal geometry, and bathymetry information. The inclusion of translation speed and
coastal geometry information lead to improvements of the SSHPI to other existing surge indices. A
retrospective analysis of SSHPI using data from 1978–2019 in Japan suggests that this index captures
historical events reasonably well. In particular, it explains ~ 66% of the observed variance and ~ 74%
for those induced by TCs whose landfall intensity was larger than 79-kt. The performance of SSHPI is
not sensitive to the type of coastal geometry (open coasts or semi-enclosed bays). Such a prediction
methodology can decrease numerical computation requirements, improve public awareness of surge
hazards, and may also be useful for communicating surge risk.
Storm surge associated with tropical cyclones has a long history of causing catastrophic damage and many deaths
along low-elevation (< 10 m) coastal zones. Based on a 2003 study, storm surge may be responsible for as many as
2.6 million deaths worldwide during the past 200 years1. As the Earth’s climate warms because of human activities,
a more severe, widespread storm surge hazard is projected with high confidence due to both the rising sea-level
and the possible increase in TC i ntensity2. Furthermore, coastal development results in high population density
in low-lying cities roughly five times (241 people/km2) than the global mean (47 people/km2)3. The storm surge
threat has never been greater and such concern is exemplified by several recent extreme surge events, such as
Hurricane Katrina (2005) that generated a peak surge of 8 m and made it one of the costliest ($149 billion) natural
disasters in the United States (US) h istory4. More recently, an 8 m storm surge due to Typhoon Haiyan (2013)
killed 6300 people and left 1061 missing in the Philippines5. Precise and timely forecasts informing effective
warnings are imperative to mitigate the risks to life and property posed by TCs and its associated storm surges6–8.
When quantifying and communicating natural disasters such as TC, practitioners and scientists have often
employed categorization-based statistical approaches for ease of public understanding and usefulness. For
instance, the Saffir–Simpson hurricane wind scale (SSHWS) has been using for nearly five decades by the National
Hurricane Center (NHC) in the US to categorize TC strength. Coastal inhabitants in the US thus have learned to
assess the danger of TCs using SSHWS, e.g., evacuation intent increases linearly with SSHWS c ategory9. Other TC
prone countries such as Japan10, Bangladesh11, Australia12 also warn their coastal inhabitants employing a wind
intensity-based scale, similar to SSHWS. However, these scales are defined based on wind-induced structural
damage and do not account for other crucial factors that influence surge g eneration13. Thus, SSHWS has been
widely criticized as an inappropriate estimate of storm surge p otential14–16.One argument is that although TCs
are often weakening during the landfall time frame, the storm surge potential may still be increasing at the same
time. Thus, a lower category TC (i.e., Category 1, 2 in SSHWS) can sometimes inflict a significant storm surge.
In the 2003–2008 period, hurricanes have generated three of the largest five surges occurring in the US within
the past 65 years. Yet none of these hurricanes registered higher than a category 3 hurricane at landfall15. Hur-
ricane Sandy (2012) highlighted the hazard posed by a weakening TC. Sandy approached the United States coast
as a category 3 hurricane, before weakening and making landfall as a post-tropical storm. It generated ~ 2.7 m
1
Department of Transdisciplinary Science and Engineering, School of Environment and Society, Tokyo Institute
of Technology, Tokyo 152‑8550, Japan. 2Lamont‑Doherty Earth Observatory, Columbia University, Palisades,
NY 10964, USA. 3Department of Applied Physics and Applied Mathematics, Columbia University, Palisades,
NY 10964, USA. *email: islam.m.ac@m.titech.ac.jp
Scientific Reports | (2021) 11:16747 | https://doi.org/10.1038/s41598-021-95825-7 1
Vol.:(0123456789)
www.nature.com/scientificreports/
storm surge and resulted in more than 60 direct deaths from drowning17. Another recent example is TC Amphan
(2020) which approached India–Bangladesh coast as a category 5 hurricane. Although, Amphan made landfall
as a category 1 hurricane, it resulted in ~ 2.75 m storm surge and claimed hundreds of lives18. Considering storm
surge is an extremely life-threatening hazard, there is an obvious need for an alternative means of more effectively
characterizing TC surge potential.
Numerical simulation-based surge modeling also shows that wind speed is not the only storm parameter
that markedly influences surge extent. Weisberg and Z heng19 found that the greatest storm surge events would
occur when a hurricane makes landfall to the north of Tampa Bay (US), resulting in maximum winds at the
mouth (i.e., the south) of the bay. Irish, Resio, and R atcliff15 evaluated the relationship between hurricane size
(radius to maximum wind speed: Rmax) and maximum storm surge over idealized continental shelf slopes. Their
results demonstrated that storm surges tend to increase with hurricane size and that this relationship becomes
increasingly pronounced for shallow coastal waters. Sebastian et al.20 found that storm surge behavior is highly
sensitive to the local wind direction and landfall location. These findings support the conclusion of our recent
work21, in which we showed that storm surge characteristics in a semi-enclosed bay, such as Tokyo bay in Japan,
is largely sensitive to the landfall location, local wind direction, and storm size.
Other factors, including TC forward speed and coastal geometry are also found to be influential to surge
generation in many previous studies. For example, J elesnianski22 performed numerical experiments and found
that a fast-moving TC (> 48.2 km/h) tended to intensify the storm surge. This tendency was also reported by
Rego and Li23, who used Hurricane Rita (2005) as a reference storm; they demonstrated that faster propagation
speed resulted in a greater surge but decreased the potential of the largest flood area along the open coasts of the
Louisiana-Texas shelf. However, Peng, Xie, and P ietrafesa24 found that both the surge height and inundation areas
over the Croatan-Albemarle-Pamlico Estuary decreased as hurricane forward speed increased. Using 42 years
of tidal records and landfall TC best tracks in Japan, Islam and T akagi25, showed that fast-moving TCs tended to
amplify the storm surge along open coastlines but reduced the surge at semi-enclosed bays (vice-versa). Several
recent studies26,27 suggested that the forward speed of TCs has decreased significantly both at the global and
regional scales. It indicates that coastal areas have experienced a longer influence of time by TCs. Therefore, it is
of great interest to incorporate TC forward speed and coastal geometry information in the surge index.
Table 1 lists the existing surge indices. None of them considered TC forward speed with the exception of Van
Ormondt et al.28 and coastal geometry (surge estimates for bays and open coasts separately). Another common
limitation is that some of them can only be applied to NHC’s responsible area because they use TC structure
variables (i.e., the radius of 64-kt wind (R64), Rmax) that are only available in the Atlantic hurricane forecasting
database29 (NHC data archive; Table 1). It also needs to be noted that using R64 limits the usage of indices given
that TCs do not always have 64-kt winds. Here, we present a new surge index that uses TC characteristics from
best track data combined with regional bathymetry information to predict TC’s peak surge potential with varying
coastal geometry. Our approach is more advanced than existing indices in that we add TC forward speed and
coastal geometry; meteorological parameters used in the new index are those most common and often readily
available at real-time in TC forecasted track data. As shown in the analysis of the new index section, we will apply
the surge index to predict TC-induced peak surge potential in Japan. We focus on the Japanese coastlines due to
its geographical uniqueness with various types of coastal geometry and the availability of an extensive long-term
dataset pertaining to TC best track and tide data provided by the Japan Meteorological Agency (JMA). Our sim-
plified approach provides an instantaneous overall estimate of a TC’s peak surge potential, which can supplement
computationally expensive TC surge model forecasts. By providing a potential peak surge, the proposed index
can be used to inform the public and emergency responders as a means of quantifying surge hazard effectively,
similar to the role the SSHWS plays for wind hazard during a TC event.
Historical indices
After the devastating damages incurred by Hurricane Katrina in 2005, Kantha32,33 was one of the first who criti-
cized the SSHWS and suggested a non-dimensional relationship for estimating surge damage potential (hurricane
surge index, (HSI)) based on TC intensity (Vmax) and radius of hurricane force wind (R33):
Vmax 2 R33
HSI = (1)
Vref Rref
Vref and Rref are climatological reference constants: 33 m/s and 96.6 km. This scale has the advantage of
yielding a continuous scale and does not saturate at the higher end as SSHWS does at category 5. Larger values
of HSI indicate more severe surge damage potential. The HSI has quadratic dependence to Vmax because wind
momentum input at the water surface is proportional to V2max. The reason for the linear dependence of HSI on
the storm radius is because the storm surge impact is most often confined to a broad but roughly linear strip
along the c oastline33. Another underlying assumption that is not directly discussed in K
antha32,33 but may fit with
Eq. (1) is that integration of storm size and wind strength over the footprint of the TC provides a bulk amount
of energy/momentum transferred from the storm to the water column and thus the functional dependence of
the total water level on the velocity and storm radius.
Following Kantha’s32 lead, Powell and R einhold14 proposed a ranking based surge damage potential ( SDP) for
the US coasts considering the integrated kinetic energy of the hurricane wind field:
√ √
SDP = 0.676 + 0.43 IKETS − 0.0176( IKETS ) − 6.5)2 (2)
where, IKETS is the integrated kinetic energy for marine winds greater than tropical storm force (18 m/s). The
larger value of S DP indicates more severe surge damage potential but with an upper bound limit at 6 14.
Scientific Reports | (2021) 11:16747 | https://doi.org/10.1038/s41598-021-95825-7 2
Vol:.(1234567890)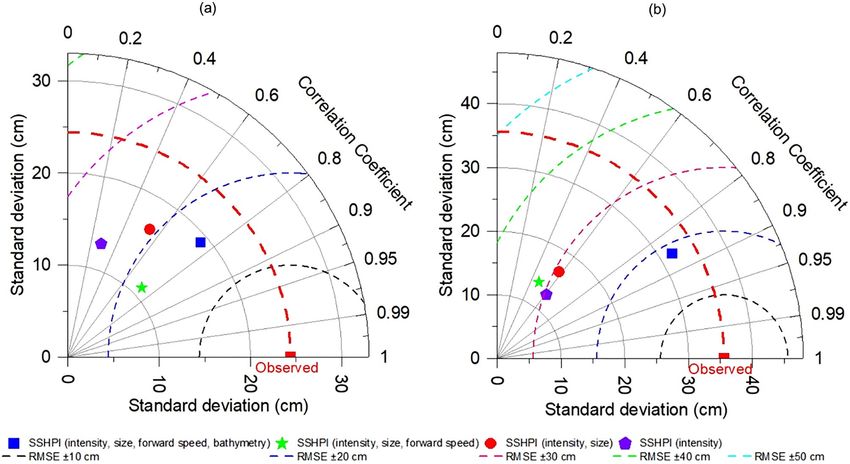
www.nature.com/scientificreports/
Predictors
TC intensity TC size Variation
in coastal
Maximum Pressure Radius to geometry
sustained deficit at the maximum Radius to Radius to Radius to (separating
wind speed center of the wind speed 34-kt wind 50-kt wind 64-kt wind TC forward open coasts Bathymetry Other
Index Predictand (Vmax) TC (∆P) (Rmax) speed (R34) speed (R50) speed (R64) speed and bays) information variables
Saffir-Simp-
son hurri-
cane scale30,31 Categorized
×
(current surge
name:
SSHWS)
Hurricane
Storm surge
surge index × ×
impact
(Eq. 1) 32,33
Surge dam-
Surge dam-
age potential × ×
age potential
(Eq. 2) 14
Surge scale
Storm surge × × ×
(Eq. 3) 34
Area of
Tropical
Surge dam- surface wind
cyclone surge ×
age potential speed greater
index35
than 34-kt
Fiscal dam-
ages from
storm surge
Kuykendall Storm surge
flooding,
scale36 impact
ADCIRC
simulation
output data
Distance
from landfall
location,
track angle,
Semi empiri- inflow angle,
cal storm continental
Storm surge × × × ×
surge predic- slope and
tion 28 shelf width,
Delft3D-
FLOW
simulation
output data
Table 1. A comparison of the characteristics of existing storm surge indices.
esio34 addressed the relative importance of water depth variation across the continental
Later, Irish and R
shelves adjacent to the US and proposed an improved dimensionless and continuous surge scale (SS) is of the
form
R33
SS = (2.43E −4)�pL30m �x (3)
L30m
R33 R33 R33 R33 R33
ψx = when ≤ 1 and ψx = 1 when > 1.
L30m L30m L30m L30m L30m
In Eq. (3), ∆p is the hurricane central pressure difference, defined as the nominal atmospheric pressure
around a hurricane minus the central pressure of that hurricane and directly proportional to the V2max. L30m is
the horizontal distance (km) between the shoreline and the 30 m depth contour and ( LR30m 33
) is thus the ratio of
the storm size to L30m. Ψx is the dimensionless storm size function to adjust that ratio. L30m used in the scale is
because Irish and Resio34 found that surge generation tended to be confined between the shore and the 30-m
depth contour for the five representative shelf profiles in the US. Chavas et al.37 has also reported similar results
where they suggested L30m is an optimal characteristic length scale for storm surge generation in the US coasts.
Irish and Resio34 argued that Eq. (3) behaves fundamentally different to Eq. (1) and Eq. (2), as it introduces an
upper bound of storm size by limiting Ψx ( LR30m33
) based on ( LR30m
33
).
While SS shows improvement over the previous indices (SSHWS, HSI, and SDP) for estimating surge potential,
it was only validated with limited observed peak open coast surge values with sample size (n) = 29, leaving no
index-based method for bays or estuaries. K antha38 argued that it is better to consider TC forward speed in the
Eq. (3) as the TCs’ temporal response depends on the ratio of the storm residence time scale to the shelf response
time scale. Again, to the best of the authors knowledge, there is no index that investigated the combined influ-
ences of TC forward speed, size, intensity, bathymetry, coastal geometry, and long-term storm surge observations
over a large area (i.e., for a country or globally).
Scientific Reports | (2021) 11:16747 | https://doi.org/10.1038/s41598-021-95825-7 3
Vol.:(0123456789)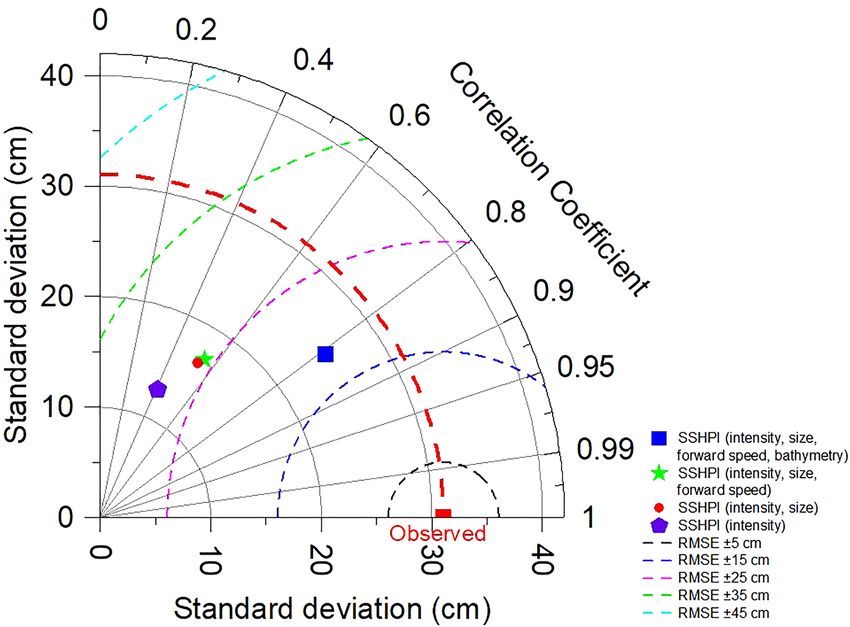
www.nature.com/scientificreports/
Formulation of new index
Here we propose a dimensionless and continuous storm surge hazard potential index (SSHPI) (Eq. 4). The
2
mathematical equation of SSHPI adopts and modifies those from Eqs. (1) and (3) (intensity ( VVmax
ref
) , size ( RRref
50
),
and bathymetry ( L∗ )) and further adds coastal geometry parameter (a) and TC forward speed information (S)
L30
introduced in Islam and T akagi25:
Vmax 2 R50 S a L30
SSHPI = . (4)
Vref Rref Sref L∗
� �a
S
R50 if ≥ 1.5
if ≥ 1.5
� 1.5�a
1.5 Rref Sref
� �a
R50 R50 R50 S S S
� �a
= Rref if 0.5 < Rref < 1.5 ; = Sref if 0.5 < Sref < 1.5
Rref Sref � �a
0.5 if RRref
50
≤ 0.5
0.5 S
if Sref ≤ 0.5
Specifically, R50 is a measure of radius to 50-kt (26 m/s) winds (nautical mile (nm)), S is the forward speed
(km/h), a is the characteristic coastal g eometry25: for open coast, a = 1 and for semi-enclosed bay, a = − 1. As
TC’s wind field can be highly asymmetrical, making it difficult to determine the actual aerial coverage of the
wind field with a specific s peed29,39, we use the arithmetic average of the longest and shortest R50. The reason of
using R50 instead of R33 is because the former one is recorded consistently in HURDAT2 (Atlantic Hurricane
Database), JMA, and JTWC (Joint Typhoon Warning Center) forecast/best track data sets for all named storms
and is available for all landfalling TCs since 2004, which would reduce challenges that arise when applying an
index on a global or a regional scale. Furthermore, the relationship between R50 and storm surge forecasting has
been discussed in many prior studies21,29,40,41.
Vref, Rref, and Sref are reference constants and are defined as 50-kt, 95 nm (historical mean R50 in J apan42), and
35 km/h (historical mean translation speed of TCs impacting in Japan42), respectively. L* is chosen to be 40 km
to make SSHPI roughly equal in magnitude to the peak storm surge height. These reference values are used for
normalization that prevents the index values from being biased toward extreme values. The structure of Eq. (4)
does not represent the orderly contribution of each SSHPI component in generating surge hazards.
It is noted that a stationary or very slow-moving TC (i.e., S = 5 km/h) would result in very low SSHPI numbers
(using Eq. (4)) on the open coast and extremely high numbers in semi-enclosed bays (vice-versa). TC with a
very large size (i.e., R50 = 170 nm) would also result in very high SSHPI numbers (vice-versa). Although such
TCs are infrequent in Japan but can sometimes occur elsewhere. The form of Eq. 4 without upper and lower
bound of TC size and forward speed would probably not be a good representative for the surge hazard poses by
S a
such unusual TCs. Therefore, we limit 0.5 ≤ ( RRref 50
) ≤ 1.5 and 0.5 ≤ ( Sref ) ≤ 1.5 in Eq. (4) when S and R50 are
exceptionally large or small. This upper and lower bound of TC size and forward speed will prevent discrete
jumps in SSHPI numbers.
The linear dependence of SSHPI on TC forward speed is twofold. First, in semi-enclosed bays, the effective
cross-shore shallow area over which TC winds act is larger; the contribution of wind stress tends to be more
pronounced in the bay than the open coastlines due to a shallower depth43. Also, the time scale for mass redis-
tribution (to generate a sea surface slope) within the shallow and geometrically complex estuaries is on the order
of hours and longer than along the open c oasts19. Thereby, with cross-shore wind stress components, a slower
TC has more time to interact with the seawater and pushes more into shallow areas of a bay. Consequently, surge
height begins to fully develop (or mature), causing a large sea-level gradient between the upper and lower bay.
Thus, we set a = − 1 for semi-enclosed bay and by construction, large (i.e., R50 > 95 nm), but slow-moving (i.e.,
S < 35 km/h) and intense (i.e., Vmax > 50-kt) TCs will generate greater storm surge potential.
On the contrary, in the open coastlines, it is plausible that a fast-moving TC would energize a shelf wave and
cause an increased storm surge because the TC translation speed tends to coincide with the long-wave propaga-
tion speed44. This mechanism could be partially explained by Proudman’s linear theory45, which showed that
storm √ surges could be amplified when the TC translation speed was similar to the propagation speed of the long
wave ( gh). With a set to 1, fast-moving (i.e., S > 35 km/h) storms will generate larger SSHPI. It should be noted
that we did not directly consider inverse barometer effect (IBE) and the influence of TC approach angle, waves,
and astronomical tide to keep SSHPI simple. Thus, SSHPI will tend to underestimate/overestimate total surge
height somewhat for some TC events. The limitation is particularly relevant in open coasts, where wave set-up
and IBE are often the dominant drivers behind storm surge and coastal flooding46–48. Furthermore, a very steep
coast (i.e., L30m = 0.5 km) would result in a low SSHPI number (using Eq. 4), a strong TC could, however, still
cause significant storm surge. Lastly, the SSHPI computes peak surge hazard potential at points in the coasts,
but the prediction of seawater inundation in coastal land areas remains beyond its scope.
Data and method
We use JMA best track data archives from 1978 to 2019. The best track data acquired during the pre-satellite
era (i.e., before 1978) contain inhomogeneities and large uncertainties in the data quality49,50 and therefore were
ignored. JMA best-track data contain 6-hourly TC central position, intensity, size, and forward speed informa-
tion. TCs were selected based on the following criteria: (a) TCs that made landfall in Japan; (b) TCs that incurred
a minimum of 40 cm of storm surge, and (c) TCs that had intensity, size (R50), and forward speed information
(during landfall time frame) were available. The choice of 40 cm is to evaluate storm surge index accuracy for
more severe storm surge events.
Scientific Reports | (2021) 11:16747 | https://doi.org/10.1038/s41598-021-95825-7 4
Vol:.(1234567890)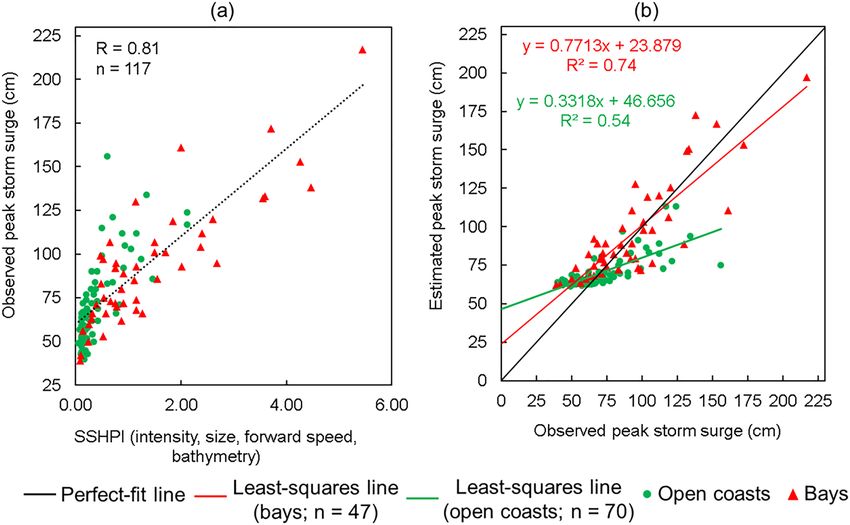
www.nature.com/scientificreports/
Figure 1. Best track for historical TCs42 making landfall (based on the criteria used in this study) during 1978–
2019 over the four major Japanese islands (Honshu, Shikoku, Kyushu, and Okinawa). Two different symbols
indicate seven stations in semi-enclosed bays and 11 stations in open coasts. Map is created using ArcMap (v.
10.2).
Based on the above three criteria, 51 TCs were selected for analysis (Fig. 1). Among them, 15 made landfall
directly over open coastlines (directly facing the Pacific Ocean), while seven directly hit bay areas (regions sur-
rounded by two land areas that form a concave-shaped coastline). The remaining 29 TCs made landfall between
open coastlines and bay areas and impacted both regions. Of the 51 TCs, 19 (10) TCs impacted more than one
tide station located on the open coastlines (bay areas). As a result, there were 70 and 47 available storm surge
cases for open coasts and bay areas, respectively and thus, 117 cases total. Since the sample size (n) is small and
excludes several significant surge events that occurred before 1978, such as TC Vera (1959) and Nancy (1961),
these may influence the overall statistics (i.e., overestimate/underestimate significant surge events) shown in the
present study. Nonetheless, the period from 1978 to 2019 is the longest period covered by the JMA best track
with uniform data quality.
Table 2 shows the predictors used in the SSHPI. For sensitivity tests, we also use the radius of tropical storm
wind speed (30 kt, R30) instead of R50. Note that JMA provides two types of wind radius information: the longest
and shortest r adius42. The translation speed at time T is calculated with the TC central positions at T and T – 6 h.
For cases in which translation speed, intensity, and R50 data was unavailable immediately before TC landfall time,
those data were obtained via linear interpolation of the available data at two neighboring positions (nearest before
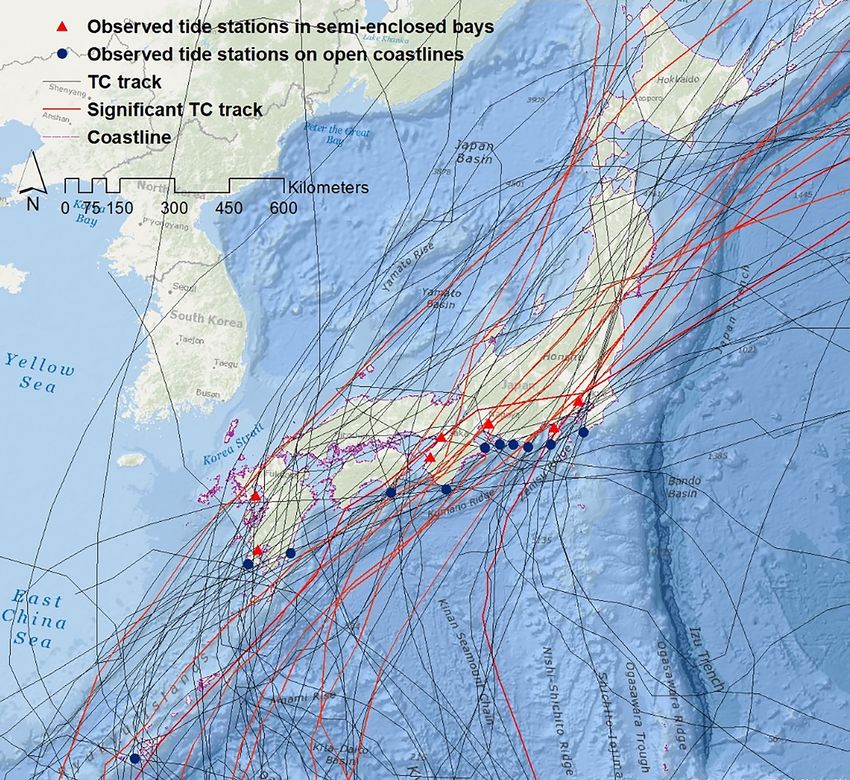
and after landfall). The bathymetry data over the target area was obtained from the Japan Coast G uard51. GIS
environment was used to measure the closest horizontal distance between each selected tide station and 30 m
depth contour (L30m) (i.e., Fig. 2b,f,h,k).
The storm surge heights recorded at 18 JMA-operated tidal s tations52 were used to estimate the peak storm
surge for each TC. These stations satisfied the following criteria: (a) located on open coastline or in a bay; (b)
JMA predicted astronomical tide data53 were available; (c) elevation of the observation reference plane and the
astronomical tide table reference plane were available; (d) fell right side of a selected TC track and located within
Scientific Reports | (2021) 11:16747 | https://doi.org/10.1038/s41598-021-95825-7 5
Vol.:(0123456789)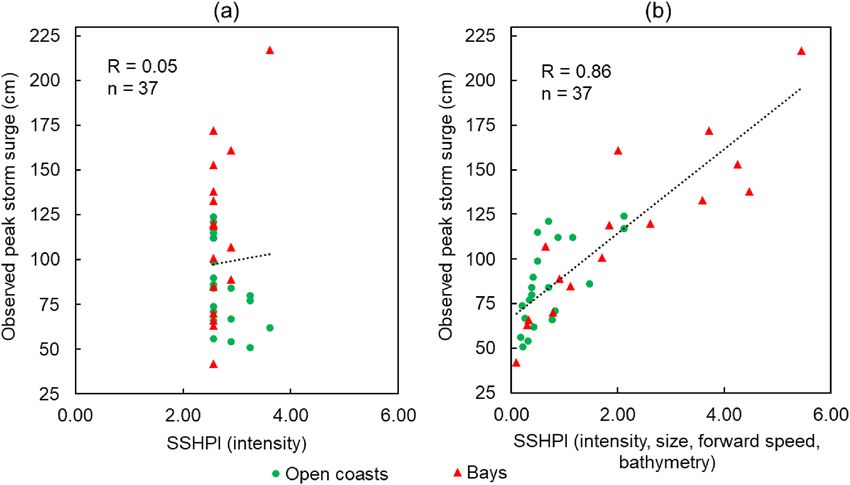
www.nature.com/scientificreports/
Resolution
Database Type Temporal Spatial Unit Data range
TC 10 min—sustained wind speed42 Best track 6 hourly ‒ kt 1978–2019
TC central sea-level pressure42 Best track 6 hourly ‒ hPa 1978–2019
TC Size (radius of 50-kt wind, radius of 30-kt
Best track 6 hourly ‒ nm 1978–2019
wind)42
42
TC Forward speed Best track 6 hourly ‒ Km/h 1978–2019
Coastal bathymetry51 Gridded bathymetry data ‒ 500 m m 24°N—46°N 122°E—148°E
Observed storm ride52 ‒ 1 hourly ‒ cm 1978–2019
Predicted astronomic tide53 ‒ 1 hourly ‒ cm 1978–2019
Observed storm surge52 ‒ 1 hourly ‒ cm 1978–2019
Table 2. TC databases and their scope and limitations based on coverage, resolution, and availability.
the range of R50 (during TC landfall time frame); and (e) no data were missing when a TC traversed the station.
Eleven stations (Naha, Makurazaki, Aburatsu, Murotomisaki, Kushimoto, Toba, Akabane, Maisaka, Omaezaki,
Irouzaki, and Mera) were selected as representative observatories for storm surges on open coastlines and seven
(Oura, Kagoshima, Osaka, Wakayama, Nagoya, Uchiura, and Harumi) were selected as representative observa-
tories for storm surges in semi-enclosed bays. Figure 2 provides details of the selected tide stations. Sea surface
anomalies were assumed to be the storm surge magnitude, and they were estimated by deducting the predicted
astronomical tide from the observed storm tide.
Analysis of the new index
The performance of SSHPI. The SSHPI is positive proportional to the peak surge height. Fig. 3a shows
that the Pearson correlation statistic (R) between SSHPI and observed surge height is 0.81 (p < .01 at 95%
confidence level) and explains ~66% of the observed variance. These statistics are comparable to storm surge
estimation obtained from full physical numerical surge models54,55 which comprehensively account for coastal
surge dynamics.
In the sensitivity test where we replaced Vmax with ∆p as an intensity metric in Eq. (4). The resulting R statistic
between SSHPI and observed surge height remains almost unchanged (not shown); this may be because that the
Vmax and MSLP are strongly associate with each other (R = 0.83, p < 0.01; not shown) as discussed in previous
studies56–58. Correlation corresponding to the R30, was also calculated to explore whether any other definition of
size metric would provide a better correlation than R50. The correlation statistic did not vary markedly (R = 0.79,
p < 0.01) from the statistic presented in Fig. 3a. The performance of SSHPI is insensitive to Vmax vs. MSLP and
R50 vs. R30 and thus, the alternative parameters (MSLP and R30) could potentially be used at a basin for a period
where Vmax and R50 are unavailable.
Next, in an attempt to make sure that the significant storm surge events did not skew the Pearson correlation
analysis, we performed additional correlation analysis for SSHPI but excluding the three highest storm surge
events caused by Typhoon Mireille (1991), Typhoon Flo (1990), and Typhoon Jebi (2018). While the correlation
coefficient decreases slightly, from 0.81 to 0.75 (p < 0.01), it remains significant and strong.
A least squares-fit between surge height and SSHPI (Fig. 3a) gives an empirical relationship between the two:
ξest = 25.14 × SSHPI + 60.05 (5)
We emphasize that we favor predicting SSHPI—an index-based parameter, instead of a direct surge measure
to mimic SSHWS for easy public communication. Still, Eq. (5) provides a path to convert SSHPI to peak surge
height (ξest). The scatter plot (Fig. 3b) illustrates that the ξest also correlates well with the observations, similar R
statistic as for SSHPI. This is expected since they are linearly related to each other (not shown). Fig. 3b exhibits
majority of the ξest are close to the observations. Root-mean square error (RMSE) in the estimated surge is
±18.09 cm, smaller than JMA’s numerical storm surge prediction model e rrors47 (±50 cm). It needs to be noted
that JMA applies TC wind and pressure field to the numerical storm surge model as external forcing. Their TC
model diagnoses wind and pressure fields using the necessary input of forecast values, including the TC center
location, minimum pressure at the center, Vmax, R50 (if present), and the radius of 1000 hPa46. The difference in
RMSE between SSHPI and JMA numerical model predicted surges is primarily because meteorological inputs
for current SSHPI analysis are from best track data (post-processed), while JMA evaluated their surge model
applying forecasted products during the period of 2015-201747. Nonetheless, operational forecasts of TC have
been improving gradually, the performance of SSHPI showed in this study may not be affected significantly in
forecast settings (considering SSHPI inputs are from TC forecasted advisories). The performance of the Eq. (5) for
estimating storm surge height decreases (the least-squares line diverges from the best-fit line) for more significant
surge cases. The underestimation of significant surge levels may be due to the simplified physics considered in
SSHPI and/or the observational errors.
Given the limitation that R33 used in other indices is not included in the JMA best track data set, therefore,
it is not possible to compare the performance of SSHPI with other surge indices (i.e., HSI32,33, SS34) for TCs in
Japan. However, we attempted to apply SSHPI for the US significant surge cases (see Supplementary Informa-
tion for data details and Supplementary Fig. S1) and compared the results with HSI (Eq. 1) and SS (Eq. 3). The
Scientific Reports | (2021) 11:16747 | https://doi.org/10.1038/s41598-021-95825-7 6
Vol:.(1234567890)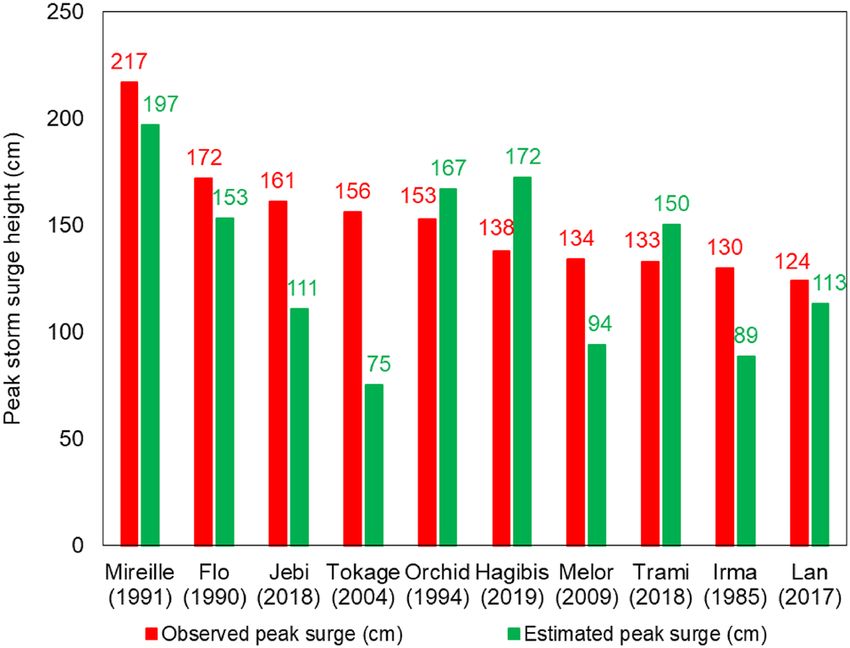
www.nature.com/scientificreports/

                                  Figure 2.  Location map of observed tide stations (a) Naha, Okinawa island; (b) Oura, Kyushu island; (c)
                                  Makurazaki and Kagoshima, Kyushu island; (d) Aburatsu, Kyushu island; (e) Murotomisaki, Shikoku island; (f)
                                  Osaka, Honshu island; (g) Wakayama and Kushimoto, Honshu island; (h) Toba, Nagoya, and Akabane, Honshu
                                  island; (i) Maisaka, Omaezaki, and Uchiura, Honshu island; (j) Irouzaki, Honshu island; (k) Harumi, Honshu
                                  island; (l) Mera, Honshu island. All maps are created using ArcMap (v. 10.2).

                                  analysis (see Supplementary Fig. S2) shows that SSHPI appropriately reflects the relative magnitude of expected
                                  surge (R = 0.85; p < 0.01).
                                     Next, we use the probability of detection (POD)59, the false alarm ratio (FAR)59, and the bias score (BS)59 to
                                  assess the accuracy of the SSHPI quantitatively. Their mathematical forms are:
                                                                        (hits)
                                                         POD =                      ; 0 ≤ POD ≤ 1; the perfect score is 1                       (6)
                                                                  (hits) + (misses)

Scientific Reports |   (2021) 11:16747 |              https://doi.org/10.1038/s41598-021-95825-7                                                 7

                                                                                                                                            Vol.:(0123456789)
www.nature.com/scientificreports/
Figure 3. (a) Observed TC peak surges (ξ) versus SSHPI (Eq. 4) as a function of intensity, size, forward speed,
and bathymetry. Dashed line shows the correlation gradient of the respective surge (ξ) and SSHPI; (b) Scatter
plot of estimated (Eq. 5) and observed peak storm surge heights at selected stations.
(false alarms)
FAR = ; 0 ≤ FAR ≤ 1; the perfect score is 0 (7)
(hits) + (false alarms)
(hits) + (falsealarms)
BS = ; 0 ≤ BS; the perfect score is 1 (8)
(hits) + (misses)
All three scores (Fig. 4) suggests that the SSHPI performs better for events with smaller surge heights (i.e., ≤
99 cm) than for those with larger storm surges (i.e., ≥ 100 cm). For example, the BS score for minor surge events
is close to 1, while it is 0.5 for significant surge events. The BS and FAR scores indicate that SSHPI is unlikely to
overestimate the peak surge height.
SSHPI dependency on the predictors. To better understand the dependency of the SSHPI on its pre-
dictors, statistical measures (standard deviation (σ), RMSE) and correlation analyses were conducted using the
versions of SSHPI that do not include all of the predictors, i.e., reduced versions of SSHPI (SSHPI (intensity);
SSHPI (intensity, size); SSHPI (intensity, size, forward speed)). Figure 5 shows that a TC intensity-based scale,
which is similar to the traditional SSHWS, is only weakly correlated with observed surge (R = 0.41; (p < .01)),
largest RMSE (±28.22 cm) and different variability (σ = 12.7 cm) than the observations (σ = 31.06 cm). Gradual
improvements are apparent as the TC parameters (size and forward speed information) are added to the surge
indices and they have R = 0.50 (p < .01) and R = 0.55 (p < .01), respectively. It is worth noting that the Pearson
correlation statistic for SSHPI (R = 0.81, p < .01) shows significant improvement over all three of the surge indi-
ces and the differences are significant at the 5% level. Comparing to other indices, SSHPI has similar variability
(σ = 25.19 cm) as the observations has, the highest correlation, and the least RMSE (±18.09 cm). A similar result
can also be confirmed utilizing principal component analysis.
Batstone et al.60, Maskel et al.61, and Lyddon et al.62 have noted that surge predictions are complicated in
estuaries or bays due to its topographic features, shape, and tide-river flow interactions. In other words, one can
expect that the dependence of SSHPI and the predictors may vary with the coastal geometry. Thus, here we repeat
analyses for Fig. 5 but using data for open coasts (n = 70; Fig. 6a) and semi-enclosed bays (n = 47; 6b), respectively.
Correlation between storm surge height and SSHPI in both cases are still much higher than those between Vmax
and storm surge height and the RMSE is much lower. In particular, Vmax substantially underperforms in predict-
ing surge potential along the open coastlines (Fig. 6a). It is reasonable as the wind set-up is generally quite limited
in open coasts (due to steep coastline) and the IBE, wave set-up, and ocean currents dominate surge h azard46–48.
Nonetheless, adding TC size and forward speed largely increases the correlation and reduces the RMSE and helps
to explain ~ 50% more of the observed surge variance (Fig. 6a). In the semi-enclosed bay areas, adding bathymetry
information improves the surge variance by ~ 37% (Fig. 6b). The bay areas are typically characterized by shallow
water (i.e., less than 30 m) which largely modulates local storm surge p rofiles63. It needs to be noted that wind
Scientific Reports | (2021) 11:16747 | https://doi.org/10.1038/s41598-021-95825-7 8
Vol:.(1234567890)www.nature.com/scientificreports/
Figure 4. Verification scores for SSHPI estimated storm surges. Error bars show two-sided 95% confidence
intervals.
Figure 5. Taylor diagram describing the performance of SSHPI by comparing with the reduced versions
of SSHPI. The azimuthal angle represents correlation, the radial distance the standard deviation, and the
semicircles centered at the “Observed” marker the root mean square error. The red dashed line constitutes the
standard deviation of observed peak storm surge heights (n = 117).
set-up and bathymetry together can explain ~ 59% surge variance in semi-enclosed bays, the contribution of TC
size and forward speed, however, is not negligible (improves by ~ 15%; see Supplementary Fig. S3). Overall, these
results support the previous s tudies14,21,28,32,34 that storm surge potential is more than a function of the intensity
of the TC, while surge is potentially driven by the size, forward speed, and amplified by TCs making landfall in
shallow coastal areas such as bays.
Scientific Reports | (2021) 11:16747 | https://doi.org/10.1038/s41598-021-95825-7 9
Vol.:(0123456789)www.nature.com/scientificreports/
Figure 6. Taylor diagram describing the performance of SSHPI with varying coastal geometry (a) open coast
(n = 70); (b) semi-enclosed bays (n = 47). The azimuthal angle represents correlation, the radial distance the
standard deviation, and the semicircles centered at the “Observed” marker the root mean square error. The red
dashed line constitutes the standard deviation of observed peak storm surge heights.
Figure 7. Top ten storm surge events in Japan since 1978 and the estimated peak surge using SSHPI (Eqs. 4 and
5).
Hindcasting major storm surge events. We next examine the accuracy of SSHPI in predicting major
storm surge events using two criteria: (a) estimating the largest ten storm surge events (using Eqs. 4 and 5)
impacting the Japanese coastlines over the last 42 years (tracks are shown in Fig. 1) and (b) storm surges (n =
37) caused by TCs that had wind speeds ≥ 80-kt during the landfall time frame. Figure 7 shows that for the two
largest surge events caused by TC Mireille (1991); TC Flo (1990), the SSHPI is larger than 3.7 (Fig. 3a), and the
estimated surge heights are 197 cm and 153 cm (Eq. 5), both are close to the observed value, 217 cm and 172
cm, respectively. For TC Jebi, the SSHPI value based on meteorological observations is 2.01, which suggests
a surge level of 111 cm. The observed peak surge for Jebi is 161 cm (at Osaka). In the case of Jebi, surge was
largely contributed to by high waves64–66, which is not considered in the SSHPI. The SSHPI also underestimates
the observed value of Tokage in 2004. This may be because the observation site (Murotomisaki) is located on a
Scientific Reports | (2021) 11:16747 | https://doi.org/10.1038/s41598-021-95825-7 10
Vol:.(1234567890)www.nature.com/scientificreports/
Figure 8. TC intensity-based (Vmax ≥ 80-kt, during landfall time frame) definition of major storm surges versus
(a) SSHPI as a function of intensity; (b) SSHPI as a function of intensity, size, forward speed, and bathymetry;
Dashed line shows the correlation gradient of the respective surge and SSHPI.
steep-slope coast facing the open sea, where the combined influence of wave-set up and IBE is large. Overall, the
estimated major storm surge events agree well with the recorded surge data, although RMSE increases to ±38.7
cm for this set of surge events than the RMSE (±18.09 cm) for all storm surge cases.
If we use TC intensity-based (Vmax) definition of major storm surge events, Fig. 8 shows SSHPI can predict
storm surge hazard potential with much greater certainty (R = 0.86, p < 0.01; Fig. 8b) than the intensity-based
scale (R = 0.05, p > 0.05; Fig. 8a). SSHPI appropriately assigns relatively higher values for the major surge events.
For the storm surge records more than 115 cm, the SSHPI is roughly 2.4 or larger. It is worth noting in Fig. 8a that
storm surge magnitudes significantly differ under the similar intensity category of historical TCs and surge has
been overstated in most of these cases. In the present storm surge dataset since 1978, there have been a total of
37 events caused by TCs that had the wind speed ≥ 80-kt during the landfall time frame (Table S1). A total of 30
storm surge events including four major storm surge events (listed in Fig. 7) including Flo (1990), Mireille (1991),
Orchid (1994), and Lan (2017) can be better predicted with the SSHPI based scale than with the TC intensity-
based scale (Table S1). It needs to be noted that except TC Mireille (category 2, Vmax = 95-kt), the rest were simply
categorized as category 1 hurricanes (64-kt ≤ Vmax ≤ 82-kt) during the landfall time frame in SSHWS scale.
While the SSHPI appropriately reflects the relative magnitude of historical surge events using JMA best track
data, questions regarding the applicability of SSHPI in operational forecast settings may arise. As forecasted
advisories for historical TCs in Japan are publicly unavailable, further study is required. Moreover, transdisci-
plinary efforts and collaboration between operational agencies and academics are required before SSHPI could
be suitable for an operational forecast communication product. Nonetheless, we attempted to utilize SSHPI in
the NHC forecast settings to quantify surge hazard for Hurricane Katrina around the Mississippi coasts, US
(see Supplementary Fig. S4). The results show that SSHPI accurately characterizes the surge hazard caused by
Katrina a day before the impacts were realized. It is also noticeable that SSHPI can describe the distribution of
peak surge hazards around the landfall point at a large spatial scale.
Summary and conclusion
Here we demonstrated the development of a new storm surge hazard potential index (SSHPI) for quantifying/
categorizing TC induced surge events in Japan. When applied retrospectively, it explains ~66% of the observed
variance. A fundamental difference between the SSHPI and existing indices is that it considers coastal geometry
and storm forward motion speed in surge estimates. Using reduced-versions of SSHPI, we found that while surge
estimation derived from using only intensity and storm size information provides less information on the overall
surge hazard than does full form of SSHPI.
SSHPI utilizes the most common and readily available TC meteorological parameters, coastal geometry, and
bathymetry information and thus can, hopefully, be applied to surge extremes produced by TCs in other basins
(i.e., North Atlantic, North Indian Ocean). However, in that case, the index values and its associated hazard
potential showed in this study likely have to be revised, as the surge hazard potential may be different in other
basins. For instance, SSHPI values larger than 4.0 are representative of extremely dangerous for Japan, however,
it may not necessarily constitute similar surge hazard potential in areas characterized by a large continental shelf
or shallow ocean waters.
Scientific Reports | (2021) 11:16747 | https://doi.org/10.1038/s41598-021-95825-7 11
Vol.:(0123456789)www.nature.com/scientificreports/
SSHPI can predict hazardous surge events for Japan well and perform better for surge events caused by TCs
with landfall intensity larger than 79-kt. It also has the advantage of providing an instantaneous measure of a
TC’s surge potential without heavy computational effort. Thus, it could be of utility to the general public for pre-
TC measures and post-TC analysis. SSHPI values could be utilized in countries at risk of storm surge but have
no access to advanced surge models. Furthermore, it can explain temporal variations in surge events on global,
regional, and local scales as it considers climatological variables of a TC.
It should be noted that SSHPI proposed in this study is largely dependent on the quality of the forecasted
track information. The correlation statistics for SSHPI shown in this study will improve as the u ncertainties67
associated with TC forecasted track information get smaller. The empirical equation (Eq. 5) used in this study
may not always provide an accurate prediction of peak storm surge as it does not reflect the complete surge
characteristic of a specific site. Therefore, it is advisable to develop tidal observatory/site specific prediction
equation using SSHPI data for the historical period. Furthermore, it would be interesting to determine whether
additional variables (i.e., IBE, TC approach angle, landfall location, continental slope, gust wind, wave set-up)
could or should be included in the SSHPI. Risk communication efforts in various disasters have shown that a
categorization-based severity index (i.e., potential to damage), similar in philosophy to SSHWS could provide
valuable input on public risk perception17. Ultimately, we would like to use SSHPI as SSHWS which provides pub-
lic an intuitive understanding of the surge damage. Thus, the next step of this work includes connecting SSHPI to
the losses, i.e., the actual risk, exploring effective communication methods through categorization, graphical and
verbal techniques, which requires interdisciplinary efforts and collaboration between operational agencies and
academics. Lastly, a global database of SSHPI and surge records would largely increase the usage of the SSHPI.
Received: 15 March 2021; Accepted: 31 July 2021
References
1. Nicholls, R. J. An Expert Assessment of Storm Surge “Hotspots”. (2003).
2. Knutson, T. et al. Tropical cyclones and climate change assessment part II: Projected response to anthropogenic warming. Bull.
Am. Meteorol. Soc. 101, E303–E322 (2020).
3. Neumann, B., Vafeidis, A. T., Zimmermann, J. & Nicholls, R. J. Future coastal population growth and exposure to sea-level rise
and coastal flooding - A global assessment. PLoS ONE 10, e0118571 (2015).
4. National Climate Data Center. Billion‐Dollar Weather/Climate Disasters: Table of Events, Ashville, North Carolina, Supported By
the National Oceanic and Atmospheric Administration. https://www.ncdc.noaa.gov/billions/events (2014).
5. Lagmay, A. M. F. et al. Devastating storm surges of Typhoon Haiyan. Int. J. Disaster Risk Reduct. 11, 1–12 (2015).
6. Demuth, J. L., Morss, R. E., Morrow, B. H. & Lazo, J. K. Creation and communication of hurricane risk information. Bull. Am.
Meteorol. Soc. 93, 1133–1145 (2012).
7. Islam, M. R., Takagi, H., Anh, L. T., Takahashi, A. & Bowei, K. 2017 Typhoon Lan reconnaissance field survey in coasts of Kanto
region, Japan. J. Jpn. Soc. Civil Eng Ser.B3 (Ocean Engineering) 74, 593–598 (2018).
8. Takagi, H. et al. Investigation of high wave damage caused by 2019 Typhoon Faxai in Kanto region and wave hindcast in Tokyo
Bay. J. Jpn. Soc. Civil Eng Ser.B3 (Ocean Engineering) 76, 12–21 (2020).
9. Lazo, J. K., Waldman, D. M., Morrow, B. H. & Thacher, J. A. Household evacuation decision making and the benefits of improved
hurricane forecasting: Developing a framework for assessment. Weather Forecast. 25, 207–219 (2010).
10. JMA. Japan Meteorological Agency | Forecast terms term related to typhoons. http://www.jma.go.jp/jma/kishou/know/yougo_
hp/haichi2.html (2021).
11. Bangladesh Meteorological Department. Bangladesh Meteorological Department. http://live.bmd.gov.bd/ (2021).
12. Bureau of Meteorology. Australia’s official weather forecasts & weather radar—Bureau of Meteorology. http://www.bom.gov.au/?
ref=logo (2021).
13. National Hurricane Center. The Saffir-Simpson Hurricane Wind Scale. https://www.nhc.noaa.gov/pdf/sshws.pdf (2019).
14. Powell, M. D. & Reinhold, T. A. Tropical cyclone destructive potential by integrated kinetic energy. Bull. Am. Meteorol. Soc. 88,
513–526 (2007).
15. Irish, J. L., Resio, D. T. & Ratcliff, J. J. The influence of storm size on hurricane surge. J. Phys. Oceanogr. 38, 2003–2013 (2008).
16. Needham, H. & Keim, B. D. Storm surge: Physical processes and an impact scale. Recent Hurricane Res. Clim. Dyn. Soc. Impacts.
https://doi.org/10.5772/15925 (2011).
17. Morrow, B. H., Lazo, J. K., Rhome, J. & Feyen, J. Improving storm surge risk communication: Stakeholder perspectives. Bull. Am.
Meteorol. Soc. 96, 35–48 (2015).
18. Khan, M. J. U. et al. Towards an efficient storm surge and inundation forecasting system over the Bengal delta: Chasing the super-
cyclone Amphan. Nat. Hazards Earth Syst. Sci. Discuss. https://doi.org/10.5194/nhess-2020-340 (2020).
19. Weisberg, R. H. & Zheng, L. Hurricane storm surge simulations for Tampa Bay. Estuaries Coasts J. ERF 29, 899–913 (2006).
20. Sebastian, A. et al. Characterizing hurricane storm surge behavior in Galveston Bay using the SWAN+ADCIRC model. Coast.
Eng. 88, 171–181 (2014).
21. Islam, M. R. & Takagi, H. Typhoon parameter sensitivity of storm surge in the semi-enclosed Tokyo Bay. Front. Earth Sci. 14,
553–567 (2020).
22. Jelesnianski, C. P. SPLASH (Special Program to List Amplitudes of Surges from Hurricanes): 1. Landfall Storms. (1972).
23. Rego, J. L. & Li, C. On the importance of the forward speed of hurricanes in storm surge forecasting: A numerical study. Geophys.
Res. Lett. 36, 7 (2009).
24. Peng, M., Xie, L. & Pietrafesa, L. J. A numerical study of storm surge and inundation in the Croatan–Albemarle–Pamlico Estuary
System. Estuar. Coast. Shelf Sci. 59, 121–137 (2004).
25. Islam, M. R. & Takagi, H. Statistical significance of tropical cyclone forward speed on storm surge generation: Retrospective analysis
of best track and tidal data in Japan. Georisk https://doi.org/10.1080/17499518.2020.1756345 (2020).
26. Kossin, J. P. A global slowdown of tropical-cyclone translation speed. Nature 558, 104–107 (2018).
27. Yamaguchi, M. & Maeda, S. Slowdown of typhoon translation speeds in mid-latitudes in September influenced by the pacific
decadal oscillation and global warming. J. Meteorol. Soc. Jpn. Ser. II(98), 1321–1334 (2020).
28. van Ormondt, M., van Dongeren, A. & Roelvink, D. A semi-empirical method for computing storm surges on open coasts during
tropical cyclones. Coastal Eng. 165, 103839 (2021).
29. Klotzbach, P. J. et al. Surface pressure a more skillful predictor of normalized hurricane damage than maximum sustained wind.
Bull. Am. Meteorol. Soc. 101, E830–E846 (2020).
Scientific Reports | (2021) 11:16747 | https://doi.org/10.1038/s41598-021-95825-7 12
Vol:.(1234567890)www.nature.com/scientificreports/
30. Simpson, R. H. The Hurricane disaster—Potential scale. Weatherwise 27, 169–186 (1974).
31. Saffir, H. S. Hurricane wind and storm surge. Military Eng. 65, 4–5 (1973).
32. Kantha, L. Time to replace the Saffir-Simpson hurricane scale?. EOS Trans. Am. Geophys. Union 87, 3–6 (2006).
33. Kantha, L. Comments on "Tropical cyclone destructive potential by integrated kinetic energy. Bull. Am. Meteorol. Soc. 89, 219–221
(2008).
34. Irish, J. L. & Resio, D. T. A hydrodynamics-based surge scale for hurricanes. Ocean Eng. 37, 69–81 (2010).
35. Rezapour, M. & Baldock, T. E. Classification of Hurricane hazards: The importance of rainfall. Weather Forecast. 29, 1319–1331
(2014).
36. Walker, A. M., Titley, D. W., Mann, M. E., Najjar, R. G. & Miller, S. K. A fiscally based scale for tropical cyclone storm surge. Weather
Forecast. 33, 1709–1723 (2018).
37. Chavas, D., Yonekura, E., Karamperidou, C., Cavanaugh, N. & Serafin, K. U. S. Hurricanes and economic damage: Extreme value
perspective. Nat. Hazard. Rev. 14, 237–246 (2013).
38. Kantha, L. Discussion of “a hydrodynamics-based surge scale for hurricanes”. Ocean Eng. 37, 1081–1084 (2010).
39. Hebert, C. G., Weinzapfel, R. A. & Chambers, M. A. Hurricane Severity Index: A New Way of Estimating a Tropical Cyclone’s
Destructive Potential (American Meteorological Society, 2008).
40. Takagi, H. & Wu, W. Maximum wind radius estimated by the 50 kt radius: improvement of storm surge forecasting over the western
North Pacific. Nat. Hazard. 16, 705–717 (2016).
41. Islam, M. R. & Takagi, H. On the importance of typhoon size in storm surge forecasting. in Water, Flood Management and Water
Security Under a Changing Climate 153–162 (Springer, 2020). https://doi.org/10.1007/978-3-030-47786-8_10.
42. JMA. JMA Best Track Archive. https://www.jma.go.jp/jma/jma-eng/jma-center/rsmc-hp-pub-eg/trackarchives.html (2020).
43. Mastenbroek, C., Burgers, G. & Janssen, P. A. E. M. The dynamical coupling of a wave model and a storm surge model through
the atmospheric boundary layer. J. Phys. Oceanogr. 23, 1856–1866 (1993).
44. Thomas, A. et al. Influence of storm timing and forward speed on tides and storm surge during Hurricane Matthew. Ocean Model
137, 1–19 (2019).
45. Proudman, J. Dynamical Oceanography. (Wiley, 1953).
46. Higaki, M., Hayashibara, H., Nozaki, F. & Masakazu, H.F.N.H.H. Outline of the Storm Surge Prediction Model at the Japan Mete-
orological Agency. 25. (Japan Meteorological Agency, 2009).
47. JMA. Japan Meteorological Agency|Outline NWP 2019. https://www.jma.go.jp/jma/jma-eng/jma-center/nwp/outline2019-nwp/
index.htm (2019).
48. World Meteorological Organization. Guide to Storm Surge Forecasting. (World Meteorological Organization, 2011).
49. Chan, K. T. F. Are global tropical cyclones moving slower in a warming climate?. Environ. Res. Lett. 14, 104015 (2019).
50. Moon, I. J., Kim, S. H. & Chan, J. C. L. Climate Change and Tropical Cyclone Trend. Nature Vol. 570 (Nature Publishing Group,
2019).
51. JODC. JODC. https://www.jodc.go.jp/jodcweb/JDOSS/infoJEGG.html (2020).
52. JMA. http://www.data.jma.go.jp/kaiyou/db/tide/genbo/index.php (2020).
53. JMA. Japan Meteorological Agency, Predicted Tide Stations. http://www.data.jma.go.jp/kaiyou/db/tide/suisan/index.php (2020).
54. Mandli, K. T. & Dawson, C. N. Adaptive mesh refinement for storm surge. Ocean Model 75, 36–50 (2014).
55. Marsooli, R. & Lin, N. Numerical modeling of historical storm tides and waves and their interactions along the U.S. East and Gulf
Coasts. J. Geophys. Res. Oceans 123, 3844–3874 (2018).
56. National Oceanic and Atmospheric Administration. Relationship of Maximum Sustained Winds to Minimum Sea Level Pressure in
Central North Pacific Tropical Cyclones. https://repository.librar y.noaa.gov/view/noaa/7039/ (1982).
57. Knaff, J. A. & Zehr, R. M. Reexamination of tropical cyclone wind-pressure relationships. Weather Forecast. 22, 71–88 (2007).
58. Kossin, J. P. Hurricane wind-pressure relationship and eyewall replacement cycles. Weather Forecast. 30, 177–181 (2015).
59. Jolliffe, I. T. & Stephenson, D. B. Forecast Verification: A Practitioner’s Guide in Atmospheric Science (Wiley, 2003).
60. Batstone, C. et al. A UK best-practice approach for extreme sea-level analysis along complex topographic coastlines. Ocean Eng.
71, 28–39 (2013).
61. Maskell, J., Horsburgh, K., Lewis, M. & Bates, P. Investigating river-surge interaction in idealised estuaries. J. Coastal Res. 30,
248–259 (2013).
62. Lyddon, C., Brown, J. M., Leonardi, N. & Plater, A. J. Uncertainty in estuarine extreme water level predictions due to surge-tide
interaction. PLoS ONE 13, e0206200 (2018).
63. Mori, N. et al. Local amplification of storm surge by Super Typhoon Haiyan in Leyte Gulf. Geophys. Res. Lett. 41, 5106–5113 (2014).
64. Le, T. A., Takagi, H., Heidarzadeh, M., Takata, Y. & Takahashi, A. Field surveys and numerical simulation of the 2018 Typhoon
Jebi: Impact of high waves and storm surge in semi-enclosed Osaka Bay, Japan. Pure Appl. Geophys. 176, 4139–4160 (2019).
65. Yamanaka, Y. et al. Nearshore dynamics of storm surges and waves induced by the 2018 Typhoons Jebi and Trami based on the
analysis of video footage recorded on the coasts of Wakayama, Japan. J. Mar. Sci. Eng. 7, 413 (2019).
66. Tanaka, K., Washida, M., Nishiuke, Y. & Hiraishi, T. Numerical simulation of storm surges and waves caused by Typhoon Jebi in
Osaka Bay with consideration of sudden change of wind field. J. Nat. Dis. Sci. 40, 44–68 (2020).
67. Landsea, C. W. & Franklin, J. L. Atlantic Hurricane database uncertainty and presentation of a new database format. Mon. Weather
Rev. 141, 3576–3592 (2013).
68. NHC. NHC Data Archive. https://www.nhc.noaa.gov/data/ (2021).
69. NOAA. Inundation Dashboard - NOAA Tides & Currents. https://tidesandcurrents.noaa.gov/inundationdb/# (2021).
70. Needham, H. F. & Keim, B. D. A storm surge database for the US Gulf Coast. Int. J. Climatol. 32, 2108–2123 (2012).
71. NHC. Hurricane KATRINA Advisory Archive. https://www.nhc.noaa.gov/archive/2005/KATRINA.shtml? (2021).
Acknowledgements
The first author is thankful to the Ministry of Education, Culture, Sports, Science, and Technology (MEXT) of
Japan for the provided scholarship to conduct research in the field of disaster risk reduction. This research is
funded by the Japan Society for the Promotion of Science (16KK0121 and 19K04964). Chia-Ying Lee is sup-
ported by institutional fund from Lamont Doherty Earth Observatory, Columbia University. Kyle T. Mandli is
supported by the National Science Foundation under Grant No. DMS-1720288 and OAC-1735609 and the Early
Career Faculty Innovator Program at the National Center for Atmospheric Research, a program sponsored by
the National Science Foundation. Any opinions, findings and conclusions or recommendations expressed in this
material do not necessarily reflect the views of the National Science Foundation.
Author contributions
M.R.I., C.-Y.L., K.T.M., and H.T. designed the study. M.R.I. performed the data analysis. M.R.I. wrote the main
manuscript, including the figures and tables. C.-Y.L., K.T.M., and H.T. reviewed the manuscript and M.R.I.
revised the manuscript.
Scientific Reports | (2021) 11:16747 | https://doi.org/10.1038/s41598-021-95825-7 13
Vol.:(0123456789)www.nature.com/scientificreports/
Competing interests
The authors declare no competing interests.
Additional information
Supplementary Information The online version contains supplementary material available at https://doi.org/
10.1038/s41598-021-95825-7.
Correspondence and requests for materials should be addressed to M.R.I.
Reprints and permissions information is available at www.nature.com/reprints.
Publisher’s note Springer Nature remains neutral with regard to jurisdictional claims in published maps and
institutional affiliations.
Open Access This article is licensed under a Creative Commons Attribution 4.0 International
License, which permits use, sharing, adaptation, distribution and reproduction in any medium or
format, as long as you give appropriate credit to the original author(s) and the source, provide a link to the
Creative Commons licence, and indicate if changes were made. The images or other third party material in this
article are included in the article’s Creative Commons licence, unless indicated otherwise in a credit line to the
material. If material is not included in the article’s Creative Commons licence and your intended use is not
permitted by statutory regulation or exceeds the permitted use, you will need to obtain permission directly from
the copyright holder. To view a copy of this licence, visit http://creativecommons.org/licenses/by/4.0/.
© The Author(s) 2021
Scientific Reports | (2021) 11:16747 | https://doi.org/10.1038/s41598-021-95825-7 14
Vol:.(1234567890)You can also read