A synthesis of three decades of socio-ecological change in False Bay, South Africa: setting the scene for multidisciplinary research and management
←
→
Page content transcription
If your browser does not render page correctly, please read the page content below
Pfaff, MC, et al. 2019. A synthesis of three decades of socio-ecological change
in False Bay, South Africa: setting the scene for multidisciplinary research and
management. Elem Sci Anth, 7: 32. DOI: https://doi.org/10.1525/elementa.367
REVIEW
A synthesis of three decades of socio-ecological
change in False Bay, South Africa: setting the scene for
multidisciplinary research and management
Maya C. Pfaff*,†, Renae C. Logston‡,§ , Serge J. P. N. Raemaekers‖,¶, Juliet C. Hermes§,**,††,
Laura K. Blamey‡‡,§§, Hayley C. Cawthra‖‖,¶¶, Darryl R. Colenbrander***,†††, Robert J. M.
Crawford*,†, Elizabeth Day‡‡‡, Nicole du Plessis**, Simon H. Elwen§§§,‖‖‖, Sarah E. Fawcett§,
Mark R. Jury¶¶¶,****, Natasha Karenyi†,††††, Sven E. Kerwath†,‡‡‡‡, Alison A. Kock†,§§§§,‖‖‖‖,¶¶¶¶,
Marjolaine Krug§,*****, Stephen J. Lamberth‡‡‡‡, Aaniyah Omardien†††††, Grant C.
Pitcher†,‡‡‡‡, Christo Rautenbach‡,§,‡‡‡‡‡, Tamara B. Robinson§§§§§, Mathieu Rouault‡,§,
Peter G. Ryan‖‖‖‖‖, Frank A. Shillington§, Merle Sowman‡,‖,¶¶¶¶¶, Conrad C. Sparks******,
Jane K. Turpie††††††, Lara van Niekerk††,*****, Howard N. Waldron§, Eleanor M. Yeld‡‡‡‡‡‡
and Stephen P. Kirkman*,††
Over the past three decades, marine resource management has shifted conceptually from top-down s ectoral
approaches towards the more systems-oriented multi-stakeholder frameworks of integrated coastal man-
agement and ecosystem-based conservation. However, the successful implementation of such frameworks
is commonly hindered by a lack of cross-disciplinary knowledge transfer, especially between natural and
social sciences. This review represents a holistic synthesis of three decades of change in the oceanography,
biology and human dimension of False Bay, South Africa. The productivity of marine life in this bay and its
close vicinity to the steadily growing metropolis of Cape Town have led to its socio-economic significance
throughout history. Considerable research has highlighted shifts driven by climate change, human population
growth, serial overfishing, and coastal development. Upwelling-inducing winds have increased in the region,
leading to cooling and likely to nutrient enrichment of the bay. Subsequently the distributions of key com-
ponents of the marine ecosystem have shifted eastward, including kelp, rock lobsters, seabirds, pelagic fish,
and several alien invasive species. Increasing sea level and exposure to storm surges contribute to coastal
erosion of the sandy shorelines in the bay, causing losses in coastal infrastructure and posing risk to coastal
developments. Since the 1980s, the human population of Cape Town has doubled, and with it pollution has
amplified. Overfishing has led to drastic declines in the catches of numerous commercially and recreationally
targeted fish, and illegal fishing is widespread. The tourism value of the bay contributes substantially to the
country’s economy, and whale watching, shark-cage diving and water sports have become important sources
of revenue. Compliance with fisheries and environmental regulations would benefit from a s ystems-oriented
approach whereby coastal systems are managed holistically, embracing both social and ecological goals. In
this context, we synthesize knowledge and provide recommendations for multidisciplinary research and
monitoring to achieve a better balance between developmental and environmental agendas.
Keywords: Ecosystem-based management; Integrated coastal management; Marine ecosystem; Review;
Cape Town; Coastal system; Climate change; Human dimension
* Department of Environmental Affairs (DEA), Branch Oceans ‖
Department of Environmental and Geographical Sciences,
and Coast, Cape Town, ZA University of Cape Town, Rondebosch, ZA
†
Department of Biological Sciences, University of Cape Town, ¶
ABALOBI, Rondebosch, ZA
Rondebosch, ZA
** South African Environmental Network (SAEON) E
gagasini
‡
Marine Research Institute (MaRe), University of Cape Town, Node, Cape Town, ZA
Rondebosch, ZA ††
Institute for Coastal and Marine Research, Nelson Mandela
Oceanography Department, University of Cape Town,
§
University, Port Elizabeth, ZA
Rondebosch, ZA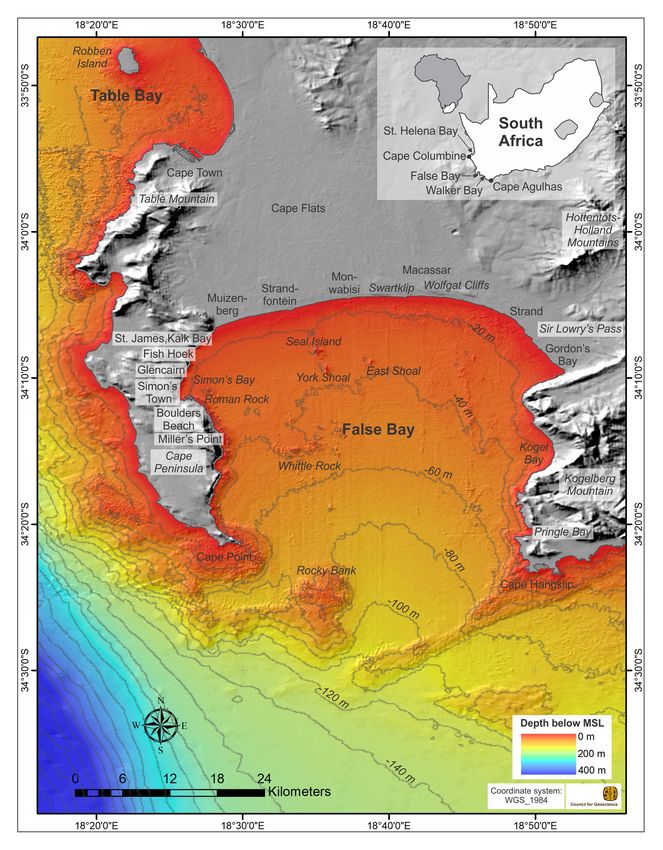
Art. 32, page 2 of 49 Pfaff et al: A synthesis of three decades of socio-ecological change in False Bay, South Africa
1. Introduction Conditions range from cold, seasonally pulsed upwelling
The past 30 years have seen a global paradigm shift in events typical of South Africa’s southwest coast (Shannon
natural resource management practices, from a sector-by- and Field, 1985; Lutjeharms and Stockton, 1991; Largier
sector approach, whereby resources are largely managed in et al., 1992) to periodic warm-water intrusions from the
isolation, towards system-oriented multistakeholder frame- Agulhas Current system off the southeast coast (Shannon
works. This shift has given rise to now widely accepted and Chapman, 1983). This range of conditions provides
concepts of ecosystem-based management and integrated for extraordinary biological diversity (Awad et al., 2002;
coastal management (ICM). In concert, research and moni- Griffiths et al., 2010). In pre-colonial times, the bay was
toring practices have shifted towards multidisciplinary already a target for intensive exploitation by the Khoisan
assessments of ecosystems, which benefit from an inte- hunter-gatherers as evident from shell middens from the
grated approach to data collection and analyses (Petitgas past 10,000 years (Goodwin and Peers, 1953). Commercial
and Santos Vásquez, 2018). Modern technologies, such as fishing commenced in the late 1600s shortly after the
automated systems and various remote sensing tools, pro- Dutch settled in the Cape (Griffiths et al., 2005). Over the
vide opportunities for greater data coverage; however, their past 100 years, over-exploitation of various fish stocks has
optimal deployment is contingent on an understanding of become increasingly apparent (Griffiths, 2000). Owing to
knowledge gaps and data requirements from multiple dis- persistent user conflict, various fishing practices have been
ciplines, including mathematical, physical, biological and prohibited within the bay, including demersal trawling (in
social sciences. A more integrated approach is of particu- 1924), boat-based purse seine and gill netting (Griffiths
lar importance when a large number of stakeholders draw et al., 2005). Meanwhile, the substantial increase of the
resources from a limited area, and sustainable solutions are human population of greater Cape Town from about 1.6
of imminent importance to the livelihoods of many people. million residents in 1980 to a projected almost 4 million
Such a case is presented here for False Bay, South Africa, a in 2018 (Statistics South Africa, 2016), along with the
large marine embayment near the metropolis of Cape Town. associated infrastructure developments, have intensified
False Bay is a southward facing bay of almost 1,000 km2, anthropogenic pressures on False Bay including pollution,
bounded by the Cape Peninsula to the west and Cape eutrophication, introductions of invasive alien species,
Hangklip to the east (Figure 1). Sailors returning from the habitat modification and over-exploitation of marine
east occasionally mistook Cape Hangklip for Cape Point living resources.
(at the southwestern tip of Africa) and navigated into the Amidst growing awareness of anthropogenic threats,
‘false bay’ instead of around the Cape Peninsula to reach the value of False Bay and its ecosystem infrastructure and
Table Bay; hence the name False Bay. Due to its proxim- services has been recognized increasingly (Turpie and de
ity to the rapidly expanding urban center of Cape Town, Wet, 2009). Large portions of the bay are currently part of
the bay has been a site of considerable socio-ecological conservation areas, which include marine protected areas
importance since before the Dutch colonization of the (MPAs) with various restricted and controlled-use zones.
Cape region in 1652. The effectiveness of MPAs under conditions of insufficient
The oceanography of False Bay is influenced by contrast- capacity to manage them remains a topic of global concern
ing circulation patterns and is highly dynamic at sub-sea- (Gill et al., 2017) and high levels of illegal fishing in False
sonal to decadal time scales (Dufois and Rouault, 2012). Bay inclusive of protected areas underscores the need to
‡‡
James Michel Blue Economy Research Institute, South African National Parks, Cape Research Centre,
§§§§
Department of Environment, University of Seychelles, Cape Town, ZA
Anse Royale, SC ‖‖‖‖
South African Institute for Aquatic Biodiversity (SAIAB),
Department of Environmental Sciences, University of
§§
Grahamstown, ZA
South Africa, Pretoria, ZA ¶¶¶¶
Institute for Communities and Wildlife in Africa, Univer-
Geophysics and Remote Sensing Unit, Council for
‖‖
sity of Cape Town, Rondebosch, ZA
Geoscience Western Cape office, ZA *****
Council of Science and Industrial Research, Rosebank/
¶¶
African Centre for Coastal Palaeoscience, Nelson Stellenbosch, ZA
Mandela University, Port Elizabeth, ZA †††††
The Beach Co-op, Cape Town, ZA
*** City of Cape Town Municipality, Cape Town, ZA ‡‡‡‡‡
Marine Research, Infrastructure and product develop-
†††
Department of Geography, Planning, and International
ment, South African Weather Service, Cape Town, ZA
Development, Programme Group Governance and Inclusive §§§§§
Botany and Zoology Department, Centre for Invasion
Development, University of Amsterdam, NL Biology, Stellenbosch University, Stellenbosch, ZA
‡‡‡
Freshwater Consulting Group, Diep River, ZA ‖‖‖‖‖
FitzPatrick Institute of African Ornithology, University
§§§
Mammal Research Institute, University of Pretoria,
of Cape Town, Rondebosch, ZA
Pretoria, ZA ¶¶¶¶¶
African Climate & Development Initiative, University of
‖‖‖
Sea Search Research & Conservation, Muizenberg, ZA Cape Town, Rondebosch, ZA
¶¶¶
University of Zululand, Richards Bay, ZA ****** Cape Peninsula University of Technology, Cape Town,
****
University of Puerto Rico Mayagüez, Mayagüez, PR ZA
††††
Statistics in Ecology, Environment and Conservation
††††††
Environmental Policy Research Unit, School of Economics,
(SEEC), Department of Statistical Sciences, University of University of Cape Town, Rondebosch, ZA
Cape Town, Rondebosch, ZA ‡‡‡‡‡‡
Save Our Seas Foundation Shark Education Centre, Kalk
‡‡‡‡
Department of Agriculture, Forestry and Fisheries,
Bay, ZA
Fisheries Management Branch, Cape Town, ZA Corresponding author: Maya C. Pfaff (maya.pfaff@gmail.com)
Pfaff et al: A synthesis of three decades of socio-ecological change in False Bay, South Africa                Art. 32, page 3 of 49

Figure 1: Bathymetry chart of False Bay and the Cape Peninsula. Names of places mentioned in the text are shown
  here. Source: Council for Geoscience, South Africa. DOI: https://doi.org/10.1525/elementa.367.f1

revisit means of effective enforcement locally. Globally             et al., 2012), extreme temperature events have become
and in South Africa, the need for a more human-cen-                  more frequent (Schlegel et al., 2017) and the sea level has
tered approach to protected area management has been                 risen (Mather et al., 2009). Ecosystem responses over the
highlighted, with emphasis on appropriate stakeholder                same period have involved increases of tropical fish and
involvement in protected area design and processes, the              decreases of temperate species on the East Coast where
generation of complementary livelihoods and the equita-              warming is taking place (Lloyd et al., 2012), eastward dis-
ble sharing of benefits between historically divided seg-            tributional shifts of a suite of mainly cold-water marine
ments of society that still persist today (Sowman et al.,            organisms including kelp, rock lobster, pelagic forage fish
2011; Conference of the Parties to the Convention on                 and seabird species, and range retractions of warm-water
Biological Diversity 10th Meeting, Decision 31). In gen-             species such as the brown mussel Perna perna (Blamey et
eral, creating a balance between historically disadvan-              al., 2015). False Bay, which is situated in the transition zone
taged and privileged societal and racial groupings remains           between cool west coast and warmer south coast condi-
the central challenge of South Africa’s political and social         tions, has been influenced by many of these changes.
system, despite considerable transformation since 1994.                 In recognition of the socio-ecological importance of
  In the past few decades, substantial climate-change                False Bay, marine scientists dedicated two symposia to
effects in the coastal and marine environments of South              this theme, in 1968 and 1989, resulting in comprehensive
Africa have become evident from measurable ecologi-                  reviews of the bay’s oceanography, biology and human
cal changes. Since the 1980s, wind-driven upwelling                  impacts (Transactions of the Royal Society of South Africa,
has increased in the South (Rouault et al., 2010; Blamey             Volumes 39: 1–2, 1970, and Jackson, 1991). Considering
Art. 32, page 4 of 49 Pfaff et al: A synthesis of three decades of socio-ecological change in False Bay, South Africa
the burgeoning effects of human population growth and the deposition of the Devonian Bokkeveld Group shales,
climate changes in False Bay, as well as the considerable and deformation that occurred at ~278–230 Ma (Newton
research that has taken place over the past three decades, et al., 2006) produced the Cape Fold Belt. With the frag-
some of it addressing priorities, gaps and opportunities mentation of Gondwana and the opening of the South
that were identified in 1989, it is appropriate to revisit Atlantic (commencing ~136 Ma), faults were reactivated
the socio-ecological status of the bay. The backdrop pro- (Paton et al., 2006) and the newly created space in basins
vided above emphasizes the need for a multidisciplinary was filled with predominantly terrestrial sediments. A
approach and knowledge-sharing between social and series of northwest-southeast oriented dolerite dykes
natural sciences if effective conservation of biodiversity intruded the rocks of the Cape Supergroup at the time of
and sustainable utilization of resources is to be achieved. the last extensional event associated with the fragmenta-
This need is the primary motivation for this synthesis, in tion of Gondwana, and these dykes have been mapped
which we summarize new findings and changes that have with marine magnetics beneath the sediments in False
occurred in the oceanography, biology and the human Bay (Day, 1986). A low-relief coastal plain now stretches
dimension of the socio-ecology of False Bay over the past from the northern margin of the bay across the Cape Flats
30 years, based on published literature and presentation to Table Bay, underlain by erodible Malmesbury Group
of new results. We further identify gaps in the understand- strata. Ancient palaeo-river valleys carved this landscape
ing of the False Bay system and recommend priorities for and have been infilled by at least 20 m of Cenozoic sedi-
the development of a concerted multidisciplinary and ment, which form part of the Sandveld Group (Rogers,
participatory research and monitoring plan. The concepts 1982). Some of these deposits consist of aeolian sedi-
and processes outlined in this paper are also applicable ments of the ‘False Bay dune plume’ which is made up of
and relevant for other locations and settings, especially basal cemented Pleistocene rocks overlain by more recent
those that require sustainable solutions for managing aeolian and marine Holocene sediments of the Witsand
wildland-urban interfaces. Formation (Roberts et al., 2009).
The Pleistocene-age shallow marine and estuarine
2. Geology and physical oceanography of Velddrift Formation is exposed at the base of the Swartklip
False Bay Rocks and is overlain by cross-bedded Langebaan For
2.1. Geological setting mation aeolianites. The calcretized upper surfaces have
The northern coast of False Bay comprises linear, transient kept them relatively resistant to erosion, reaching a maxi-
sandy beaches while the western and eastern edges are mum height of 50 m at Wolfgat Cliffs, but the encroach-
mountainous and rocky (Figure 1). The seabed geology ing sea level and coastal retreat is systematically cutting
is dominated by unconsolidated sediments with patches into these deposits during high swell events (Fourie et al.,
of Malmesbury Group shale in the eastern parts and Cape 2015). The rate of coastline retreat near Macassar Beach
Granite Suite plutons in the western parts of the bay (Fig- has been calculated by laser scanning and LiDAR to be in
ure S1). The seafloor deepens to the south at an average the order of 2.2 m yr–1 (MacHutchon, 2015). This sequence
gradient of 1:370 (Terhorst, 1987), reaching a depth of reflects the variability in repeated Quaternary sea-level
over 100 m between Cape Point and Cape Hangklip, the fluctuations, and the continuation of these deposits onto
two rocky promontories that define the margins of the the continental shelf in the form of coast-parallel trending
bay. Notable features include the rocky pinnacles and reefs is testament to the magnitude of the fluctuations
high-relief reefs that crop out at Roman Rock, Seal Island, between heights of ~10 m above present, to ~130 m below
York Shoal, East Shoal, Whittle Rock and Rocky Bank. present sea level. Since 1958, the sea level has been rising
Some of the pinnacles and ridges shoal up to 20-m depth, 0.19 cm yr–1 at Simon’s Town (Figure S2), consistent with
probably impacting oceanographic patterns by creating findings of earlier studies (Hughes and Brundrit, 1991)
turbulences and localized upwelling. The Hangklip Ridge, and model projections (Watanabe et al., 2010).
a long submarine westward extension of Cape Hangklip
(Hartnady and Rogers, 1990) plays an important role in 2.2. Atmospheric forcing: wind and weather
channeling the cold, nutrient-rich water that is upwelled Wind dynamics drive the ocean circulation and waves
by southeasterly winds during summer (Grundlingh and in False Bay, and are therefore the main driver of sea
Largier, 1991). The marine sediments in the bay gener- surface temperature (SST) patterns (Jury, 1987; 1991).
ally get finer seaward, and highly calcareous sediments Four distinct wind regimes occur year-round at varying
surround granite outcrops (Glass, 1980; Terhorst, 1987). frequencies, each of which represents a phase in the peri-
Sediment transport in the bay is dominated by bottom- odic passages of eastward-moving atmospheric Rossby
traction in the western area and lower-bottom and waves across the southern tip of Africa. The southwest
upper-bottom suspension in the east (Flemming, 1982). regime occurs at the leading edge of an anticyclone,
The oldest ‘basement’ rocks comprise the Malmesbury following the passage of a cold front. As the eastward-
Group and the Cape Granite Suite (~550–510 Ma). moving anticyclone merges with the South Atlantic anti-
Overlying deposits of the Cape Supergroup consist of cyclone (SAA), the pressure gradient is increased, and
Table Mountain Group sandstones, which dominate the strong, deep southeasterly winds are produced. With
Cape Peninsula and Cape Hangklip, and were deposited further progression of this high-pressure cell across the
along a regionally subsiding shelf from ~500 Ma (Rust southern tip of Africa, it separates from the SAA, leading
and Theron, 1964). Increased downwarping facilitated to a weakening of winds during the shallow southeaster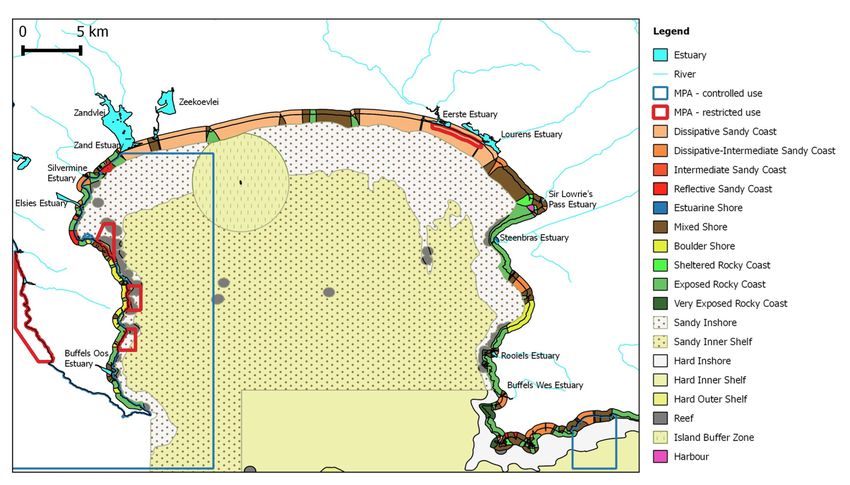
Pfaff et al: A synthesis of three decades of socio-ecological change in False Bay, South Africa              Art. 32, page 5 of 49

regime. Thereafter follows a coastally trapped low, which              Significant spatial variability in the wind field over
is associated with northwesterly winds that precede the              False Bay is generated by the interaction of the wind
next cold front. As the front passes, cool, moist westerly           with the steep and rocky mountain ranges that flank
airflow is diverted to the north and south of Table Moun-            both the eastern and western side of False Bay (Wainman
tain, converging to produce a strong northerly flow over             et al., 1987; Grundlingh and Largier, 1991). During a
False Bay.                                                           deep southeasterly regime, interactions between the
   The SAA, which is centered at about 30°S, experiences             strong, deep air flow and the orography cause the wind
seasonal shifts in longitude and latitude, causing signifi-          to accelerate northwest of Cape Hangklip, in the eastern
cant seasonal modulation in wind fields. During summer               part of False Bay. During a shallow southeasterly wind
(December to February), its southward position results               regime, winds cannot rise above the coastal mountain
in a dominant southeasterly wind regime over False                   range due to the presence of a shallow (ca. 600 m) inver-
Bay. However in winter (June to August), the SAA and                 sion layer (Jury, 1987). As a result, the southeast winds
the mid-latitude low-pressure systems migrate north,                 are deflected seawards and accelerate around Cape
effectively resulting in a more persistent and stronger              Hangklip, while a pronounced wind shadow develops
northwesterly wind regime. The seasonal changes in the               in the lee of the Kogelberg mountain (1,268 m), on the
atmospheric circulation over False Bay are well captured             eastern side of False Bay (Jury, 1991). During north-
in the dataset of the National Centers for Environmental             westerly wind regimes, the wind accelerates and flows
Prediction Climate Forecast System Reanalysis (Saha et al.,          around the high points of Table Mountain and enters
2010). A strong polarization at an angle of 138° from                False Bay in varying directions depending on loca-
the north (along a northwest/southeast axis) is evident              tion; i.e., in the north of the bay, the wind is primarily
for the winds over False Bay (Figure 2A, B); a monthly               northerly but along the western boundary it is more
climatology from the daily-averaged wind fields over the             westerly due to its curving around Cape Point (Jury,
1979–2010 period in this dataset confirms a distinct sea-            1991). Furthermore, several studies have shown that dif-
sonal cycle with annual variation in wind along the prin-            ferential heating between the land masses and the ocean
cipal axis explaining 78% of the variance (Figure 2C).               during summer can cause significant spatial and diurnal
In the summer, the southeasterly winds dominate, with                variability in False Bay (Jury et al., 1985; Wainman et al.,
very rare occurrences of northerly winds; while in win-              1987; Bonnardot et al., 2005). For example, heating of
ter, northwesterly winds prevail, with a few infrequent              the Cape Flats to >40°C draws winds into False Bay from
southeasterly winds. The southeasterly winds are strong-             the north, while southeast-facing coasts remain cooler at
est during the month of January and February with                    ca. 25°C (Tadross et al., 2012).
monthly mean speeds of 2 to 3 m s–1 and daily averages                 Observations from the Cape Point meteorological station
showing a high frequency of wind speeds in the 8–10 m                suggest that significant changes have occurred in winter
s–1 range. The strongest winds in winter generally occur             and summer winds since the 1980s (Blamey et al., 2012).
in June and are associated with northwesterly winds with             Upwelling-inducing southerly winds were reduced during
monthly averages in the 3–4 m s–1 range and peak daily               the 1980s (winter) but increased during the 1990s (winter
averages often greater than 10 m s–1 (Figure 2B). April              and summer). Winter easterly winds dominated from the
(September) is a transition month for northwesterly                  1960s to the early 1980s, after which westerly winds became
(southeasterly) winds to become more prominent and                   more dominant, while summer easterly winds showed an
southeasterlies (northwesterlies) to weaken.                         increasing trend from the early 1990s (Blamey et al., 2012).

Figure 2: Wind field of False Bay. Wind roses derived from daily averaged winds over (A) summer (January–March)
  and (B) winter (June–August) seasons based on a 30-year record (1979–2010); and (C) monthly climatology (red line)
  of wind intensity along an axis directed 138 degrees from true North and individual years (black lines). The direc-
  tion on the wind roses indicates the direction from which the wind blows with the longest spoke showing the wind
  direction with the greatest frequency. Source: dataset of the National Centers for Environmental Prediction Climate
  Forecast System Reanalysis. DOI: https://doi.org/10.1525/elementa.367.f2
Art. 32, page 6 of 49                Pfaff et al: A synthesis of three decades of socio-ecological change in False Bay, South Africa

2.3. Circulation                                                  water into the southern part of the bay (Figure 3A). As a
Direct observations of the circulation in False Bay are           result, a strong temperature gradient develops across the
limited and old. They suggest that the general surface            bay, with warmer water on the northern and eastern side
circulation inside the bay is clockwise due to the prevailing,    of the bay and cooler water on the southern and western
cyclonically sheared, southerly winds (cf. Figures 7–9 in         side. By contrast, when upwelling subsides during winter
Jury, 1991). Near the mouth of the bay surface currents           (June–August), SST tends to be homogeneous within the
tend to be westward and are modulated by passing weather,         bay (Figure 3B). SST in the northern half of False Bay var-
shelf waves, warm Agulhas rings and tides (Grundlingh             ies between 13 and 22°C during the course of the year,
and Largier, 1991; Nelson et al., 1991).                          while in the southern half the SST range is narrower, vary-
   Due to the limited continuous in situ measurements,            ing from 14 to 20°C. Variability is higher during summer
models have been used to distinguish between turbulent            than winter. Most (>70%) of the monthly variance in the
wind-driven eddies in the north of the bay and condi-             northern half of False Bay was explained by the annual
tions in the southern part of the bay, which is character-        cycle, which explained less than 50% of the variance in
ized by tidal and remotely forced circulation features (van       the southern part of the bay. The inter-annual variability
Ballegooyen, 1991). A Regional Ocean Modeling System              in False Bay, especially the southern half, is associated with
(ROMS model) was employed to investigate the effects              the variability in upwelling along the west coast from Cape
of the wind on the summer circulation in False Bay                Agulhas to Cape Columbine (Dufois and Rouault, 2012).
(Jacobson, 2014). The model results compared favorably               Interannual variability of SST is correlated with the Niño
with in situ current measurements (De Vos, 2014), show-           3.4 (El Niño/Southern Oscillation or ENSO) index, espe-
ing that southeasterly winds during summer induce off-            cially from January to May (Rouault et al., 2010). During
shore transport and upwelling at Cape Hangklip, which             El Niño years, upwelling adjacent to the bay is reduced
penetrates into False Bay, while northwesterly winds dur-         and SST is warmer everywhere in False Bay, while in La
ing winter cause onshore transport and mixing. The model          Niña years upwelling is enhanced and SST decreases, with
resolution, tides, and type of forcing data and parameteri-       anomalies reaching ± 1°C at the seasonal scale. However,
zations significantly influenced the ability to simulate          the relationship between ENSO and SST in False Bay is not
thermal structures for False Bay (Nicholson, 2012). This          linear; for instance, the strong 1983, 1998 and 2010 El
model nevertheless consistently predicted that the circu-         Niño events did not induce a strong warm anomaly dur-
lation of the bay comprises standing (mainly clockwise)           ing summer, and other SST anomalies, such as in January
rotors pulsed by currents across the mouth, although              2002, were also not linked to ENSO. At a much broader
inertial oscillations had low amplitudes. The availability        scale, El Niño induces a shift in the SAA high-pressure
of other published information regarding spatial variabil-        system and mid-latitude westerly winds in the South
ity in the circulation of False Bay is limited, highlighting a    Atlantic (Colberg et al., 2004; Rouault et al., 2010; Dufois
need for further research.                                        and Rouault, 2012), which decreases upwelling-favorable
                                                                  southeasterly winds leading to warmer SST. Additionally,
2.4. Sea surface temperature                                      decreases in wind speed reduce the cooling due to latent
Dufois and Rouault (2012) used two monthly SST prod-              and sensible heat fluxes at the sea surface, thus increas-
ucts (from satellites: moderate-resolution imaging spec-          ing the net heat flux from the atmosphere to the ocean,
troradiometer [MODIS] and Pathfinder) to study the                which augments warming of the sea surface (Colberg
annual cycle and inter-annual variability of SST in False         et al., 2004). Surface-layer heating in summer during El
Bay. They showed that during summer (January–March),              Niño promotes the vertical stratification of inshore waters
upwelling at Cape Hangklip leads to an intrusion of cold          (Dufois and Rouault, 2012; Wainman et al., 1987). The

Figure 3: Sea surface temperature in False Bay. Seasonal climatology derived for (A) summer (January–March) and
  (B) winter (June–August) using monthly maps of MODIS Aqua SST during the 2000–2010 period (based on Dufois
  and Rouault, 2012). DOI: https://doi.org/10.1525/elementa.367.f3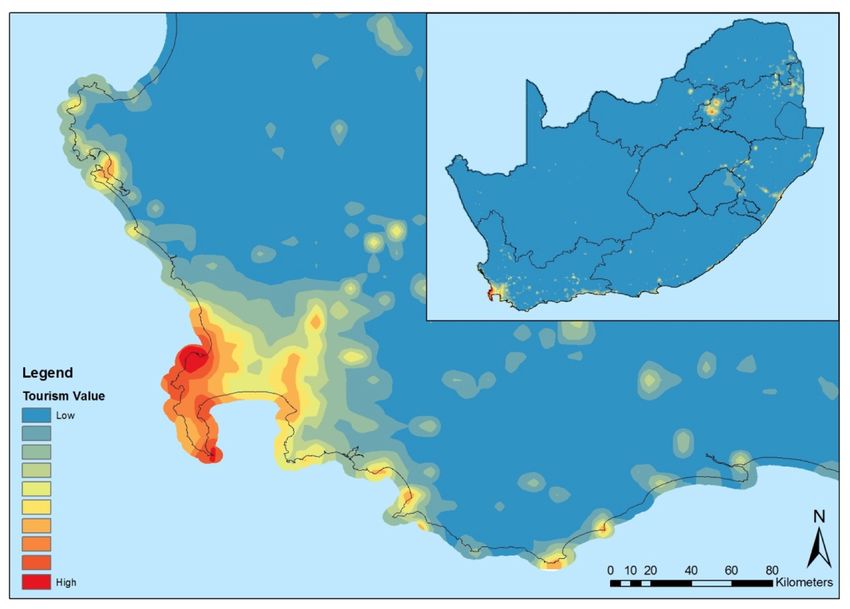
Pfaff et al: A synthesis of three decades of socio-ecological change in False Bay, South Africa               Art. 32, page 7 of 49

stratified layer allows solar heat retention at the surface,         ern and eastern peripheries, where the slopes are steeper,
which promotes phytoplankton growth in the northern                  can experience strong rip currents and may be dangerous
part of the bay (Section 3.3). Upwelling-favorable south-            for swimmers. Storms passing south of the Cape create
easterly winds, which predominate during summer, per-                southerly swells with long fetches and durations, giving
petuate phytoplankton blooms through nutrient input to               rise to the highest waves and storm surges that penetrate
the photic surface layer (Grindley and Taylor, 1970; Largier         deep into the bay. These can result in shoreline structural
et al., 1992). More detail about this process is given in            damage such as that seen at the seafront of Kalk Bay
Section 3. The reverse processes lead to cooler sea surface          (Section 5.4.3). As the bay is semi-enclosed and shallow,
temperatures and reduced stratification in La Niña years,            an increase in the southerly and easterly components of
which affect primary production negatively.                          the offshore winds outside of False Bay (as reported in
  Since the early 1980s, upwelling along the southwest               Section 2.2) will likely correspond to increased swell and
coast of South Africa has experienced significant shifts             storm surge height. However, limited data sources result
that fundamentally affect the ecology of False Bay (Blamey           in contradictory predictions of various (unpublished)
et al., 2012; Section 4.1.3). With increasing southerly winds        models. Further studies are needed to more accurately
during summer (Section 2.2), the intensity and variability           predict changes in the Southern Ocean weather systems
of upwelling increased significantly between the early and           and associated changes in wave parameters and approach
mid 1990s, but showed moderate declines in the 2000s.                for areas such as False Bay.
Reasons for this decline are unknown, but likely linked to
shifts in wind (Blamey et al., 2012) and the position of the         3. Biogeochemical oceanography of False Bay
SAA (Jarre et al., 2015) in the mid-to-late 2000s.                   3.1. Nutrients
                                                                     3.1.1. Offshore nutrient distributions
2.5. Swell and waves                                                 There are relatively few data on macronutrient concen-
The general prevailing swell direction around the Cape               trations for the offshore waters of False Bay, despite the
Peninsula is from the southwest (Figure 4A) and char-                importance of such baseline information for evaluating
acterized by long period swells (12–15 sec) with an aver-            changes to the nearshore environment driven by anthro-
age wave height of ca. 3 m (Figure 4B). Swell from this              pogenic activities (Section 3.1.2). To date, only one study
direction collides with the eastern shore of False Bay               has evaluated the large-scale patterns of dissolved nutri-
(Kogel Bay) and refracts into the bay resulting in lower             ents within the bay (Taljaard, 1991). The study considered
wave heights in the west than in the east (Figure 4C). So-           two wind regimes, with sampling taking place firstly after
called “freak” or “rogue” waves occur on the eastern coast;          a week of light southerly winds, and then following an
these are due to wave focusing by Rocky Bank, a reef at              intense southeasterly wind. For both wind regimes, the
the entrance of the bay that rises from a depth of 80 m              trends in the surface concentrations of nitrate (NO3–)
to 20 m (Shipley, 1964). Much of the rest of False Bay is            (Figure 5A, B), with lower nutrient concentrations inshore
sheltered from the prevailing swell direction and wind               than offshore and the lowest concentrations in the north-
waves, hence significant wave heights seldom reach 5                 east corner of the bay, which includes Gordon’s Bay. Data
m and periods are usually in the 10–12 sec range. Wave               for phosphate (PO43–) and silicate (Si) are not shown, but
breaking generally occurs as “spilling breakers” along the           their trends were similar. In the summer, the False Bay
northern coastline (Muizenberg to Macassar), due to a                water column becomes vertically stratified (Atkins, 1970;
gentle bottom slope (ratio of 1:50 to 1:100). In summer,             Gründlingh et al., 1989; Figure 5C, D) and SSTs tend to be
strong fetch-limited local winds blow from the southeast             higher in the east than the west (Section 2.4). A greater
and generate choppy waves of short period (ca. 6 sec) and            degree of nutrient consumption by inshore phytoplank-
moderate wave height (ca. 2 m). These conditions lead to             ton is expected under these conditions of water column
many rows of spilling waves along the beaches that char-             stabilization and high light availability. In addition, off-
acterize the shallow-sloping northern shoreline. Its west-           shore False Bay waters are mixed more regularly with the

Figure 4: Swell in False Bay. (A) Swell height-frequency rose based on the Wavewatch3 model (Johnson et al., 2012)
  near Cape Point; (B) annual cycle of swell height and standard deviation (red line; Theron et al., 2014); (C) wave
  energy isolines in kW m–1 (from Joubert and van Niekerk, 2013). DOI: https://doi.org/10.1525/elementa.367.f4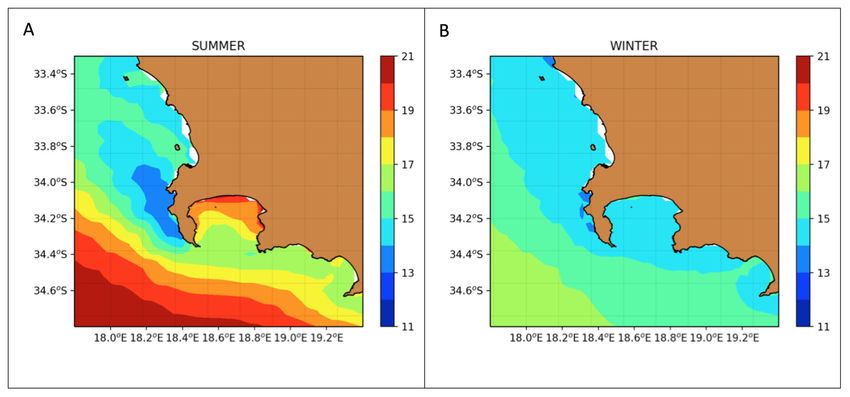
Art. 32, page 8 of 49 Pfaff et al: A synthesis of three decades of socio-ecological change in False Bay, South Africa
18°30’ 18°40’ 18°50’ 19°0’ 18°30’ 18°40’ 18°50’ 19°0’
Cape Flats Aquifer
A Monwabisi Macassar
B Cape Flats Aquifer
[14] [16] [18] Monwabisi Macassar
Zeekoevlei Zeekoevlei
Eerste River Legend: [9] [15] [17] [20] [22]
Zeekoevlei canal [19] [21]
Muizenberg Lourens River River input Muizenberg [7] [8] [11] [12]
[13] [23] [24]
Sandvlei [6] [10]
Silvermine
Strand Wastewater [5]
River Strand
treatment [25]
Elsies Rivier Seal Island Seal Island
Sir Lowry’s Pass River works [4] [26]
34°10’ Gordon’s Bay
Groundwater
Gordon’s Bay 34°10’
Simon’s Bay [3] Simon’s Bay
(berm) input
Baviaanskloof [2]
River Storm water
inflow [1]
Kogel Bay Behind surf Kogel Bay
zone
25 24 23 22 21 25 24 23 22 21
30
34°20’ Pringle Bay 28 Pringle Bay 34°20’
Cape Point Cape Point
26
Cape Hangklip Cape Hangklip
24
22
20
Survey I: light southerly winds Survey II : strong southeasterly winds
[NO3- + NO2-] (µM)
18
34°30’ 34°30’
16
25 24 23 22 21 25 24 23 22 21
0 14 0
C 12
D
10 10 10
Depth (m)
Depth (m)
8
20 20
6
4
30 30
2
0
40 C D 40
18°30’ 18°36’ 18°42’ 18°48’ 18°30’ 18°36’ 18°42’ 18°48’
Figure 5: Nutrient (nitrogen) distributions and inputs into False Bay. Offshore NO3– + NO2– concentrations (μM)
in False Bay surface waters following A) sustained light southerly winds and B) strong southeasterly winds. C) and
D) show a depth section along the transect indicated in A and B by the open red symbols (stations 21–25). Offshore
[NO3– + NO2–] data were collected in April 1989 and are described in Taljaard (1991); no NH4+ concentration data are
available. Terrestrial inputs to False Bay for which data for dissolved inorganic nitrogen (DIN) concentrations are avail-
able (where [DIN] = [NO3– + NO2– + NH4+]) are indicated by the colored symbols in panel A. Behind-surf zone samples
collected < 1 km from the shore are also shown (grey symbols). The range of available DIN concentrations reported
for the various inputs to False Bay are listed in Table 1 and refer to samples collected most closely to the interface with
the bay, except in the case of groundwater (magenta symbols), which includes measurements from berm wells. The
storm water inflow locations indicated in panels A and B (green symbols) typically include multiple outflows. DOI:
https://doi.org/10.1525/elementa.367.f5
open ocean, thereby entraining higher nutrient concen- derive either from weak in situ upwelling driven by v ortex
trations to the south of the bay. Gordon’s Bay is located in formation associated with the wind-driven clockwise circu-
a wind shadow created by the Hottentots-Holland Moun- lation (Atkins, 1970; Cram, 1970; Taljaard, 1991) or from
tains to the east of False Bay (Grundlingh and Largier, stronger upwelling induced directly by high southeasterly
1991), and is characterized by a semi-permanent anticy- winds. In addition, upwelling off Cape Hangklip, which is
clonic eddy creating an anticlockwise gyre circulation driven by strong southeasterly winds, represents a poten-
that is often in the opposite direction to the larger bay tial source of nutrients to False Bay. However, the rela-
cyclonic circulation (Atkins, 1970; Taljaard et al., 2000). In tive importance of upwelling outside versus within False
summer, such circulation likely drives convergence, imply- Bay for supplying surface waters with nutrients remains
ing reduced mixing and a longer residence time for waters unknown, as does the within-bay nutrient distribution in
in the Gordon’s Bay area, potentially allowing more time winter when the dominant wind direction is northwest
for nutrient uptake by phytoplankton. However, strong (Atkins, 1970; Taljaard et al., 2000), vertical stratification
southeasterly winds have also been hypothesized to drive is minimal (Gründlingh et al., 1989) and SST is relatively
upwelling in the vicinity of Strand-Gordon’s Bay (Grindley homogeneous (Dufois and Rouault, 2012; Figure 3).
and Taylor, 1970; Jury et al., 1985), which would presum- Taljaard (1991) also recorded elevated surface NO3– and
ably recharge the nutrients in surface waters. Feedbacks PO43– concentrations around Seal Island on one sampling
between the region’s complex physical conditions and occasion, likely due to nutrient-enriched runoff deriving
biogeochemistry remain to be confirmed. from the large seal population inhabiting the island (i.e.,
Taljaard (1991) recorded elevated surface nutrient con- the ‘island effect’). This input appears to be dissipated rap-
centrations in the center of False Bay following sustained idly by mixing with the surrounding waters, as evidenced
southerly winds, and also to the east near the mouth by the lack of a nutrient concentration gradient near Seal
during a southeasterly wind. These concentrations were Island during a second survey only days later. The signifi-
attributed to the intrusion and upwelling of a plume of cance of island inputs for productivity and biogeochemical
nutrient-rich bottom water from the southeast, most cycling in False Bay has yet to be explored.
likely South Atlantic Central Water originating on the
Agulhas Bank (Shannon and Chapman, 1983; Chapman 3.1.2. Nearshore nutrient distributions and terrestrial inputs
and Largier, 1989; Taljaard, 1991). Regular summertime Since the 1980s, considerable attention has been focused
observations of cold (presumably nutrient-rich) surface on the biogeochemistry of discharges into False Bay; e.g.,
water in the center of False Bay have been hypothesized to via rivers, groundwater and waste-water treatment works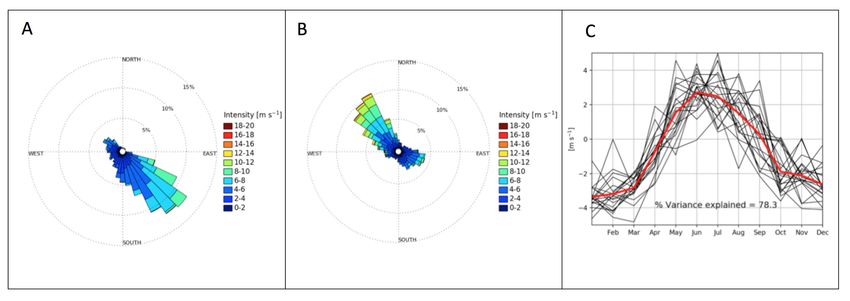
Pfaff et al: A synthesis of three decades of socio-ecological change in False Bay, South Africa Art. 32, page 9 of 49
(WWTW), with fertilizers, treated effluent, broken sewer removed more rapidly from the water column than PO43–
pipes, leaking water mains, polluted stormwater and (Taljaard, 1991), most likely by the surf diatom Anaulus
natural organic matter all constituting potential nutri- australis (Campbell and Bate, 1996), which forms dense
ent sources to the bay (Brown et al., 1991; Parsons, 2000; concentrations on the northern edge of the bay. Terrestrial
Taljaard et al., 2000). Indeed, eleven rivers drain into False nutrient inputs to False Bay that have a lower nitrogen-to-
Bay, and all have been modified by humans (Taljaard et phosphorus ratio than is typical for ocean waters may also
al., 2000). A previous estimate indicated that by 2020, the play a role. Muizenberg Beach experiences higher ground-
effluent of nearly 2 million people will enter False Bay, water-derived nutrient inflow than any other beach along
with as much as two thirds entering through storm water the South African coast due to its proximity to the Cape
drains and rivers (Brown et al., 1991). Flats aquifer (Figure 5B; Table 1) which is heavily polluted
Average background nutrient concentrations in the surf from septic tanks and stormwater runoff (Engelbrecht
zone of False Bay as measured between 1987 and 1989 and Tredoux, 1989), while natural processes may also con-
(Taljaard, 1991) were significantly lower (in the case of tribute (Raghunath, 1982). These nutrients are thought
NO3– and Si) or similar (in the case of PO43–) to concen- to support the high levels of A. australis observed in the
trations measured at offshore upwelling fronts (Figure 5; adjacent False Bay surf zone (Section 3.4), the sustained
Table 1). A possible explanation is that NO3– and Si are growth of which may actually protect offshore waters
Table 1: Available data on the dissolved inorganic nitrogen (DIN) inputs to False Bay. DOI: https://doi.org/10.1525/
elementa.367.t1
Number Location [DIN] = [NO3– + References
on mapa NO2– + NH4+] (μM)
[1] Miller’s Point WWTWb 514–2157 Taljaard et al., 2000
[2] Baviaanskloof River 30–54 Webb, 2001
[3] Simon’s Town WWTW 2,570 Taljaard et al., 2000
[4] Elsies River 26 Taljaard et al., 2000
[5] Silvermine River 24 Taljaard et al., 2000
[6] Sandvlei 33 Taljaard et al., 2000
[7] Muizenberg Beach – groundwater input 0–510 Campbell and Bate, 1996
[8] Zeekoevlei Canal 7–386 Taljaard, 1991; Giljam, 2002; Mtuleni, 2014
[9] Cape Flats WWTW 579 Taljaard et al., 2000
[10] Surf zone near Zeekoevlei outlet 3.7–74 Taljaard, 1991; Giljam, 2002
[11] Groundwater input 5.5–735 Giljam, 2002
[12] Groundwater input 7.4–287 Giljam, 2002
[13] Surf zone near Mitchells Plain WWTW outlet 5.9–12.8 Giljam, 2002
[14] Mitchells Plain WWTW 971 Taljaard et al., 2000
[15] Storm water inflow 585 Taljaard et al., 2000
[16] Groundwater input 1,593–10,000 Taljaard et al., 2000; Giljam, 2002; Parsons, 2000
[17] Storm water inflow 2,286 Taljaard et al., 2000
[18] Groundwater input 8.2–70 Giljam, 2002
[19] Surf zone near Monwabisi outlet 9–12 Giljam, 2002
[20] Storm water inflow 300 Taljaard et al., 2000
[21] Macassar Beach – groundwater input 5–95 Campbell and Bate, 1996
[22] Macassar WWTW 1.050 Taljaard et al., 2000
[23] Eerste River 253–3,158 Taljaard et al., 2000; Mtuleni, 2014
[24] Lourens River 18–86 Taljaard et al., 2000; Mtuleni, 2014
[25] Gordons Bay WWTW 26 Taljaard et al., 2000
[26] Sir Lowry’s Pass River 21–44 Taljaard et al., 2000
a
See Figure 5B.
b
Waste-water treatment works.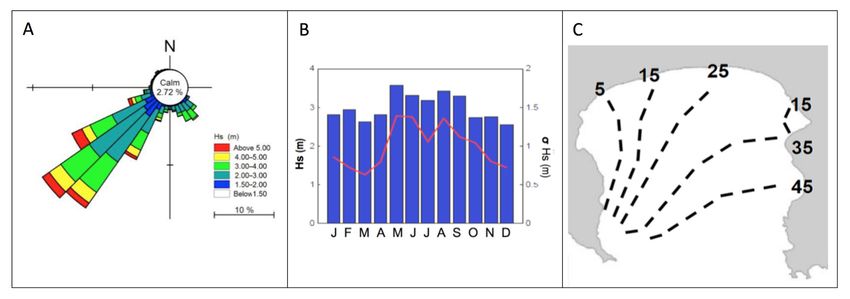
Art. 32, page 10 of 49               Pfaff et al: A synthesis of three decades of socio-ecological change in False Bay, South Africa

from less desirable phytoplankton blooms driven by                3.2. Water quality and pollution
eutrophication (Campbell and Bate, 1996).                         Quick (1993) identified bacterial contamination and nutri-
   Concentrations of NO3– and PO43– up to two orders              ent loading as the main threats to the water quality of sur-
of magnitude higher than in offshore False Bay and                face water discharges into False Bay. In 2011, Day and Clark
ammonium (NH4+) concentrations on the order of                    (2012) found that approximately 30% of the City of Cape
10 mM have been measured in groundwater seepage                   Town’s 49 coastal sampling points in the bay did not com-
from the Cape Flats aquifer (Zeekoei River to Kuilsriver;         ply with intestinal Enterococci-based human health criteria
Figure 5B; Table 1) (Parsons, 2000; Giljam, 2002).                for intermediate-contact recreation. These authors identi-
Discharge from the aquifer has been reported to persist           fied the highest levels of contamination along the northern
at distances of 400 to 2,000 m from the shore (Skibbe,            shoreline between Muizenberg and Strand, with localized
1991; Taljaard, 1991; Ollis, 1997; Giljam, 2002), albeit          contamination hot spots, such as Kalk Bay Harbor. The main
with significantly diluted nutrient concentrations com-           sources of contamination comprised leaking sewers and
pared to the source. Webb (2001) showed that high                 contaminated stormwater, often from poorly serviced areas.
nutrient loads upstream in the Baviaanskoof River, and               Metal concentrations in False Bay are influenced by the
especially during winter months when flow rates were              meteorology of the area, coastal topography, geomorphol-
higher, typically returned to background (i.e., oceanic)          ogy, and hydrodynamics. These environmental factors also
levels at the river-bay interface due to dilution with            influence the extent of metal contamination caused by
ocean waters, aided by nutrient removal by riverine               anthropogenic activities. Taljaard (2000) provided a com-
plant growth (Figure 5B; Table 1).                                prehensive overview of historical and existing activities,
   When considering False Bay as a whole, the nutri-              but little monitoring of heavy metals was taking place
ent concentrations supplied to surface waters by                  at the time. Mdzeke (2004) undertook the first survey of
upwelling appear to be much higher than those derived             metals in False Bay and investigated their effects on the
from terrestrial sources (Taljaard, 1991; Giljam, 2002).          marine ecosystem by conducting biomarker research.
However, land-based pollutants can persist over consid-           Metal concentrations in water and sediment were highest
erable temporal and spatial scales, potentially negatively        along the northern shore between Muizenberg and Strand,
impacting coastal ecosystems and recreational activities.         where the most populous and industrialized catchment
Moreover, while exchange with offshore waters appears             areas are located. Contamination showed significant spa-
to be the limiting factor in ensuring good surf zone and          tial variation, suggesting localized inputs with seasonal
nearshore water quality, the roles of microbial processes         variability associated with precipitation and runoff. Metal
in transforming and ameliorating terrestrial nutrient             concentrations sampled from biota in False Bay showed
inputs (e.g., assimilation, denitrification, nitrification)       that cadmium, copper, nickel, lead and zinc accumulate
have yet to be investigated. Finally, a pressing question         in invertebrates at concentrations that differed both
is how the relative contribution of anthropogenic ver-            spatially and seasonally. The high invertebrate cadmium
sus natural sources to the False Bay nutrient load may            concentrations were thought to derive from phosphate
be changing, given the rapidly growing population and             fertilizers that are widely used in catchment areas drain-
changing wind field in this region.                               ing the northern shoreline of the bay. Biomarker research
                                                                  using the Neutral Red retention assay indicated that inver-
3.1.3. Atmospheric nutrient deposition                            tebrates in the northeastern part of the bay (Strand) were
Another potential source of nutrients that could influence        stressed by the high contamination levels (Mdzeke, 2004).
both offshore and inshore False Bay waters but that has              More recent research has confirmed that concentra-
received little attention is atmospheric deposition of            tions of metals such as cadmium, lead, and manganese
nitrogen derived from anthropogenic activities such as            in Western Cape marine ecosystems have increased since
agriculture, industry, and biomass burning (Galloway et           1985 and are influenced by localized sources (Sparks et al.,
al., 2003). As an example, atmospheric deposition has             2014). There is also evidence of bioaccumulation of met-
been estimated to account for 25–40% of the anthropo-             als such as arsenic, molybdenum, cadmium, copper and
genic nitrogen load entering Chesapeake Bay (Fisher and           zinc in mussels (M. galloprovincialis) in False Bay (Sparks
Oppenheimer, 1991; Sheeder et al., 2002). In Cape Town,           and Mullins, 2017). Further research needs to focus on
nitrogen oxides associated with high wintertime pollu-            determining the source of contaminants to False Bay
tion events have been traced to industrial activities in the      because they pose a potential health risk to the coastal
Mpumalanga Highveld, with transport occurring along the           marine ecosystem.
south coast of the country (Abiodun et al., 2014). Atmos-
pheric deposition could thus be a source of both local and        3.3. Chlorophyll a and primary production
remote anthropogenic nitrogen to False Bay, with impli-           Ocean color data from MODIS (4-km resolution) indi-
cations for primary productivity and CO2 drawdown, N2O            cate that summertime chlorophyll a concentrations in
emissions, seawater pH, and ecosystem and human health            False Bay, which range from 2 to >10 mg m–3, are high-
(Galloway et al., 2003; Duce et al., 2008; Abiodun et al.,        est in the northeastern and northwestern corners of
2014; Altieri et al., 2016). To our knowledge, while there        the bay (Figure 6). Winter, or periods of decreasing SST
have been studies of air pollution in the region (e.g., Ritter    coupled with offshore advecting winds (from the north)
and Olivier, 1991), no attempt has been made to measure           and lower light availability, are associated with phyto-
atmospheric nutrient deposition to False Bay.                     plankton bloom decay for most species in False Bay, an
Pfaff et al: A synthesis of three decades of socio-ecological change in False Bay, South Africa Art. 32, page 11 of 49 Figure 6: Summertime ocean color data from MODIS at 4-km resolution. The bay shows substantially higher primary production than the immediate surrounding waters, as indicated by chlorophyll a concentration (color bar). DOI: https://doi.org/10.1525/elementa.367.f6 exception being Gephyracapsa oceanica (Grindley et al., et al., 1991). The high concentrations were likely due to 1964; Grindley and Taylor, 1970). Based on a survey of the shallow and enclosed nature of the study site, com- the entire south and west coast upwelling area, Brown et bined with possible land-derived nutrient loading (Section al., (1991) reported an annual mean chlorophyll concen- 3.1.2). The large range of net primary prodution values tration of 4 mg m–3 for the upper 30 m of the water col- (6–35 mg C m–3 h–1) recorded by Weitz (2000) emphasizes umn in the False Bay area (which included waters to the the spatial and temporal heterogeneity of the area, and south and east of Cape Hangklip). Duncan (2000) meas- underscores the need to evaluate environmental measure- ured mean chlorophyll concentrations of 5.5 mg m–3 for ments in the context of physical and biogeochemical data. Simon’s Bay, and identified no clear relationship between In summary, due to the limited availability of in situ upwelling and chlorophyll concentrations. By contrast, chlorophyll a and primary productivity data, much Giljam (2002) observed higher chlorophyll concentrations remains unknown regarding phytoplankton biomass pro- in Simon’s Bay during summer upwelling (5.5 ± 3.0 mg duction in False Bay, including the extent of its spatial m–3) than during wintertime periods of quiescence (2.1 and interannual variability. This knowledge gap exists ± 3.0 mg m–3). More recently, continuous measurements despite the importance of phytoplankton production as from a moored fluorometer off Miller’s Point showed an indicator of ecosystem health and implications for fish clear seasonality in chlorophyll concentration (Arendse productivity and marine biodiversity. et al., 2018), with maxima recorded in summer and early autumn (December–March; maximum of 14.1 mg m–3), 3.4. Algal Blooms declining to much lower values in late autumn, winter As for many other embayments of eastern boundary and spring (April–November; minimum of 2.9 mg m–3). upwelling systems, False Bay is subject to a high incidence Weitz (2000) measured the evolution of dissolved oxygen of harmful algal blooms (HABs) caused primarily by throughout the water column at four sites in Simon’s Bay dinoflagellate species that either produce toxins or form during a two-week period in winter and computed an dense accumulations known as red tides (Pitcher et al., average rate of net primary production (total primary pro- 2010). Also, as is common with other bays, the develop- duction minus community respiration) of 11 mgC m–3 h–1. ment of dinoflagellate blooms in False Bay is favored This value is high compared to annual estimates from the by the hydrographic conditions of increased retention Walker Bay region to the east of False Bay (~5 mgC m–3 h–1) and stratification. Indeed, strong seasonal stratification and in the range of estimates from west of Cape Point (~10 patterns provide an environment most conducive to HAB mg C m–3 h–1) and near Cape Columbine/St. Helena Bay development during late summer and autumn (Horstman (3.4–16 mgC m–3 h–1) (Shannon and Field, 1985; Brown et al., 1991; Pitcher and Calder, 2000).
Art. 32, page 12 of 49              Pfaff et al: A synthesis of three decades of socio-ecological change in False Bay, South Africa

   In False Bay, red tides are considered local expressions      The causative dinoflagellate was initially identified as a
of widespread dinoflagellate populations, with the bay           Gymnodinium species but later described as a new spe-
serving as a site of bloom incubation and accumulation           cies, Karenia cristata (Botes et al., 2003). Blooms of this
(Pitcher et al., 2008). Under conditions of upwelling,           dinoflagellate were again prevalent in 1995–1996 when
blooms are introduced into the bay by cyclonic circulation.      they occurred during the peak of the summer holiday
During late summer, bloom development is advanced in             season, causing beachgoers and seaside residents severe
a clockwise direction under increasingly stratified con-         coughing, burning of the nasal passages, breathing dif-
ditions (Horstman et al., 1991). Blooms may become               ficulties, stinging eyes, and irritation to the skin (Pitcher
entrapped in Gordon’s Bay where they are retained in             and Matthews, 1996). The noxious gases associated with
a semi-permanent anticyclonic eddy (Section 3.1.1),              the bloom were initially reported from the Fish Hoek,
rendering this area more vulnerable to HABs and their            St James, and Muizenberg areas, but later the effects
negative impacts (Grindley et al., 1964; Pitcher et al.,         were also reported on the eastern side of the bay before
2008). Reversal of upwelling-favorable winds, particularly       spreading to Walker Bay and impacting the coastal resort
towards the end of the upwelling season, tends to force a        of Hermanus.
reversal of surface currents in False Bay, favoring leakage         Initiation of routine sampling of the plankton in
and export of blooms from the bay and their entrainment          Gordon’s Bay in 1992 demonstrated a further threat to
into the Benguela jet current off the Cape Peninsula             human health by identifying Dinophysis acuminata as a
(Pitcher et al., 2008).                                          regular component of the plankton community of False
   Reports by Gilchrist (1914) of summer blooms of               Bay (Trainer et al., 2010). D. acuminata is recognized as
Noctiluca provide the earliest accounts of red tides in          the most common cause of diarrhetic shellfish poisoning
False Bay, while Horstman et al. (1991) later identified N.      on the South African coast, primarily through production
scintillans as the dinoflagellate most often responsible         of the toxin okadaic acid (Pitcher et al., 2011). A fifteen-
for red tides in the bay. Other non-toxic dinoflagellates        year time series off Gordon’s Bay shows a clear peak in
now known to form blooms in the bay include Gonyaulax            D. acuminata concentration during autumn (Trainer et al.,
polygramma, Prorocentrum rostratum, P. triestinum                2010; Figure 7A). Despite marked interannual variability
and Scripsiella trochoidea (Pitcher and Calder, 2000).           (Figure 7B), D. acuminata is present in sufficiently high
Occasional discoloration of False Bay waters is also caused      concentrations during most years to render shellfish in
by the photosynthetic ciliate Mesodinium rubrum and the          this part of False Bay unsafe for human consumption.
coccolithophorid Gephyracapsa oceanica (Grindley and                Two types of discoloration of coastal waters along the
Taylor, 1970). However, apart from their visual impact,          northern shore of False Bay commonly draw the attention
these blooms are seldom harmful.                                 of the concerned public, but are fundamentally harm-
   Grindley (1964) provided the first account of a mortality     less: a brown discoloration of surf zone waters related
of marine life in False Bay linked to the presence of a red      to blooms of the diatom A. australis (Section 3.1.2) and
tide. In March and April 1962, a bloom of G. polygramma          a very sharp front between milky white-green water and
accumulated near Gordon’s Bay, reaching concentrations           darker green-blue water. The first reports of A. australis
of approximately 107 cells L–1. At this time, an estimated       in False Bay were made by Grindley (1970). These diatoms
100 tons of dead and dying fish and invertebrates washed         form brown patches in the surf on a semi-permanent basis
up on the beaches between Gordon’s Bay and Strand,               and are generally confined to the surf-zone with few cells
apparently due to the depletion of dissolved oxygen by           occurring behind the breaker line. Suitable conditions for
decaying plankton. In 2007, a bloom of G. polygramma             their growth are thought to include long sandy beaches
was again responsible for the extreme discoloration of           of moderate to high energy, rip current activity and an
large areas of False Bay (Pitcher et al., 2008). This bloom      associated dune system providing nutrients by ground-
persisted for two months, and at night the bay was bril-         water flow (Campbell and Bate, 1996). Indeed, surf zone
liantly luminescent. By late February and early March, cell      blooms in False Bay are thought to attain particularly high
concentrations of 2 × 10⁷ cells L–1 were recorded in the         cell concentrations in response to local nutrient inputs
region of Gordon’s Bay, where minor mortalities of marine        (Section 3.1.2). These blooms are particularly pertinent in
organisms were again thought to be a consequence of              the Muizenberg area where high concentrations of nutri-
oxygen depletion following bloom decay.                          ents are supplied through river outfalls (which contain
   Brown (1979) reported a fish mortality in the Strand          waste water from the adjacent sewage purification sys-
and Gordon’s Bay areas in 1976 in response to a dark             tem) and submarine groundwater discharge (Campbell
brown discoloration of the sea attributed to a bloom of          and Bate, 1996). The cause of the milky white-green water
an unidentified Gymnodinium species. On this occasion,           is less well understood despite two studies that have
clogging of the gills was assumed to be the likely cause         sampled across the frontal feature (Shannon et al., 1991;
of the mortality because some fish appeared to be coated         Waldron et al., 2008). The earlier study found that plank-
with the dinoflagellate. The first mortalities of marine life    ton community composition was identical on either side
in False Bay associated with a toxin-producing dinoflagel-       of the front, but densities of phytoplankton, zooplankton
late were observed in 1988 and 1989, with the latter event       and particulate matter were higher in the milky waters.
including the mortality of an estimated 40 tons of aba-          The latter study reported that the milky water was warmer,
lone (Horstman et al., 1991). These blooms caused an olive       less saline, and more turbid, with higher nitrate, silicate
green discoloration of the sea and were associated with          and chlorophyll a concentrations, and was rich in calcium.
the production of an aerosol toxin that affects humans.          Pollution from land-based sources was not identified as a
You can also read