Accuracy Assessment of UAV-Photogrammetric-Derived Products Using PPK and GCPs in Challenging Terrains: In Search of Optimized Rockfall Mapping - MDPI
←
→
Page content transcription
If your browser does not render page correctly, please read the page content below
remote sensing
Article
Accuracy Assessment of UAV-Photogrammetric-Derived
Products Using PPK and GCPs in Challenging Terrains: In
Search of Optimized Rockfall Mapping
Barbara Žabota             and Milan Kobal *

                                          Department of Forestry and Forest Renewable Resources, Biotechnical Faculty, University of Ljubljana,
                                          Večna pot 83, 1000 Ljubljana, Slovenia; barbara.zabota@bf.uni-lj.si
                                          * Correspondence: milan.kobal@bf.uni-lj.si

                                          Abstract: Unmanned aerial photogrammetric surveys are increasingly being used for mapping
                                          and studying natural hazards, such as rockfalls. Surveys using unmanned aerial vehicles (UAVs)
                                          can be performed in remote, hardly accessible, and dangerous areas, while the photogrammetric-
                                          derived products, with high spatial and temporal accuracy, can provide us with detailed information
                                          about phenomena under consideration. However, as photogrammetry commonly uses indirect
                                          georeferencing through bundle block adjustment (BBA) with ground control points (GCPs), data
                                          acquisition in the field is not only time-consuming and labor-intensive, but also extremely dangerous.
                                          Therefore, the main goal of this study was to investigate how accurate photogrammetric products
                                can be produced by using BBA without GCPs and auxiliary data, namely using the coordinates X0 ,

                                          Y0 and Z0 of the camera perspective centers computed with PPK (Post-Processing Kinematic). To this
Citation: Žabota, B.; Kobal, M.           end, orthomosaics and digital surface models (DSMs) were produced for three rockfall sites by using
Accuracy Assessment of
                                          images acquired with a DJI Phantom 4 RTK and the two different BBA methods mentioned above
UAV-Photogrammetric-Derived
                                          (hereafter referred to as BBA_traditional and BBA_PPK). The accuracy of the products, in terms of
Products Using PPK and GCPs in
                                          the Root Mean Square Error (RMSE), was computed by using verification points (VPs). The accuracy
Challenging Terrains: In Search of
                                          of both BBA methods was also assessed. To test the differences between the georeferencing methods,
Optimized Rockfall Mapping. Remote
Sens. 2021, 13, 3812. https://doi.org/
                                          two statistical test were used, namely a paired Student’s t-test, and a non-parametric Wilcoxon
10.3390/rs13193812                        signed-rank. The results show that the accuracy of the BBA_PPK is inferior to that of BBA_traditional,
                                          with the total RMSE values for the three sites being 0.056, 0.066, and 0.305 m, respectively, compared
Academic Editors:                         to 0.019, 0.036 and 0.014 m obtained with BBA_traditional. The accuracies of the BBA methods are
Claudio Vanneschi, Mirko Francioni,       reflected in the accuracy of the orthomosaics, whose values for the BBA_PPK are 0.039, 0.043 and
Neil Bar and Chang-Wook Lee               0.157 m, respectively, against 0.029, 0.036 and 0.020 m obtained with the BBA_traditional. Concerning
                                          the DSM, those produced with the BBA_PPK method present accuracy values of 0.065, 0.072 and
Received: 1 July 2021                     0.261 m, respectively, against 0.038, 0.060 and 0.030 m obtained with the BBA_traditional. Even
Accepted: 18 September 2021
                                          though that there are statistically significant differences between the georeferencing methods, one
Published: 23 September 2021
                                          can state that the BBA_PPK presents a viable solution to map dangerous and exposed areas, such as
                                          rockfall transit and deposit areas, especially for applications at a regional level.
Publisher’s Note: MDPI stays neutral
with regard to jurisdictional claims in
                                          Keywords: georeferencing; UAV; photogrammetry; GNSS; PPK; accuracy; bundle block adjustment;
published maps and institutional affil-
                                          orthomosaic; digital surface model; rockfalls
iations.

                                          1. Introduction
Copyright: © 2021 by the authors.
Licensee MDPI, Basel, Switzerland.
                                                The use of unmanned aerial vehicles (UAVs) for remote sensing has become more
This article is an open access article
                                          common in the study of natural hazards and geomorphological processes, especially due
distributed under the terms and           to the development of technologies and mapping systems at larger scales, leading to a
conditions of the Creative Commons        more comprehensive understanding of natural processes. UAVs are especially suitable
Attribution (CC BY) license (https://     for studying and monitoring rockfalls [1–4], due to their smaller spatial extent and the
creativecommons.org/licenses/by/          fact that the potential rockfall areas are often located on steep slopes above infrastructure
4.0/).                                    and settlements, where the terrain is hardly accessible and dangerous for classical field

Remote Sens. 2021, 13, 3812. https://doi.org/10.3390/rs13193812                                       https://www.mdpi.com/journal/remotesensing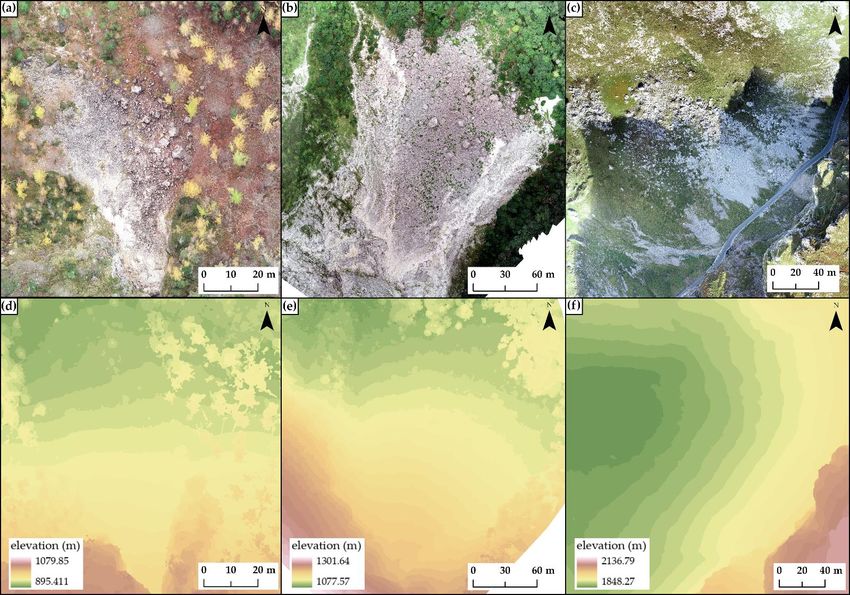
Remote Sens. 2021, 13, 3812                                                                                                2 of 31

                              observations [5–8]. Structure-from-motion (SfM) photogrammetry enables the production
                              of various high-resolution photogrammetric-derived products, such as point clouds, 3D
                              models of the surface, digital surface models (DSMs), digital terrain models (DTMs), and
                              orthomosaics [9,10]. The use of a UAV is suitable for the acquisition of remote sensing data
                              at a local scale (a few square kilometers), to which rockfalls are mostly limited [11]. As
                              UAVs are less demanding to operate, compared to other remote sensing technologies (e.g.,
                              aerial photogrammetry, satellites, etc.), both from the temporal and financial point of view,
                              the area of interest can be surveyed several times over shorter time periods, thus achieving
                              greater spatial (i.e., centimeter resolution) and temporal resolution of data [12,13].
                                    Previous photogrammetric rockfall hazard studies have focused on the potential of
                              photogrammetry for different applications, regarding the vertical and sub-vertical rock
                              slopes, as well as rockfall transit and deposit areas. The purpose of these studies was to
                              (i) identify potentially unstable blocks, wedges, joints, and blocks of the rockfalls; (ii) extract
                              rockfall discontinuities; (iii) identify potential rockfall release areas; and (iv) obtain spatial
                              data for rockfall modeling and rockfall risk assessment [3,5,7,8,14–23]. Photogrammetric
                              studies of rock faces have also included comparing and combining UAV photogrammetric
                              data with data obtained by aerial and terrestrial laser scanning.

                              1.1. Challenges of UAV Photogrammetric Georeferencing
                                    The positions and orientations of acquired aerial images must be known in order to
                              provide satisfactory accuracy of photogrammetric products, either by using the indirect
                              georeferencing approach with the use of ground control points (GCPs) or an approach
                              using bundle block adjustment (BBA) without GCPs. The indirect approach performs aerial
                              triangulation (AT) with BBA, using GCPs and/or the airborne global navigation satellite
                              system (GNSS)-assisted controls (i.e., the coordinates, X0 , Y0 , and Z0 of the perspective cen-
                              ters), while BBA approaches without GCPs involve position and orientation measurements
                              being obtained during camera capturing, and each aerial image is geolocated without any
                              need for GCPs [24,25]. The position (X0 , Y0 and Z0 ) is measured by the GNSS system, and
                              the camera orientation angles (w, ϕ and k) by an Inertial Measurement Unit (IMU). The
                              measurements form six parameters, called Exterior parameters (EO), which are used in
                              the collinearity equation for georeferencing [26]. A majority of UAVs use GNSS systems
                              that do not provide high spatial accuracy (i.e., meter-level accuracy) [27,28] of the images,
                              meaning that the support of GCPs is crucial for increasing accuracy.
                                    Due to its highest accuracy, indirect georeferencing is preferably used in the SfM
                              photogrammetry. While the preparation and execution of a UAV flight, in the case of
                              indirect georeferencing, can be performed from a safe location, the placement of the GCPs
                              needed in this situation must be performed directly within the area of interest. Surveying
                              of rockfalls can be an extremely challenging and dangerous field operation [27,29], due to
                              their environmental and geomorphological conditions (e.g., steep slopes, rock walls, scree
                              slopes, etc.), making them hard to access. To achieve the highest possible accuracy, GCPs
                              need to be placed homogeneously throughout the area of interest, covering the edges of
                              the area and having similar distances between them [30,31]. In the case of rockfalls, this
                              means placing them within rockfall deposit areas and also above the rock cliffs, which
                              could result in potentially more field workers in the field and separate surveys of the
                              area. The field workers are exposed to the dangers of new rockfall events, displacements
                              of already deposited rocks in the rockfall transit area, and other steep terrain-related
                              dangers (e.g., falls, damages to the surveying equipment, etc.). The process of establishing
                              the GCP network and measuring them with, for example, a total station or GNSS with
                              RTK (Real-Time Kinematic) mode to achieve horizontal accuracies of 0.010–0.020 m and
                              vertical accuracies of 0.020–0.030 m [32], is therefore not only dangerous but also time- and
                              labor-intensive [29,33].
                                    Due to the time-consuming procedure of indirect georeferencing with GCPs, UAV
                              platforms that allow for georeferencing of BBA without GCPs have been introduced
                              (see, e.g., References [34,35]). They use the so-called RTK, NRTK (Network Real-Time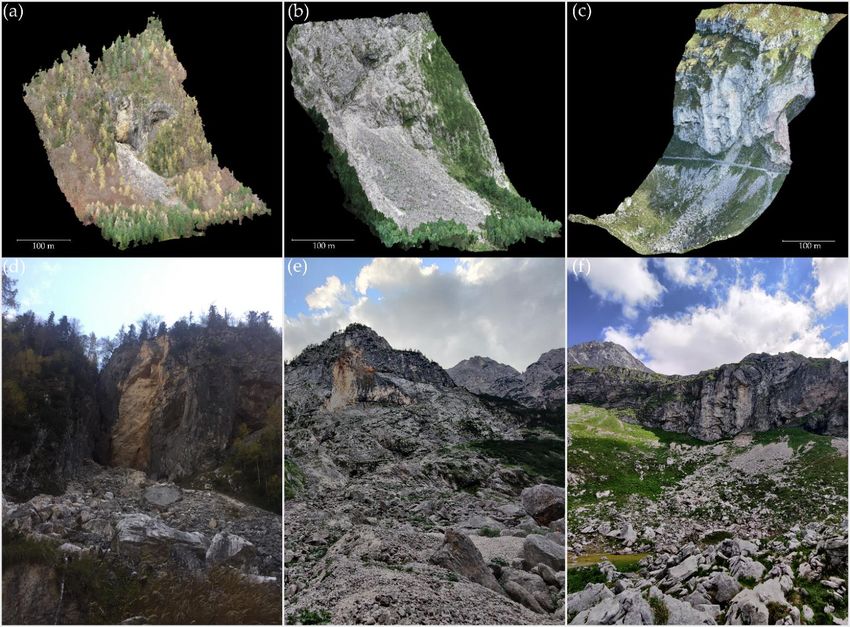
Remote Sens. 2021, 13, 3812                                                                                              3 of 31

                              Kinematics), and PPK (Post-Processing Kinematics) solutions, based on a multi-frequency
                              multi-constellation of GNSS receivers. By using GNSS RTK, positional data are acquired
                              from satellites and a base station providing real-time high-accuracy positions, such that
                              corrections in real time are applied to the data onsite. Although the PPK method gathers
                              positional data by using virtual reference station (VRS) or continuously operating reference
                              stations (CORS) in a similar manner, the corrections are applied in the post-processing stage.
                              With the accuracies of those methods being comparable to that of indirect georeferencing,
                              the GCPs would not be needed, thus decreasing the time required for the acquisition and
                              processing of the data [29,36,37].

                              1.2. Previous Work on UAV Images Georeferencing without GCPs
                                    Several studies have considered using image georeferencing without GCPs in the
                              production of UAV-photogrammetric-derived products. In the following paragraphs, we
                              present a short overview of the results provided only by UAV imagery georeferencing,
                              using BBA without GCPs (BBA_PPK). A complete overview of the reviewed studies is
                              available in Appendix A.
                                    Summarizing the reviewed studies, the study area, in most of cases was a flat agricul-
                              tural area [37–41], or an industrial/residential area [25,27,32,33,42–47]. Fewer studies have
                              focused on areas, such as quarries [36,41,48], coastal areas [49], forests [28], and cultural and
                              archeological sites [31,50]. These studies have largely used two types of UAV—senseFly
                              eBee RTK [25,27,28,32,36,43,47] and DJI Phantom 4 RTK [31,44–47,49,50]—while others
                              have used different UAV options [33,37–42]. Some studies have combined different UAV
                              RTK drones and cameras [27,37,40]. BBA approaches without GCPs points methods mostly
                              have used receiver stations located within the area of interest, while in some cases posi-
                              tional data were applied explicitly from the CORS stations. The configuration of the UAV
                              flights was mostly parallel to the surface and cross-grid with fixed flying height. Some
                              of the studies also tested different configurations, with regard to the flying heights and
                              patterns, including different angles for acquiring images. The front overlap of images was
                              mostly above 70%, and side overlap was about 60%.
                                    The accuracy of photogrammetric-derived products can be assessed by comparing
                              the photogrammetric models against a reference, or by using verification points (VPs)
                              surveyed with traditional topographical methods, and identified within the BBA and
                              orthomosaics/DSM [51]. In this review, we only included the results for the latter case,
                              as we used the same approach, and focused on horizontal and vertical accuracies that
                              were either compared for BBA, orthomosaics, and DSM. Observing the results for BBA,
                              studies have reported a horizontal accuracy between 0.020 and 0.060 m, and vertical
                              from 0.040 up to 0.300 m. Some studies have also reported lower accuracies: the specifics
                              of these UAV flights were higher flying altitudes of the UAV, flying in only one direc-
                              tion, surveying vegetated areas and areas that are more diverse with extreme elevation
                              changes, and with the CORS station at larger distances (especially affecting the vertical
                              accuracy) [28,31,39,41,48,49]. Horizontal accuracies of orthomosaics have revealed simi-
                              lar results, with values of 0.020–0.050 m, except for Mian et al. (2016) [38] and Tomaštik
                              et al. (2019) [28], where the accuracies resulting from different flight setups and vegetation
                              conditions varied between 0.044 and 0.087 m. Vertical accuracy estimated from the DSM
                              is, in the best case 0.030 m, reaching up to 0.200 m, with some exceptions exceeding these
                              values [37,38].

                              1.3. Aim of the Study
                                    A majority of the presented studies in Section 1.2. were carried out in flat areas with
                              homogeneous terrain conditions (except for the studies by Hugenholtz et al. [36], Tomaštík
                              et al. [28], and Tufarolo et al. [48]), where there is less satellite obstruction, better signal
                              reception, and finally conditions for measuring GCPs and VPs. In our research, we wanted
                              to test the accuracies of the photogrammetric products in the case of rockfalls, as the
                              conditions for a survey of high-accuracy data (e.g., GCP positions) are highly demanding,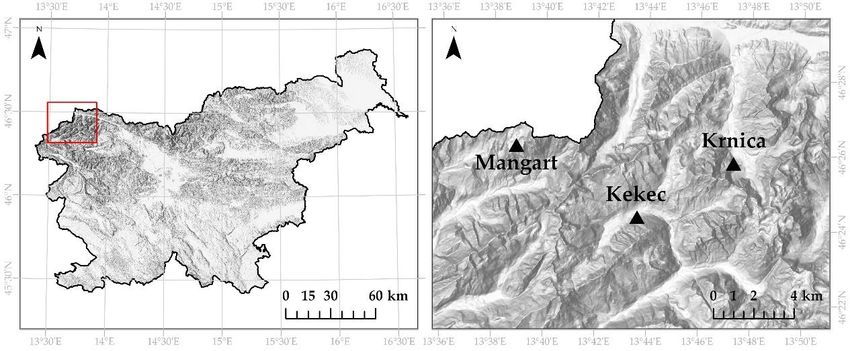
Remote Sens. 2021, 13, 3812                                                                                           4 of 31

                              due to the higher terrain roughness and larger elevation changes. It is crucial for surveyors
                              of these environments to know whether it is possible to achieve results comparable to those
                              acquired by using georeferencing, without requiring any GCP assistance. Therefore, we
                              question which georeferencing method is more appropriate and suitable for providing high-
                              accuracy photogrammetric-derived products, taking into consideration all of described
                              environmental challenges and risks of field operations in the event of rockfall hazards.
                              Either it is permissible to use the georeferencing with PPK (BBA_PPK) method, or the use
                              of indirect georeferencing (BBA_traditional) is still preferable and needed, especially in the
                              case of planning technical protection measures where an accuracy of the order of centime-
                              ters is required. As we wish to minimize the amount of time that field operators spend on
                              an active rockfall slope, the main goal of the research was to analyze which BBA method
                              (BBA_traditional or BBA_PPK) provides more accurate photogrammetric-derived products
                              (e.g., orthomosaics and DSMs). In the research, we compared the photogrammetric-derived
                              products that have been produced strictly by georeferencing, using BBA_PPK and indirect
                              georeferencing (using BBA_traditional only), to determine the possible applications in the
                              event of rockfall studies.
                                    The reason that we considered the option of not using BBA_PPK in combination with
                              the BBA_ traditional method is that the surveying of rockfalls can sometimes be too risky
                              to place any GCP below, for example, rock walls in the transit corridors of the falling rocks.
                              However, rockfalls located in remote and hardly accessible areas are still valuable and need
                              to be included in past rockfall databases. In our study, we are focused only on rockfall
                              transit and deposit areas, where we are collecting data on past rockfall events needed for
                              calibration and validation of rockfall models. For rockfall modeling, we require data on the
                              volume, location, shape of individual rock deposits, and surface roughness of the slope,
                              among others, and know that the accuracy of photogrammetric-derived products is crucial
                              for rockfall modeling at different scales.
                                    The remainder of the paper is structured as follows: In the Materials and Methods
                              section, we describe the test site, the experimental setup for comparing the results of
                              georeferencing with two different methods (i.e., AT with solely GCPs and using auxiliary
                              data provided by PPK and no GCPs), the UAV feature and flight plan, data processing,
                              measuring and obtaining the positions of the VPs, and statistical evaluation of the results.
                              In the Results section, we present the differences in the accuracy, using VPs, of the BBA (X,
                              Y, and Z), orthomosaics (X and Y), and DSM (Z), as obtained by the two georeferencing
                              methods mentioned above. In the Discussion section, we explain the significance of
                              the results, draw the main outcomes, and discuss possible future investigations. Due
                              to different applications (e.g., comparison of photogrammetric points clouds and laser
                              scanner point clouds; spatial planning—orthomosaics; and so on) [51], our comparison of
                              the results is carried out separately for BBA, for orthomosaics, and DSM.

                              2. Materials and Methods
                              2.1. Study Sites
                                   In the study, we used three rockfall deposit sites, all located in the Julian Alps in
                              the NW part of Slovenia (Figure 1). Two of the rockfalls are located in glacial alpine
                              valleys—Trenta (rockfall Kekec) and Krnica (rockfall Krnica)—while the third (rockfall
                              Mangart) is located on the mountain pass, below the mountain Mangart. This part of
                              the Alps is geotectonically part of the Southeastern Alps, the thrust unit of the Julian
                              Alps that consists of sediment rocks (mainly from Lower Triassic and Cretaceous, and
                              predominantly from Upper Triassic): limestone and dolomite, with limestone layers com-
                              monly passing into dolomite in vertical and lateral directions [52,53]. Faults in this area
                              have transverse Dinaric direction (NE–SW), while significant faults are also present in the
                              Dinaric direction (NW–SE).
                                   The rockfall deposits at the Kekec site consist of massive and bedded dolomite
                              and limestone (Carnian), at the Krnica site of bedded dolomite and limestone (Anisian–
                              Ladinian; Triassic), while at Mangart Pass, they consist of platy and bedded micritic and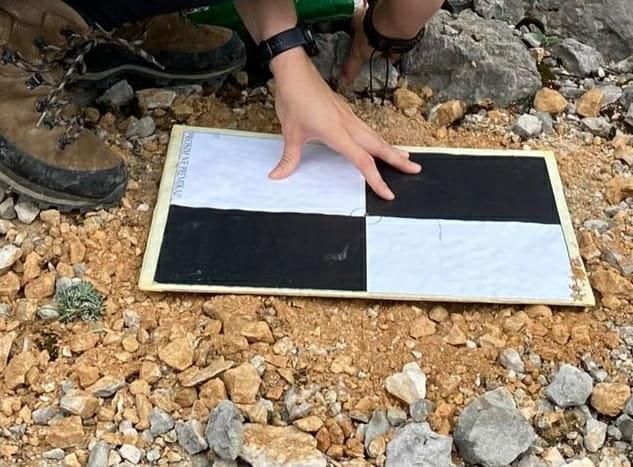
Remote Sens. 2021, 13, 3812 5 of 31
crinoid limestone with chert (Malm) from the Jurassic period. The specialty of this area (i.e.,
Mangart Pass) is that these beds are of restricted dimensions in the Julian Alps and rep-
resent tectonically confined rests of unconformably overlying limestones from the Upper
Triassic period (massive limestone) [54].
All release areas are characterized by steep, vertical slopes and walls from where the
rockfall material was deposited directly below the walls, steeper slopes, or lower down in
the valleys. The terrain is rough with great elevation and slope values variations which
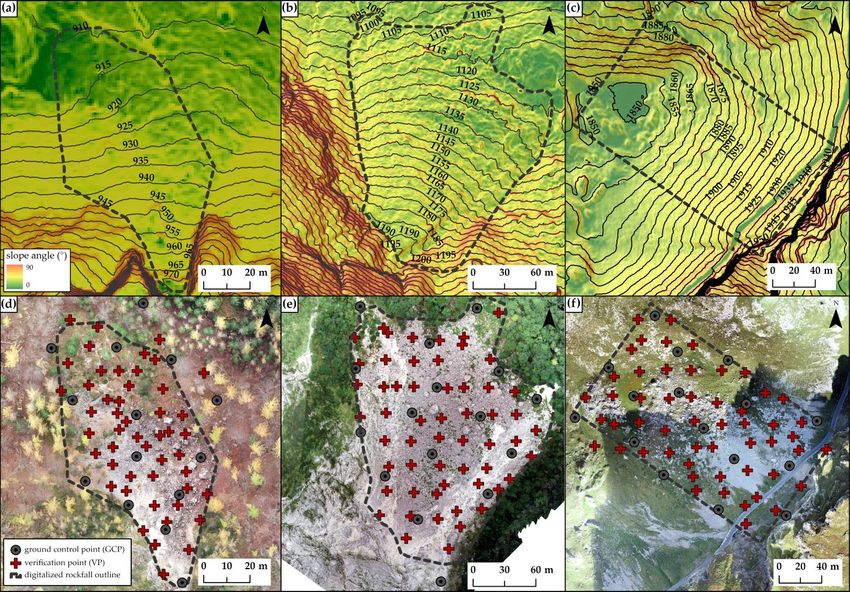
can be observed in Figures 2 and 3. The rockfall runout area was the smallest for the Kekec
rockfall (4800 m2 ), followed by Mangart (13,000 m2 ) and Krnica (35,000
Remote Sens. 2021, 13, x FOR PEER REVIEW 5 of 29
m2 ). At all three
rockfalls rock deposits, volumes vary from the size of the rocks on the scree slopes of up to
100–200 m3 at the Krnica rockfall, up to 30 m3 at the Mangart rockfall, and up to 70 m3 at
the Kekecdolomite in vertical and lateral directions [52,53]. Faults in this area have transverse Di-
rockfall. The conditions of surveying all three rockfalls are, therefore, extremely
naric direction (NE–SW), while significant faults are also present in the Dinaric direction
exposed,(NW–SE).
as the rocks deposited in the rockfall runout area can still be transported down
the slope, and Theasrockfall
theredeposits at the a
is always Kekec site consistof
possibility of new
massive and bedded
rockfall dolomite
events and
occurring. Even though
limestone (Carnian), at the Krnica site of bedded dolomite and limestone (Anisian–Ladin-
larger rockfall events in these sites have occurred in the past, the activity
ian; Triassic), while at Mangart Pass, they consist of platy and bedded micritic and crinoid of falling rocks
continueslimestone
whichwith canchert
be (Malm)
observed byJurassic
from the the colors
period.ofThethe rocks
specialty (brighter
of this area (i.e., color
Man- of rocks indicate
gart Pass) is that these beds are of restricted dimensions in the Julian Alps and represent
more recent events in comparison to darker deposits that are past events), and based on
tectonically confined rests of unconformably overlying limestones from the Upper Trias-
the vegetation (e.g.,
sic period rocks
(massive covered
limestone) [54]. by moss and grass; pioneer tree and shrub species).
Remote Sens. 2021, 13, x FOR PEER REVIEW 6 of 29
Figure 1. Locations of rockfalls (Slovenia) that were selected as study sites.
Figure 1. Locations of rockfalls (Slovenia) that were selected as study sites.
All release areas are characterized by steep, vertical slopes and walls from where the
rockfall material was deposited directly below the walls, steeper slopes, or lower down in
the valleys. The terrain is rough with great elevation and slope values variations which
can be observed in Figures 2 and 3. The rockfall runout area was the smallest for the Kekec
rockfall (4800 m2), followed by Mangart (13,000 m2) and Krnica (35,000 m2). At all three
rockfalls rock deposits, volumes vary from the size of the rocks on the scree slopes of up
to 100–200 m3 at the Krnica rockfall, up to 30 m3 at the Mangart rockfall, and up to 70 m3
at the Kekec rockfall. The conditions of surveying all three rockfalls are, therefore, ex-
tremely exposed, as the rocks deposited in the rockfall runout area can still be transported
down the slope, and as there is always a possibility of new rockfall events occurring. Even
though larger rockfall events in these sites have occurred in the past, the activity of falling
rocks continues which can be observed by the colors of the rocks (brighter color of rocks
indicate more recent events in comparison to darker deposits that are past events), and
based on the vegetation (e.g., rocks covered by moss and grass; pioneer tree and shrub
species).
Figure 2. Three-dimensional models of rockfalls (a–c) and photos from the field (d–f) of Kekec (a,d), Krnica (b,e), and
Figure 2. Three-dimensional
Mangart (c,f). models of rockfalls (a–c) and photos from the field (d–f) of Kekec (a,d), Krnica (b,e), and
Mangart (c,f).
2.2. Setting Up Ground Control and Verification Points
At each study site we set out VPs, which were later on used for accuracy comparison.
Besides the VPs, we also set GCPs, which were used exclusively for indirect georeferenc-
ing and were not used as VPs. Before setting up VPs in the field, we have defined the area
of interest at each rockfall by digitalizing the known rockfall runout area, using orthomo-
saics from previous UAV surveys. With the use of the Fishnet function in ArcGIS Pro 2.7.3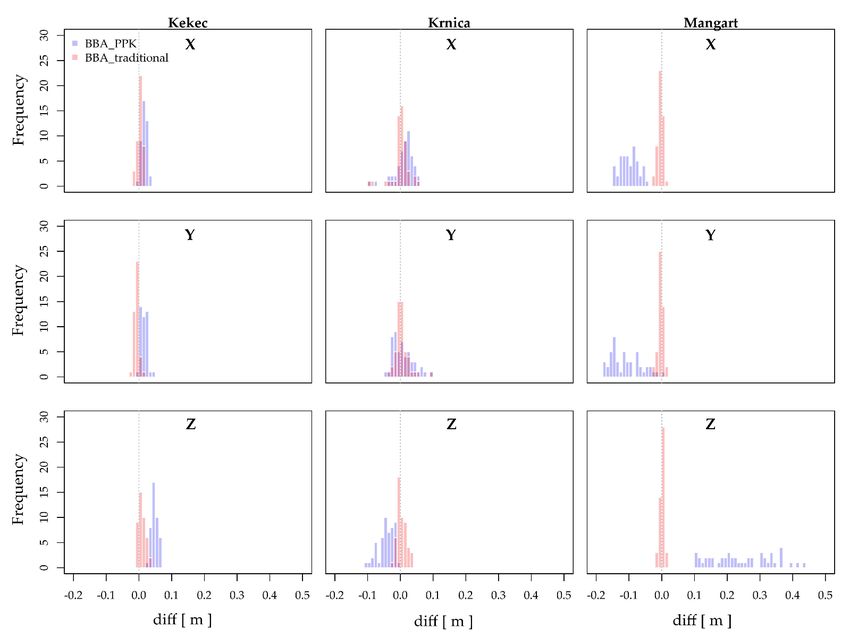
Remote Sens. 2021, 13, x FOR PEER REVIEW 7 of 29
Remote Sens. 2021, 13, 3812 6 of 31
when setting the points, based on the predicted locations, while also considering the out-
line of the rockfall runout area (Figure 3).
Figure
Figure 3. Elevation
3. Elevation andand slope
slope characteristicsof
characteristics ofstudied
studied areas
areas (a–c)
(a–c)with
withthe
thedrawn
drawnlocations of of
locations thethe
verification points
verification (VPs),
points (VPs),
ground control points (GCPs), and digitalized rockfall runout areas (d–f) at Kekec (a,d), Krnica (b,e), and Mangart (c,f).
ground control points (GCPs), and digitalized rockfall runout areas (d–f) at Kekec (a,d), Krnica (b,e), and Mangart (c,f).
VP and GCP targets were squares with a 2 × 2 chess pattern (two white and two black
2.2. Setting Up Ground Control and Verification Points
squares; Figure 4), as recommended by the Pix4Dmapper software [61], attached to the
At each
ground by astudy site wethe
nail through set center
out VPs, which
of the were
target. laterthat
Where on used for possible
was not accuracy(as,comparison.
on the
Besides
rockfallthe VPs, area,
runout we also setofGCPs,
most whichwas
the terrain were used exclusively
represented by rocks),forthe
indirect
targetsgeoreferencing
were fixed
and
withwere notatused
rocks their as VPs.At
edges. Before setting
the Krnica up VPs
rockfall, in thewith
targets field, we have defined
dimensions the area
21 cm × 29.7 cm of
interest at each
were used, rockfall
while by digitalizing
the targets at Kekec and theMangart
known rockfall runout
targets had area, using
dimensions orthomosaics
of 29.7 cm × 42
cm. previous
from The targetsUAVat Krnica rockfall
surveys. Withwere smaller
the use of thethan at other
Fishnet two locations,
function in ArcGIS as the
Proterrain
2.7.3 [55],
wewas too uneven
created to position
a VP sample larger
network targets. As
(locations) forall
eachrockfalls areThe
rockfall. located
final within
numbers theofTriglav
VPs were
42National
at Kekec, Park,
51 atany invasive
Krnica, andprocedures for placing
48 at Mangart rockfall.orGCP
making different
locations weretargets
also were not
preplanned
allowed.
and set up such that they were not at the same locations as VPs. The number and locations
of the All points
GCPs wereweresetthen
up surveyed,
accordingusingto thea Leica Viva TS12 totalin
recommendations station, while the the
the literature; orien-
main
condition was that the points were, as much as possible, regularly spaced withinSmart
tation points and backside locations were measured with a Leica Zeno20 with GG04 the area
ofAntenna
interest with accuracy
and its edges.ofThe0.010–0.030
horizontalm. distance
Measurements betweenof these points was
the points wereapproximately
carried out
in two different parts of the same day (average location of coordinates
30 m at Kekec, and 65 m at Krnica and Mangart [56–60]. We used 14 GCPs at Kekec, was later calcu-and
lated), with each coordinate
16 GCPs at Krnica and Mangart. being measured for an interval of 5 min (with a 6-h of differ-
ence). The differential correction data were acquired by using a real-time connection with
The known VP and GCP locations were then imported as shapefiles to the Leica
the Slovenian real-time positioning service SIGNAL. The closest station to all rockfalls
Zeno20 with GG04 Smart Antenna. The points in the field were, thus, set up by using this
was station Bovec, which is located 13 km from Mangart rockfall, 15 km from Kekec rock-
antenna and the known locations of the VPs and GCPs. As the automatic generation of the
fall, and 21 km from Krnica rockfall. The X and Y measurements were transformed to the
VP sample network and predicted locations of GCPs cannot account for the conditions in
the field, such that the points cannot be set due to particular terrain features (e.g., a more
or less flat area, vegetation, unstable terrain, etc.), the final locations were adjusted when
setting the points, based on the predicted locations, while also considering the outline of
the rockfall runout area (Figure 3).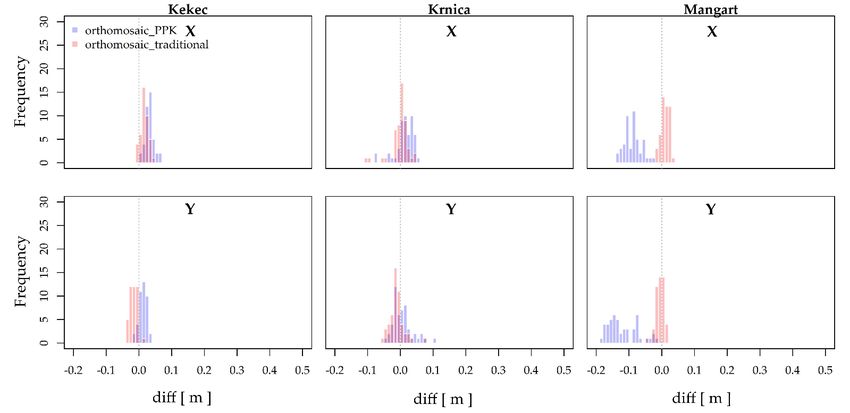
Remote Sens. 2021, 13, 3812 7 of 31
VP and GCP targets were squares with a 2 × 2 chess pattern (two white and two
black squares; Figure 4), as recommended by the Pix4Dmapper software [61], attached
to the ground by a nail through the center of the target. Where that was not possible
(as, on the rockfall runout area, most of the terrain was represented by rocks), the targets
Remote Sens. 2021, 13, x FOR PEER REVIEW 8 of 29
were fixed with rocks at their edges. At the Krnica rockfall, targets with dimensions
21 cm × 29.7 cm were used, while the targets at Kekec and Mangart targets had dimensions
of 29.7 cm × 42 cm. The targets at Krnica rockfall were smaller than at other two locations,
horizontal
as the terraingeodetic
was toodatum
uneven “Slovenia 1996/Slovene
to position National
larger targets. As all grid withare
rockfalls Slovenia
locatedGeodetic
within
Datum
the 1996”,
Triglav whilstPark,
National the Zany
coordinate
invasive was converted
procedures to an orthometric
for placing or making height, using
different the
targets
were not allowed.
geopotential model EGM96.
Figure4.4.Example
Figure Exampleof
ofverification
verificationpoint
point(VP)/ground
(VP)/ground control
control point
point (GCP)
(GCP) target
target set
set out
out in
in the
the field.
field.
2.3. Flight Planning
All points wereand
thenAcquisition
surveyed, of Dataawith
using LeicaUAV
Viva TS12 total station, while the orienta-
tion points
A DJI Phantom 4 RTK [34] drone with GNSS with
and backside locations were measured a Leica
RTK/PPK Zeno20 with
technology wasGG04
used Smart
to sur-
Antenna
vey the study sites. The UAV weighs 1391 g, has a diagonal distance of 350 mm, andout
with accuracy of 0.010–0.030 m. Measurements of these points were carried in
max-
two different parts of the same day (average location of coordinates was
imum flight time of 30 min. A camera that is mounted on the UAV has a 1-inch, 20-meg-later calculated),
with
apixeleach
CMOScoordinate beinglens
sensor with measured
FOV of for
84°an
8.8interval
mm/24 mm of 5 (35
minmm(with a 6-hequivalent)
format of difference).
and
The differential
f/2.8–f/11 correction
auto-focus at 1–∞data wereISO
m. The acquired by using
range for photosa isreal-time
100–3200connection with the
for auto mode, and
Slovenian real-time positioning service SIGNAL. The closest station to all
100–12,800 for manual. The maximum image size is 5472 × 3648 (3:2), with a pixel size of rockfalls was
station Bovec, which
approximately 2.4 μm.is located 13 km from
Multi-Frequency Mangart rockfall,
Multi-System 15 km from
High-Precision RTKKekec
GNSSrockfall,
enables
and
GPS (L1/L2), GLONASS (L1/L2), and Galileo (E1/E5a) tracking. The manufacturertostates
21 km from Krnica rockfall. The X and Y measurements were transformed the
horizontal geodetic datum “Slovenia 1996/Slovene National grid with Slovenia
that it enables a positional accuracy (RMSE) of 0.015 m (vertical) and 0.010 m (horizontal), Geodetic
Datum
both with1996”, whilst
1 ppm, the Z
which coordinate
means that thewas converted
error to anincrease
has a 1 mm orthometric height,
for each 1 kmusing the
of move-
geopotential model
ment by the UAV. EGM96.
The UAV surveys were performed on three separate days for each location: Krnica
2.3. Flight Planning and Acquisition of Data with UAV
rockfall was surveyed on 29 August 2019, Mangart rockfall on 20 September 2019, and
A DJI Phantom 4 RTK [34] drone with GNSS RTK/PPK technology was used to survey
Kekec rockfall on 7 November 2019. UAV flights were planned such that the flying height
the study sites. The UAV weighs 1391 g, has a diagonal distance of 350 mm, and maximum
was kept constant, using LiDAR-derived digital terrain model (DTM) with a spatial reso-
flight time of 30 min. A camera that is mounted on the UAV has a 1-inch, 20-megapixel
lution of 1 m. This feature allows for the acquisition of images with the same scale, despite
CMOS sensor with lens FOV of 84◦ 8.8 mm/24 mm (35 mm format equivalent) and
the terrain being very rugged with changing elevation (Figure 3). The flight pattern was
f/2.8–f/11 auto-focus at 1–∞ m. The ISO range for photos is 100–3200 for auto mode, and
perpendicular to the surface slope. The flying height was set to 80 m at all study sites, to
100–12,800 for manual. The maximum image size is 5472 × 3648 (3:2), with a pixel size of
achieve a ground sampling distance of 2–3 cm. The image overlaps were 80%. Pictures
approximately 2.4 µm. Multi-Frequency Multi-System High-Precision RTK GNSS enables
were taken at 45° and 90° angles, as the combination of oblique and nadir images contrib-
GPS (L1/L2), GLONASS (L1/L2), and Galileo (E1/E5a) tracking. The manufacturer states
utes to a more accurate representation of terrain [62]. For planning the UAV mission, we
that it enables a positional accuracy (RMSE) of 0.015 m (vertical) and 0.010 m (horizontal),
used the DJI GS RTK application.
The surveyed area for each site is provided in Table 1. We surveyed all sites in PPK
mode, such that GNSS data were recorded during the flight and post-processed by using
correctional data from the base station that was located within or next (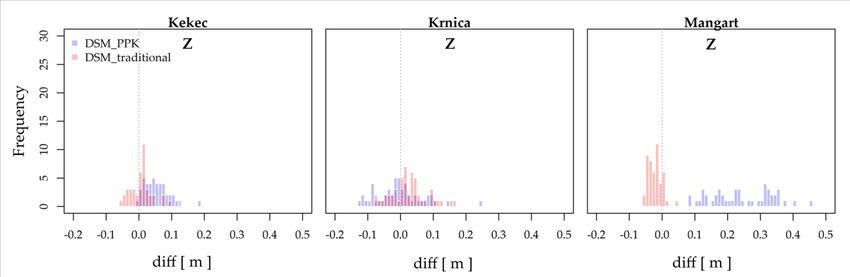
Remote Sens. 2021, 13, 3812                                                                                                  8 of 31

                                   both with 1 ppm, which means that the error has a 1 mm increase for each 1 km of
                                   movement by the UAV.
                                         The UAV surveys were performed on three separate days for each location: Krnica
                                   rockfall was surveyed on 29 August 2019, Mangart rockfall on 20 September 2019, and
                                   Kekec rockfall on 7 November 2019. UAV flights were planned such that the flying
                                   height was kept constant, using LiDAR-derived digital terrain model (DTM) with a spatial
                                   resolution of 1 m. This feature allows for the acquisition of images with the same scale,
                                   despite the terrain being very rugged with changing elevation (Figure 3). The flight pattern
                                   was perpendicular to the surface slope. The flying height was set to 80 m at all study
                                   sites, to achieve a ground sampling distance of 2–3 cm. The image overlaps were 80%.
                                   Pictures were taken at 45◦ and 90◦ angles, as the combination of oblique and nadir images
                                   contributes to a more accurate representation of terrain [62]. For planning the UAV mission,
                                   we used the DJI GS RTK application.
                                         The surveyed area for each site is provided in Table 1. We surveyed all sites in PPK
                                   mode, such that GNSS data were recorded during the flight and post-processed by using
                                   correctional data from the base station that was located within or next (
Remote Sens. 2021, 13, x FOR PEER REVIEW 10 of 29
Remote Sens. 2021, 13, 3812 9 of 31
method of inverse distance weighting. The results of photogrammetric processing are pro-
vided in Figure 5.
Figure5.5.Final
Figure Finalorthomosaics
orthomosaics(a–c)
(a–c)and
and digital
digital surface
surface models
models (DSM)
(DSM)(d–f)
(d–f)for
forKekec
Kekec(a,d),
(a,d),Krnica
Krnica(b,e),
(b,e),and
andMangart
Mangart(c,f).
(c,f).
The presented products were all produced by using the BBA_traditional method.
The presented products were all produced by using the BBA_traditional method.
2.5. Accuracy Assessment
The precision valuesofof
Bundle Block Adjustment,
the perspective centersOrthomosaic and Digital
of coordinates Surface Model
for BBA_PPK method
The in
are given accuracies of the they
Table 2, while BBA_traditional
were not needed and BBA_PPK, namely of as
for BBA_traditional, BBA (X, Y and Z),
all positional data
orthomosaic
of the images(X andremoved
were Y) and DSM (Z)the
before were assessed with the help of the VPs. The coordi-
processing.
nates of VPs, as computed by BBA_traditional and BBA_PPK, were retrieved through
Table 2. Precisionnamely
Pix4Dmapper, of the coordinates X0 , Y0 and Z0 in
by using Checkpoints. processing
They used as in
were marked thethe
perspective
same mannercentersasfor
BBA_PPK method and precision values for the GCP in the BBA_traditional.
GCPs, i.e., by measuring the center of the target (in this study, we marked each VP at 30
images). Then, the difference between the initial and computed position of the check-
Precision in m X0 Y0 Z0
points (for X, Y and Z) was calculated and shown in the quality report [48]. The calculated
differences BBA_traditional 0.012 0.009 0.019
KEKECwere further used in comparative analyses.
Coordinates of the VPs of the orthomosaics
BBA_PPK 0.006 (X and Y) and DSMs (Z) were 0.013
0.012 retrieved
by using GIS software, namely
BBA_traditional ArcGIS Pro 2.7.3
0.013 [55]. The VP targets
0.013 were vectorized
0.014
basedKRNICA
on the orthomosaic. To accurately determine the center of the target, the procedure
BBA_PPK 0.017 0.029 0.036
of vectorizing was carried out in three steps: (i) In the first step, a polygon with the actual
sizeMANGART BBA_traditional
of target was made, orientated in the0.008same direction as0.006 0.006
the target, and centralized
according to the center of the target, such0.039
BBA_PPK that it was covered by a polygon. (ii)
0.033 0.579In the
second step, two polylines were drawn from each polygon’s angle, such that they crossed
in the middle
The of the target.
resolution Lastly, (iii)
of orthomosaic andin the
DSM third
was step, the point to
determined thatberepresents
the same the center
as the GSD
of the target was placed at the crossing of the polylines. The location
(Kekec, 2.4 × 2.4 cm; Krnica, 2.5 × 2.5 cm; and Mangart, 2.2 × 2.2 cm; Table 1). Forof the point was usedthe
creation of the DSM, we used default options in Pix4DMapper, namely noise filtering to
correct the altitude of points with the median altitude of neighboring points, as well as
sharp surface smoothing. The generation of the point cloud can lead to noisy and erroneous
points, and with the noise filtering, the altitude of these points was corrected with the
median altitude of the neighboring points. Once the noise filter was applied, a surfaceRemote Sens. 2021, 13, 3812 10 of 31
was generated by using these points. However, the surface can still contain areas with
erroneous small bumps, and with surface smoothing these areas are then corrected by
flattening. Sharp surface smoothening is by default, and this type of smoothening tries
to preserve the orientation of the surface, and keeps sharp objects. In this process, only
quasi-planar areas were flattened. The DSM was generated in the raster GeoTIFF file
format, using the method of inverse distance weighting. The results of photogrammetric
processing are provided in Figure 5.
2.5. Accuracy Assessment of Bundle Block Adjustment, Orthomosaic and Digital Surface Model
The accuracies of the BBA_traditional and BBA_PPK, namely of BBA (X, Y and
Z), orthomosaic (X and Y) and DSM (Z) were assessed with the help of the VPs. The
coordinates of VPs, as computed by BBA_traditional and BBA_PPK, were retrieved through
Pix4Dmapper, namely by using Checkpoints. They were marked in the same manner
as GCPs, i.e., by measuring the center of the target (in this study, we marked each VP
at 30 images). Then, the difference between the initial and computed position of the
checkpoints (for X, Y and Z) was calculated and shown in the quality report [48]. The
calculated differences were further used in comparative analyses.
Coordinates of the VPs of the orthomosaics (X and Y) and DSMs (Z) were retrieved by
using GIS software, namely ArcGIS Pro 2.7.3 [55]. The VP targets were vectorized based
on the orthomosaic. To accurately determine the center of the target, the procedure of
vectorizing was carried out in three steps: (i) In the first step, a polygon with the actual size
of target was made, orientated in the same direction as the target, and centralized according
to the center of the target, such that it was covered by a polygon. (ii) In the second step,
two polylines were drawn from each polygon’s angle, such that they crossed in the middle
of the target. Lastly, (iii) in the third step, the point that represents the center of the target
was placed at the crossing of the polylines. The location of the point was used to calculate
the X and Y location from the orthomosaic. The whole procedure was performed three
times, separately [37], and, in the end, an average value of three coordinates was used as
the final one, which was used in further analyses. The Z coordinate was extracted from the
DSM layer, based on the planimetric (XY) locations of VPs as measured in the field, namely
by using the function Extract Values to Points.
The coordinate differences, as mentioned above, were then used to compute several
statistics. These concern the minimum, maximum, median, mean, standard deviation,
and root mean square error (RMSE) of the differences between the coordinates measured
on photogrammetric-derived products (XM , YM and ZM ) and given (XVP , YVP and ZVP )
coordinates of the VPs (Equations (1)–(3)) [63]:
diffX = XVP − XM (1)
diffY = YVP − YM (2)
diffZ = ZVP − ZM (3)
The RMSE, given by Equation (4) for the differences concerning each coordinate (C)
separately (n is a total number of coordinates), was computed as an accuracy value in
planimetry (Equation (5), [63]), and a total accuracy value (Equation (6), [63]) was also
computed as an accuracy value in planimetry (Equations (4)–(6); [63]):
s
diff2C
n
RMSEC = ∑1n
with C = X, Y, Z (4)
q
RMSExy = RMSEx 2 + RMSEy 2 (5)
q
RMSExyz = RMSEx 2 + RMSEy 2 + RMSEz 2 (6)Remote Sens. 2021, 13, 3812 11 of 31
The computed differences (diffX , diffY and diffZ ) are shown in the form of histograms for
each photogrammetric product and georeferencing method separately (Section 3.1, Section 3.2,
Section 3.3). Additionally, we also plotted the differences spatially to study any correlation
with the terrain topography; the differences were plotted for each photogrammetric product
and georeferencing method (Section 3.4).
To compare the accuracy of both the AT, using the BBA_traditional and BBA_PPK (X, Y
and Z), and the produced orthomosaics (X and Y) and DSM (Z) for each of the three study
areas, two statistical tests were carried out. Whereas the Shapiro-Wilk test [64] indicated
that the difference values were normally distributed (p-value > 0.05), a paired Student’s
t-test [65] was used, otherwise a non-parametric Wilcoxon signed-rank test [66] was used. All
calculations and statistical analyses were carried out in RStudio [67].
3. Results
3.1. Assessing the Accuracy of Bundle Block Adjustment
Table 3 shows the several statistics computed to assess the accuracies of BBA_traditional
and BBA_PPK. On the average, the BBA_traditional presented the smallest minimum value
of the differences per coordinate. The differences range from −0.098 m (Krnica, diffX ) to
0.091 m (Krnica, diffY ) in the case of BBA_traditional, while the differences with BBA_PPK
were higher; they range from −0.171 m (Mangart, diffY ) to 0.431 m (Mangart, diffZ ). The
mean value of differences ranges from −0.006 m (Kekec, diffY ) to 0.009 m (Kekec, diffZ ) in the
case of BBA_traditional. The mean value of the differences with BBA_PPK were higher, and
range from −0.109 m (Mangart, diffY ) to 0.245 m (Mangart, diffZ ). The standard deviations of
the differences were similar for both BBA methods for all coordinates when observing the
Kekec (from 0.008 to 0.010 m) and Krnica site (from 0.014 to 0.031 m). At Mangart site, the
BBA_PPK had larger standard deviations than BBA_traditional, namely reaching 0.028 for
diffX , 0.047 m for diffY , and 0.092 m for diffZ , while BBA_traditional had values between 0.007
and 0.008 m.
Table 3. Basic statistics for the differences in X, Y and Z coordinates of VPs measured in the field by total station and
obtained by the BBA_traditional and BBA_PPK methods.
KEKEC KRNICA MANGART
Units in m
BBA_Traditional BBA_PPK BBA_Traditional BBA_PPK BBA_Traditional BBA_PPK
diffX -MIN −0.017 −0.001 −0.098 −0.091 −0.029 −0.148
diffX -MAX 0.020 0.037 0.056 0.057 0.011 −0.043
diffX -MEAN 0.004 0.017 0.001 0.013 −0.004 −0.098
diffX -MEDIAN 0.004 0.016 0.004 0.015 −0.003 −0.100
diffX -SD 0.008 0.009 0.026 0.029 0.008 0.028
RMSEX 0.009 0.019 0.026 0.032 0.009 0.102
diffY -MIN −0.028 0.000 −0.033 −0.041 −0.024 −0.171
diffY -MAX 0.016 0.044 0.091 0.100 0.013 0.001
diffY -MEAN −0.006 0.016 0.004 0.008 −0.003 −0.109
diffY -MEDIAN −0.006 0.015 0.001 0.002 −0.002 −0.118
diffY -SD 0.008 0.010 0.020 0.031 0.008 0.047
RMSEY 0.010 0.019 0.020 0.031 0.008 0.119
diffZ -MIN −0.010 0.023 −0.022 −0.102 −0.014 0.102
diffZ -MAX 0.037 0.069 0.038 −0.004 0.015 0.431
diffZ -MEAN 0.009 0.049 0.004 −0.042 0.002 0.245
diffZ -MEDIAN 0.009 0.048 0.001 −0.040 0.003 0.232
diffZ -SD 0.010 0.010 0.014 0.023 0.007 0.092
RMSEz 0.014 0.050 0.015 0.048 0.007 0.261
RMSEXYZ 0.019 0.056 0.036 0.066 0.014 0.305
LEGEND
diff(X/Y/Z )-MIN the minimum value of the differences in X/Y/Z
diff(X/Y/Z )-MAX the maximum value of the differences in X/Y/Z
diff(X/Y/Z )-MEAN the mean value of the differences in X/Y/Z
diff(X/Y/Z )-MEDIAN the median value of the differences in X/Y/Z
diff(X/Y/Z )-SD the standard deviation of the differences in X/Y/Z
RMSE(X/Y/Z ) root mean square error of X/Y/ZRemote Sens. 2021, 13, 3812 12 of 31
The lowest RMSE values per coordinate were achieved with the BBA_traditional
method at the Kekec and Mangart study sites, with the RMSE values lower than 0.015 m
in all coordinates (Kekec, RMSEX = 0.009 m, RMSEY = 0.010 m, and RMSEZ = 0.014 m;
Mangart, RMSEX = 0.009 m, RMSEY = 0.008 m, and RMSEZ = 0.007 m). At the Krnica study
site, the results were slightly worse, but the RMSE in all coordinates did not exceed 0.029 m
(Krnica, RMSEX = 0.026 m, RMSEY = 0.020 m, and RMSEZ = 0.015 m). The RMSE values
per coordinate with the BBA_PPK method ranges from 0.019 to 0.050 m at the Kekec and
Krnica rockfall site, while at the Mangart rockfall site, RMSE values per coordinate achieve
values between 0.102 and 0.261 m.
The overall accuracy of BBA (RMSEXYZ ) was higher in the case of BBA_traditional
(range
Remote Sens. 2021, 13, x FOR PEER REVIEW
from 0.014 to 0.036 m); namely, in the case of the BBA_PPK method, the RMSE XYZ
13 of 29
ranged from 0.056 to 0.305 m. Figure 6 shows the frequency distributions of the diffX ,
diffY , and diffZ at the sites for both georeferencing methods. It can be observed that
the differences related to BBA_traditional method are closely clustered around 0, having
with the latter
uni-modal having a larger
distribution. span of values,
The differences withtothe
related theexception of the Mangart
BBA_traditional location,
coincided with
where
BBA_PPK, the differences of BBA_traditional
with the latter and of
having a larger span BBA_PPK coincided
values, with in a small
the exception part
of the or not
Mangart
at all.
location, where the differences of BBA_traditional and BBA_PPK coincided in a small part
or not at all.
Figure 6.
Figure Frequency distribution
6. Frequency distributionof ofthe
theX,X,YYand
andZ Zcoordinates’ differences
coordinates’ at all
differences three
at all rockfall
three sitessites
rockfall for BBA_traditional and
for BBA_traditional
BBA_PPK. Bar width is set to 0.01 m.
and BBA_PPK. Bar width is set to 0.01 m.
A paired Student’s t-test, for testing whether there was a statistically significance
A paired
difference Student’s
in the t-test, of
mean value fordifferences
testing whether there
between was
the a statistically significance
BBA_traditional and BBA_PPK,dif-
ference in the mean value of differences between the BBA_traditional and BBA_PPK,
was used in three cases: diffX , diffY , and diffZ in Mangart. In all cases, there was a was
used in three cases: diffX, diffY, and diffZ in Mangart. In all cases, there was a statistically
significant difference between the mean values (p ≤ 0.05). For the rest of the pairs, a non-
parametric Wilcoxon signed-rank test was used, which showed that, only in the case of
diffY at Krnica location, there was not a statistically significant difference between the me-
dian values between the georeferencing methods (p > 0.05).Remote Sens. 2021, 13, 3812 13 of 31
statistically significant difference between the mean values (p ≤ 0.05). For the rest of the
pairs, a non-parametric Wilcoxon signed-rank test was used, which showed that, only
in the case of diffY at Krnica location, there was not a statistically significant difference
between the median values between the georeferencing methods (p > 0.05).
3.2. Assessing Accuracy of Orthomosaic
Table 4 shows the statistics, as detailed in Section 2.5, computed by measuring the
VP at orthomosaics produced for the three study areas, and produced by carrying out the
AT with the BBA_traditional and BBA_PPK methods. Similarly, as for BBA accuracy, the
BBA_traditional method achieved the smallest difference in average in each coordinate,
compared to the VPs. The differences range from −0.104 m (Krnica, diffX ) to 0.078 m
(Krnica, diffY ) in the case of BBA_traditional, while the differences with BBA_PPK were
higher; they range from −0.181 m (Mangart, diffY ) to −0.016 m (Mangart, diffX ). The mean
value of differences ranges from −0.017 m (Kekec, diffY ) to 0.018 m (Kekec, diffX ) in the case
of BBA_traditional. The mean value of differences with BBA_PPK were higher, and range
from −0.119 m (Mangart, diffY ) to −0.089 m (Mangart, diffX ). The standard deviations
of the differences were similar for both BBA methods for all coordinates when observing
the Kekec (from 0.011 to 0.012 m) and Krnica site (from 0.022 to 0.027 m). At Mangart
site, the BBA_PPK had larger standard deviations than BBA_traditional, namely reaching
0.026 m for diffX and 0.045 m for diffY , while in case of BBA_traditional, standard deviation
values were the same for diffX and diffY (0.012 m). The RMSE values per coordinate were
similar between the both coordinates in the case of BBA_traditional with all rockfall sites
(0.020–0.021 m for Kekec, 0.025–0.026 m for Krnica, and 0.013–0.016 for Mangart). For the
BBA_PPK method the RMSE values range from 0.031 to 0.034 m at the Kekec and Krnica
rockfall site, while at the Mangart rockfall site RMSE values per coordinate achieve values
between 0.093 and 0.127 m.
In Figure 7, the frequency distributions of the diffX and diffY for both georeferencing
methods and all sites can be observed. Similar as with the assessment of BBA, the lowest
values of differences were achieved by BBA_traditional, which had the densest distribution
in PEER
Remote Sens. 2021, 13, x FOR all cases,
REVIEW and differences are clustered around 0. BBA_traditional’s differences 15 of 29 did have
an overlap with BBA_PPK, but the differences of BBA_PPK experienced larger variability.
The location that stood out is Mangart, where the differences of X and Y retrieved from
the following
orthomosaic cases: diff
produced and diffY in Kekec,
byXBBA_PPK were and diffXand
larger in Mangart. At alldid
do mostly locations and
not match with those
coordinates, there were significance differences between the mean values (p ≤ 0.05). With
of BBA_traditional. The overall accuracy of orthomosaic (RMSE
other pairs, a non-parametric Wilcoxon signed-rank test was used, which also
) was
XYshowed higher in the
case of that
BBA_traditional (range from 0.020 to 0.036 m), while the RMSE
there were statistically significant differences between the median values between XYtheof orthomosaics
produced by the BBA_PPK
georeferencing methods in ranged from(p0.039
all of the cases ≤ 0.05).to 0.157 m.
Figure 7.distribution
Figure 7. Frequency Frequency distribution
of the Xof and
the X Y
and Y coordinatedifferences
coordinate differences at all
atthree rockfallrockfall
all three sites for orthomosaic_traditional
sites for orthomosaic_traditional
(produced by BBA_traditional) and orthomosaic_PPK (produced by BBA_PPK). Bar width is set to 0.01 m.
(produced by BBA_traditional) and orthomosaic_PPK (produced by BBA_PPK). Bar width is set to 0.01 m.
3.3. Assessing Accuracy of DSM
The accuracy of DSMs was assessed through the differences between the VP coordi-
nate (Z) and coordinate extracted from the BBA_traditional and BBA_PPK methods. Table
5 shows the basic results for difference statistics for Z coordinate and the final RMSEZ
values. The differences range from −0.079 m (Krnica) to 0.165 m (Krnica) in the case of
BBA_traditional, while the differences with BBA_PPK were higher; they range from
−0.129 m (Krnica) to 0.453 m (Mangart). The mean value of differences ranges from −0.022Remote Sens. 2021, 13, 3812 14 of 31
Table 4. Basic statistics for differences in X and Y coordinates measured in the field by the total station and obtained by the orthomosaic_traditional or orthomosaic_PPK methods.
KEKEC KRNICA MANGART
Units in m.
Orthomosaic_Traditional Orthomosaic_PPK Orthomosaic_Traditional Orthomosaic_PPK Orthomosaic_Traditional Orthomosaic_PPK
diffX -MIN −0.007 0.008 −0.104 −0.079 −0.011 −0.139
diffX -MAX 0.045 0.061 0.046 0.052 0.037 −0.026
diffX -MEAN 0.018 0.032 0.000 0.014 0.011 −0.089
diffX -MEDIAN 0.018 0.031 0.003 0.017 0.012 −0.088
diffX -SD 0.012 0.012 0.027 0.028 0.012 0.026
RMSEX 0.021 0.034 0.026 0.031 0.016 0.093
diffY -MIN −0.036 −0.013 −0.056 −0.041 −0.044 −0.181
diffY -MAX 0.011 0.039 0.078 0.106 0.016 −0.016
diffY -MEAN −0.017 0.013 −0.012 0.006 −0.005 −0.119
diffY -MEDIAN −0.016 0.011 −0.013 0.002 −0.002 −0.133
diffY -SD 0.011 0.012 0.022 0.029 0.012 0.045
RMSEY 0.020 0.017 0.025 0.030 0.013 0.127
RMSEXY 0.029 0.039 0.036 0.043 0.020 0.157
LEGEND
diff(X/Y )-MIN the minimum value of the differences in X/Y
diff(X/Y )-MAX the maximum value of the differences in X/Y
diff(X/Y )-MEAN the mean value of the differences in X/Y
diff(X/Y )-MEDIAN the median value of the differences in X/Y
diff(X/Y )-SD the standard deviation of the differences in X/Y
RMSE(X/Y ) root mean square error of X/YRemote Sens. 2021, 13, 3812 15 of 31
A paired Student’s t-test, for testing if there was a statistically significance difference
in the mean value of differences between the BBA_traditional and BBA_PPK, was used in
the following cases: diffX and diffY in Kekec, and diffX in Mangart. At all locations and
coordinates, there were significance differences between the mean values (p ≤ 0.05). With
other pairs, a non-parametric Wilcoxon signed-rank test was used, which also showed
that there were statistically significant differences between the median values between the
georeferencing methods in all of the cases (p ≤ 0.05).
3.3. Assessing Accuracy of DSM
The accuracy of DSMs was assessed through the differences between the VP coordinate
(Z) and coordinate extracted from the BBA_traditional and BBA_PPK methods. Table 5
shows the basic results for difference statistics for Z coordinate and the final RMSEZ
values. The differences range from −0.079 m (Krnica) to 0.165 m (Krnica) in the case
of BBA_traditional, while the differences with BBA_PPK were higher; they range from
−0.129 m (Krnica) to 0.453 m (Mangart). The mean value of differences ranges from
−0.022 m (Mangart) to 0.026 m (Krnica) in the case of BBA_traditional. The mean value
of differences with BBA_PPK were higher, and range from −0.002 m (Krnica) to 0.244 m
(Mangart). The standard deviations of the differences were the same for both BBA methods
at the Kekec site (0.037 m), while larger differences in standard deviation were present at
the Krnica (0.055 m for BBA_traditional, 0.072 m for BBA_PPK) and Mangart site (0.021 m
for BBA_traditional, 0.093 m for BBA_PPK).
Table 5. Basic statistics for differences in Z coordinate measured in the field by total station and obtained by the
DSM_traditional or DSM_PPK.
KEKEC KRNICA MANGART
Units in m
DSM_Traditional DSM_PPK DSM_Traditional DSM_PPK DSM_Traditional DSM_PPK
diffZ -MIN −0.051 −0.002 −0.079 −0.129 −0.053 0.081
diffZ -MAX 0.122 0.184 0.165 0.245 0.042 0.453
diffZ -MEAN 0.010 0.053 0.026 −0.002 −0.022 0.244
diffZ -MEDIAN 0.013 0.048 0.019 −0.005 −0.022 0.237
diffZ -SD 0.037 0.037 0.055 0.072 0.021 0.093
RMSEZ 0.038 0.065 0.060 0.072 0.030 0.261
LEGEND
diffZ -MIN the minimum value of the differences in Z
diffZ -MAX the maximum value of the differences in Z
diffZ -MEAN the mean value of the differences in Z
diffZ -MEDIAN the median value of the differences in Z
diffZ -SD the standard deviation of the differences in Z
RMSEZ root mean square error of Z
RMSEZ was generally smaller in the case of the BBA_traditional method; however,
in comparison to the BBA_PPK method for the Kekec and Krnica, the difference was
only 0.027 m and 0.012 m, respectively. Larger differences in RMSEZ were presented for
the Mangart rockfall, namely they reached 0.231 m. The frequency distribution of the Z
coordinates (Figure 8) indicates that DSM produced with BBA_traditional achieved the
lowest differences, while the values had larger span, compared to the assessment of BBA
alone. The differences of BBA_traditional and BBA_PPK coincided in a larger part of the
frequency distribution, with the latter achieving larger differences. The results were, similar
as with the assessment of BBA and orthomosaic, different at the Mangart location; where,
for the DSM produced with BBA_PPK, the differences were larger and had greater span
than those ones produced with BBA_traditional. Moreover, the differences did not coincide
at all at the Mangart location.
To test for statistically significant differences in the mean value of differences between
the BBA_traditional and BBA_PPK, a paired Student’s t-test was used for diffZ at the Krnica
and Mangart site. It showed that there were statistically significant differences in the meanRMSEZ 0.038 0.065 0.060 0.072 0.030 0.261
LEGEND
diffZ-MIN the minimum value of the differences in Z
diffZ-MAX the maximum value of the differences in Z
Remote Sens. 2021, 13, 3812 16 of 31
diffZ-MEAN the mean value of the differences in Z
diffZ-MEDIAN the median value of the differences in Z
diffZ-SD value between the georeferencing themethods
standard deviation
values (p ≤ of the A
0.05). differences in Z Wilcoxon
non-parametric
RMSEZ signed-rank test was used for diffZ at Kekec,
root mean square error of Z
and it showed that there was a statistically
significant difference between the median values of georeferencing methods (p ≤ 0.05).
Figure 8.
8. Frequency
Frequencydistribution
distribution of the
of the Z coordinates
Z coordinates differences
differences at allrockfall
at all three three rockfall sites for DSM_traditional
sites for DSM_traditional and
and DSM_PPK.
DSM_PPK.
Bar width isBar
set width
to 0.01ism.
set to 0.01 m.
Remote Sens. 2021, 13, x FOR PEER REVIEW 17 of 29
3.4. Spatial Distribution of X, Y and Z Differences
To test for statistically significant differences in the mean value of differences be-
tweenTothe
observe the spatialand
BBA_traditional pattern of the adifferences
BBA_PPK, for individual
paired Student’s t-test wascoordinates,
used for diffthey
Z at
were
the plotted
Krnica and for each VP
Mangart and
site. It for all that
showed photogrammetric
there were productssignificant
statistically produceddifferences
(i.e., BBA,
a systematic increase of diffX and diffY in towards the northwestern part and towards the
orthomosaics,
in the mean valueand DSM). All theplots (Figures 9 and 10) include the marked outlines of the
southwestern part between
of the rockfallgeoreferencing
for the diffZ, methods values
which also had the(p ≤largest
0.05). A non-paramet-
values.
rockfall areas.
ric Wilcoxon signed-rank test was used for diffZ at Kekec, and it showed that there was a
statistically significant difference between the median values of georeferencing methods
(p ≤ 0.05).
3.4. Spatial Distribution of X, Y and Z Differences
To observe the spatial pattern of the differences for individual coordinates, they were
plotted for each VP and for all photogrammetric products produced (i.e., BBA, orthomo-
saics, and DSM). All plots (Figures 9 and 10) include the marked outlines of the rockfall
areas.
Figure 9 shows the spatial distribution of the difference values diffX, diffY and diffZ
of respectively BBA_traditional and BBA_PPK methods. When observing the results of
BBA_traditional, those differences appear to be randomly distributed through the rockfall
areas, except for Krnica where larger diffX and diffY are concentrated in the central part
Figure 9. Spatial
Figure 9. Spatial distribution
distribution of
of the
the differences
differences in
in X,
X, Y
Y and
and Z coordinates, calculated
Z coordinates, calculated for
for accuracy
accuracy assessment
assessment of
of BBA
BBA
produced by the BBA_traditional and the BBA_PPK method.
produced by the BBA_traditional and the BBA_PPK method.
Figure
The 9 shows
results the orthomosaics
for the spatial distribution of thebydifference
produced values diffX,
BBA_traditional diffY
(Figure 10,and diffZ
X and Y
of respectively
coordinates) BBA_traditional
showed similarity toand
theBBA_PPK methods.
BBA accuracy Whenfor
assessment observing
X and Ythe results of
coordinates.
BBA_traditional, those differences appear to be randomly distributed through the rockfall
The spatial pattern and the difference degree were both similar for all rockfalls. For the
areas, except for Krnica where larger diffX and diffY are concentrated in the central part of
orthomosaics produced by the BBA_PPK method, no spatial pattern was recognized for
Kekec and Krnica, as they varied across the whole rockfall sites. At the Mangart location,
larger differences can be recognized towards the northwestern part of the rockfall site.
As for the DSM result for BBA_traditional (Figure 10, Z coordinate), Krnica rockfall
was the only one that had larger differences in the central part of the rockfall while, for
the other two, the spatial pattern of the differences could not be recognized. On the otherYou can also read