Advance of soy commodity in the southern Amazonia with deforestation via PRODES and ImazonGeo: a moratorium based approach - Nature
←
→
Page content transcription
If your browser does not render page correctly, please read the page content below
www.nature.com/scientificreports
OPEN Advance of soy commodity
in the southern Amazonia
with deforestation
via PRODES and ImazonGeo:
a moratorium‑based approach
Thais Lourençoni1, Carlos Antonio da Silva Junior2, Mendelson Lima1,
Paulo Eduardo Teodoro3*, Tatiane Deoti Pelissari4, Regimar Garcia dos Santos3,
Larissa Pereira Ribeiro Teodoro3, Iago Manuelson Luz1 & Fernando Saragosa Rossi5
The guidance on decision-making regarding deforestation in Amazonia has been efficient as a result
of monitoring programs using remote sensing techniques. Thus, the objective of this study was to
identify the expansion of soybean farming in disagreement with the Soy Moratorium (SoyM) in the
Amazonia biome of Mato Grosso from 2008 to 2019. Deforestation data provided by two Amazonia
monitoring programs were used: PRODES (Program for Calculating Deforestation in Amazonia) and
ImazonGeo (Geoinformation Program on Amazonia). For the identification of soybean areas, the
Perpendicular Crop Enhancement Index (PCEI) spectral model was calculated using a cloud platform.
To verify areas (polygons) of largest converted forest-soybean occurrences, the Kernel Density
(KD) estimator was applied. Mann–Kendall and Pettitt tests were used to identify trends over the
time series. Our findings reveal that 1,387,288 ha were deforested from August 2008 to October
2019 according to PRODES data, of which 108,411 ha (7.81%) were converted into soybean. The
ImazonGeo data showed 729,204 hectares deforested and 46,182 hectares (6.33%) converted into
soybean areas. Based on the deforestation polygons of the two databases, the KD estimator indicated
that the municipalities of Feliz Natal, Tabaporã, Nova Ubiratã, and União do Sul presented higher
occurrences of soybean fields in disagreement with the SoyM. The results indicate that the PRODES
system presents higher data variability and means statistically superior to ImazonGeo.
Amazonia extends over nine countries in South America, with about 60% of its area within Brazilian territory.
It is recognized worldwide for its beauty and biodiversity, acting in the regulation of the local, regional, and
global climate1–6.
Despite its exuberance and the ecosystem services it provides, the forest has been constantly affected by
deforestation, resulting in biodiversity loss and climate change2–4,7. Ecological modeling assessments indicate
that if deforestation exceeds 20–40%, the Amazonia climate and vegetation will reach its tipping p oint8–10. Today,
the forest has already lost 20% of its original vegetation cover, which has been replaced by pastures and soybean
crops11–13.
One of the ways to contain deforestation in the region were the agreements signed, such as the Soy Mora-
torium (SoyM) in the soybean sector, which foresees the non-commercialization of soybeans originating from
deforested areas as from August 2008, and the Beef Conduct Adjustment Terms (TAC) in the livestock sector14–16.
Despite these efforts, the forest is still being illegally deforested and replaced with pastures and soy17.
To verify these illegal deforestations, there are two databases freely available in Brazil. The Amazonia Defor-
estation Monitoring Project (PRODES), which is developed and executed by the National Institute for Space
1
State University of Mato Grosso (UNEMAT), Alta Floresta, MT, Brazil. 2Department of Geography, State University
of Mato Grosso (UNEMAT), Sinop, MT, Brazil. 3Department of Crop Science, Department of Agronomy, Federal
University of Mato Grosso Do Sul (UFMS), Chapadão Do Sul, MS, Brazil. 4State University of São Paulo (UNESP),
Ilha Solteira, SP, Brazil. 5State University of São Paulo (UNESP), Jaboticabal, SP, Brazil. *email: eduteodoro@
hotmail.com
Scientific Reports | (2021) 11:21792 | https://doi.org/10.1038/s41598-021-01350-y 1
Vol.:(0123456789)
www.nature.com/scientificreports/
Imazon PRODES
Variable Mann–Kendall Pettitt Year Mann–Kendall Pettitt Year
Total deforestation < 0.00 0.03 2013 0.03 0.19 –
Deforestation for soybean < 0.00 0.03 2013 < 0.00 0.03 2013
Total polygons < 0.00 0.03 2013 0.99 0.97 –
Polygons for soybean < 0.00 0.03 2013 < 0.00 0.03 2013
Table 1. P-value of the Mann–Kendall and Pettitt tests for the variables total deforestation, deforestation for
soybean planting, total polygons, and polygons for soybean planting obtained from the Imazon and PRODES
monitoring systems.
Research (INPE), and the Amazonia Geoinformation Program (SAD/ImazonGeo) developed by the Institute
for Man and the Environment of the Amazon (Imazon). They identify the deforested areas in Amazonia region
from remote sensing (RS) techniques18,19. The data provided by these programs assist research and alert to the
implementation of conservation policies. SR is also helpful in identifying crops, and cross-referencing this
information can tell us where the forest has been replaced by agriculture.
The Perpendicular Crop Enhancement Index (PCEI), recently used in mapping soybean areas20,21, has been
positively effective in monitoring soybean farming and has become an essential tool in monitoring the expan-
sion of the crop in the face of deforestation in the Amazonia17,22–24. Monitoring anthropic impacts using the SR
technique has been effective in environmental s tudies20,25.
This study aimed to verify the conversion of forest into soybean areas in disagreement with the SoyM and
using the deforestation data from PRODES and ImazonGeo in the Amazonia portion found in the northern
region of the State of Mato Grosso, which is the largest grain producer in Brazil.
Results
To authenticate the data obtained, the trend tests applied to the evaluated variables were performed and are shown
in Table 1. All variables quantified with the ImazonGeo monitoring system presented a significant increase trend
by the Mann–Kendall test, i.e., there is a trend for increased deforestation over the years evaluated as well as an
increase in polygons. The PRODES system also showed an upward trend for all variables except for the number
of total polygons. Pettitt test identified the year 2013 as the likely point of change in the time series in cases of an
trend to increase. The exception was the total deforestation variable quantified by the PRODES system, where
no point of change was identified.
The results of the statistical analyses can be seen in Figs. 1 and 2, in which the year 2013 presented a change
point, that is, an increase in deforestation. The results show that the deforested area in the Amazonia portion
of the State of Mato Grosso between August 2008 to October 2019 has increased over the 12 years evaluated
(Supplementary Table 1).
Figure 3(A) shows the variation between variables over the time series as a function of the monitoring sys-
tems. It is possible to observe that the PRODES system presented higher variability in the data and statistically
higher means than ImazonGeo in all cases.
According to the data obtained from PRODES, the accumulated deforestation from August 2008 to the end
of 2019 was 1,387,288 hectares, and for the ImazonGeo data, it was 729,204 hectares (Fig. 3B). Thus, when com-
paring the two databases from the Sankey diagram (Fig. 4), PRODES corresponded with the larger deforested
area, with 66%, while ImazonGeo corresponded to 34%.
Soybean area detection analysis points to a total of 1,637,791 ha in 2008/2009, expanding to 4,303,791 ha in
2019/2020 (Supplementary Fig. 1). This finding represented an increase of 2,666,000 ha or a 2.6 times expansion
of the planted area in this short period.
According to the data obtained from the intersect between deforestation and soybean areas, it is evident that
the conversion of forest to soybean areas has increased during the 2008/2009 to 2019/2020 crop seasons (Figs. 5
and 6). In the total time series evaluated by PRODES, 108,411 ha were converted into soybean areas by the
2019/2020 crop season, representing 7.81%. By ImazonGeo, a total of 46,253 ha were transformed into soybean
areas by the 2019/2020 season, representing 6.3% (Supplementary Table 2). The soybean areas accumulated over
the time series in disagreement with SoyM for PRODES and ImazonGeo are shown in Fig. 7.
The evolution of soybeans in disagreement with the SoyM in relation to the area planted with soybeans in
the Mato Grosso Amazonia has increased during the crop years. In 2008/2009, it represented only 0.05% of
deforestation converted into soybean areas, increasing to 2.51% of soybeans in disagreement with the SoyM in
the 2019/2020 crop season, according to data obtained from the relationship between PRODES deforestation and
soybean areas (Supplementary Table 3). The same happened with the relationship obtained with the deforestation
data from ImazonGeo and areas of soybean cultivation. In the 2008/2009 crop season, there were 0.004% of soy-
bean in disagreement with the SoyM and reaching 1.07% in the 2019/2020 crop season (Supplementary Table 3).
The evolution represented by soybean areas in hectares makes it evident that the use of the MODIS/Terra-Aqua
sensor underestimates the monitoring of cultivated areas, in which it can be seen from the 2016/2017 crop year
monitoring with more refined spatial resolution and with the precise detection of areas via MSI (10 m) and OLI
(30 m) sensors in Google Earth Engine. Currently, the soybean areas mapped and refined with the new sensors
and that count as part of this study can be accessed on the website (https://p esqui sa.u
nemat.b
r/g aaf/p
lataf ormas/).
Scientific Reports | (2021) 11:21792 | https://doi.org/10.1038/s41598-021-01350-y 2
Vol:.(1234567890)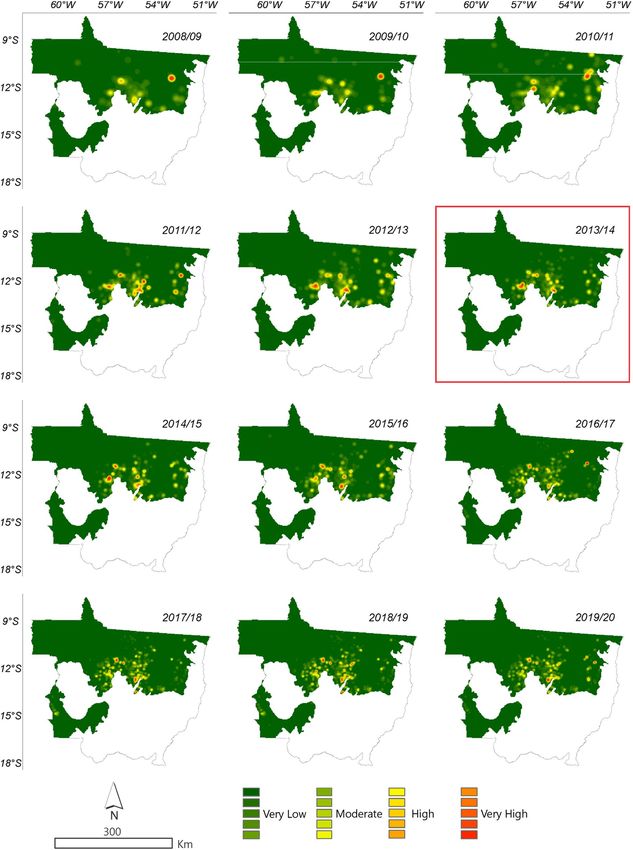
www.nature.com/scientificreports/

                                  Figure 1.  Annual deforestation in the Amazonia biome in the State of Mato Grosso from August 2008 to
                                  October 2019 with PRODES data. The highlighted year corresponds to the point of change in the time series
                                  through Pettitt test (Table 1).

Scientific Reports |   (2021) 11:21792 |              https://doi.org/10.1038/s41598-021-01350-y                                              3

                                                                                                                                        Vol.:(0123456789)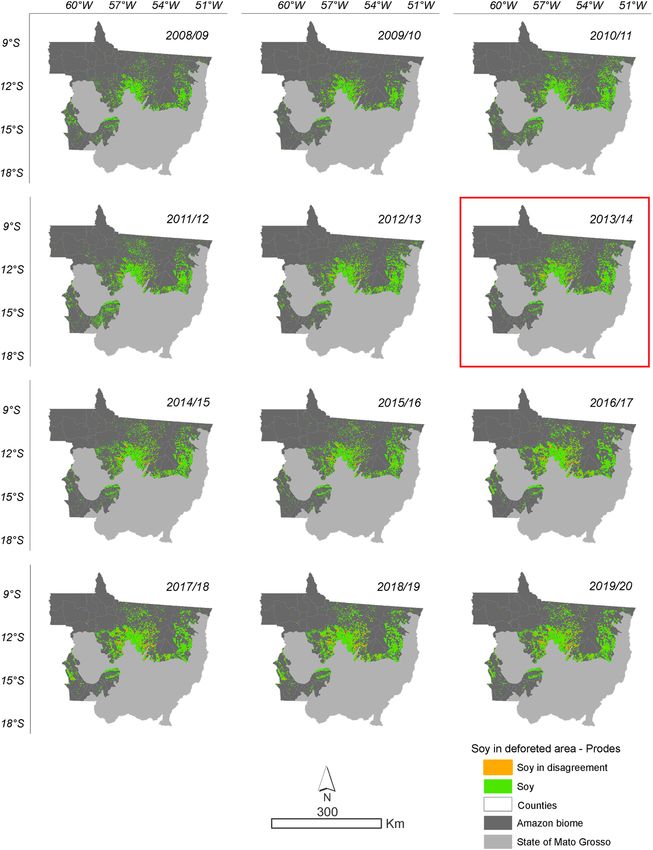
www.nature.com/scientificreports/

                                            Figure 2.  Annual deforestation in the Amazonia biome in the State of Mato Grosso from August 2008 to
                                            October 2019 with data from ImazonGeo. The highlighted year corresponds to the likely point of change in the
                                            time series identified by the Pettitt test (Table 1).

          Scientific Reports |   (2021) 11:21792 |              https://doi.org/10.1038/s41598-021-01350-y                                                 4

Vol:.(1234567890)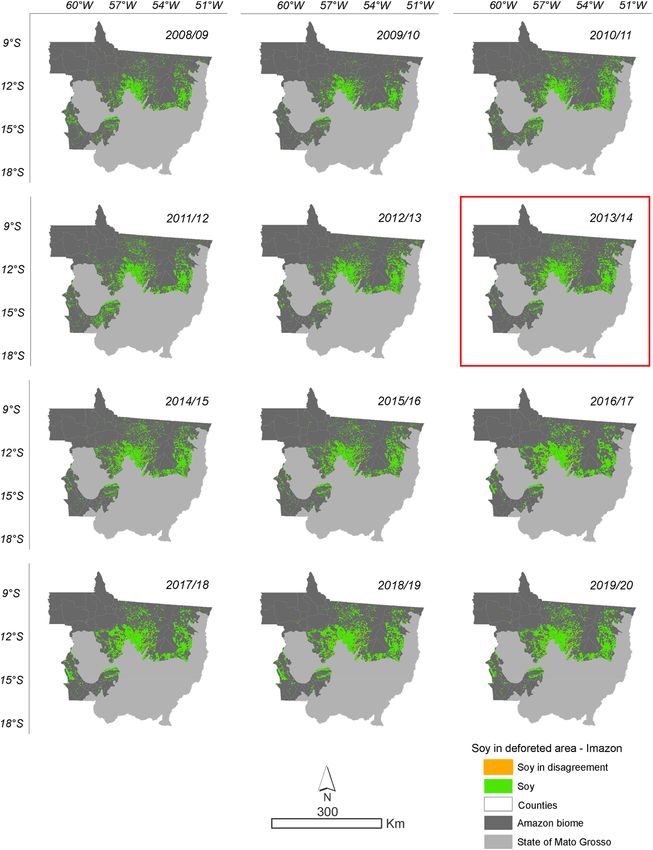
www.nature.com/scientificreports/

                                  Figure 3.  Boxplot for the variables total deforestation, deforestation for soybean planting, total polygons, and
                                  polygons for soybean planting obtained with the Imazon and PRODES monitoring systems (A). Means followed
                                  by different letters in the same figure differ from each other by the t-test at 5% probability and cumulative
                                  deforestation from August 2008–2019 by ImazonGeo and PRODES (B).

Scientific Reports |   (2021) 11:21792 |              https://doi.org/10.1038/s41598-021-01350-y                                                  5

                                                                                                                                            Vol.:(0123456789)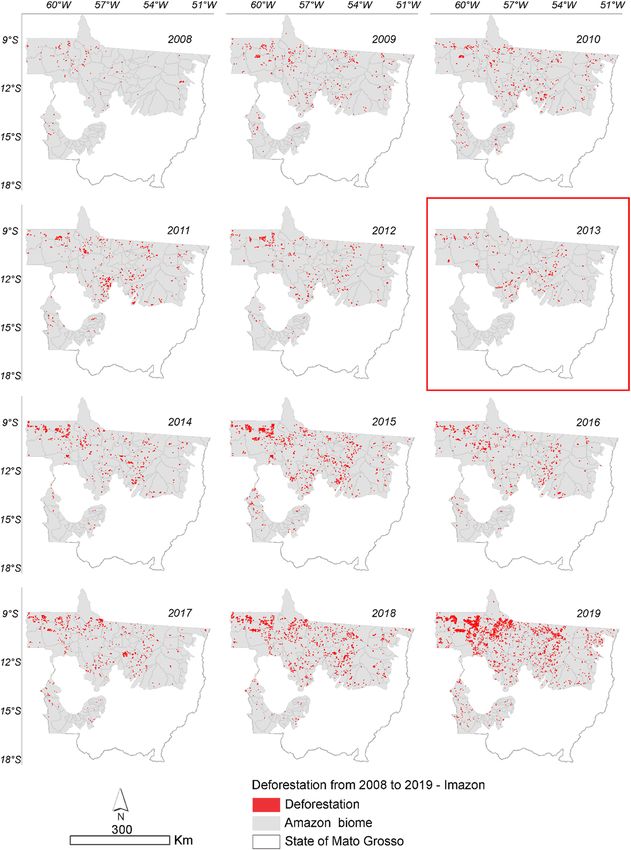
www.nature.com/scientificreports/

                                                     2008

                                                                                                                                       Deforestation
                                                     2009
                                                                                                                                     (ha) ImazonGeo
                                                     2010                                                                                729.204
                                                     2011                                                                                  34%

                                                     2012
                                                     2013

                                                     2014

                                                     2015

                                                                                                                                      Deforestation
                                                     2016
                                                                                                                                      (ha) PRODES
                                                                                                                                        1.387.288
                                                     2017                                                                                  66%

                                                     2018

                                                     2019

                                            Figure 4.  Sankey diagram showing, from the thickness of the lines and similar colors, the flows of deforestation
                                            variation over the years for PRODES and ImazonGeo during August 2008 to October 2019.

                                                Soybean in disagreement with SoyM over the years relative to deforested area to the entire time series went
                                            from 0.07% in 2008 to 7.81% in 2019 for PRODES deforestation, while for ImazonGeo evolved from 0.01% in
                                            2008 to 6.34% in 2019 (Supplementary Table 2).
                                                The municipalities of Feliz Natal, Tabaporã, Nova Ubiratã, and União do Sul present the largest areas in disa-
                                            greement with the SoyM in the analysis with data from PRODES and ImazonGeo (Supplementary Tables 4 and 5).
                                                The municipality of Feliz Natal according to PRODES obtained deforestation of 51,496 ha over the years
                                            evaluated. Of these, 11,169 ha were occupied with soybean in disagreement, representing 21.68% of soybean
                                            over the deforested area. Next is the municipality of Tabaporã with 24,038 ha, of which 9,865 ha were converted
                                            to soybean, equivalent to 41.03% of soybean over deforested area. The first two municipalities with the largest
                                            areas in disagreement with the SoyM according to ImazonGeo data were Feliz Natal, whose deforested area was
                                            36,298 ha and occupied by soybean was 6,157 ha, representing 16.97% of soybean in disagreement with the
                                            SoyM. The second municipality was Nova Ubiratã with 15,697 ha, of which 4,786 were converted to soybean,
                                            representing 30.48% in disagreement with the SoyM.
                                                Supplementary Tables 4 and 5 show the ranking of the first ten municipalities in the State of Mato Grosso
                                            in disagreement with SoyM for PRODES and ImazonGeo data. The first ten municipalities in the ranking in
                                            disagreement with the SoyM for the PRODES data represented 72.12% of the forest areas converted to soybeans
                                            crop. For the ImazonGeo data, the first ten municipalities of the ranking represented 80% of the soybean in
                                            disagreement with the SoyM.
                                                Figures 8 and 9 show the cluster analysis of the municipalities of Mato Grosso based on the data of total
                                            deforestation and deforestation for soybean cultivation obtained by the ImazonGeo and PRODES monitoring
                                            systems, respectively. In both figures, the cluster in red contains the municipalities with the largest areas for the
                                            variables used. The municipalities in common in this group according to both systems were Colniza, Feliz Natal,
                                            Itanhangá, Nova Ubiratã, and Santa Carmem.
                                                Based on the deforestation polygons presented in the maps of Figs. 2 and 3, it was possible to identify the
                                            regions of largest deforestation using the Kernel Density estimator as shown in Figs. 10 and 11.
                                                It can be seen in Figs. 11 and 12 that the deforestation density over the time series is high and very high in all
                                            years evaluated for the PRODES and ImazonGeo data. More intense red and orange shades indicate the occur-
                                            rence of a deforestation hotspot.
                                                Figure 11 shows that in 2008 the region that presented the highest occurrence of deforestation was the
                                            municipality of Marcelândia. In 2009 were Santa Carmem to the south and Cláudia to the north. In 2017, we
                                            found a hotspot areas between the border of the municipalities of Cláudia, Itaúba, and Sinop, between the bor-
                                            der of Apiacás and Paranaíta, and another area in Aripuanã and Colniza. In 2018, União do Sul and Querência
                                            presented the most intense hotspot areas, followed by 2019 with the municipalities of Colniza and Aripuanã.
                                                According to ImazonGeo data (Fig. 12) for deforestation in 2008, the region with the highest occurrence
                                            of deforestation was between the municipality of Canabrava do Norte and São Félix do Araguaia. In 2011 the
                                            municipalities of Nova Ubiratã and Itanhangá were the regions with the highest intensity. In 2012, the municipali-
                                            ties of Alto Boa Vista, Bom Jesus, and Colniza, in 2013 Rondolândia, and in 2014 the municipalities of Colniza,
                                            Juína and Cláudia were the regions with the highest deforestation. By evaluating deforestation for soybean using
                                            the KD estimator, it was also possible to identify the regions of higher occurrences in disagreement with the

          Scientific Reports |   (2021) 11:21792 |               https://doi.org/10.1038/s41598-021-01350-y                                                     6

Vol:.(1234567890)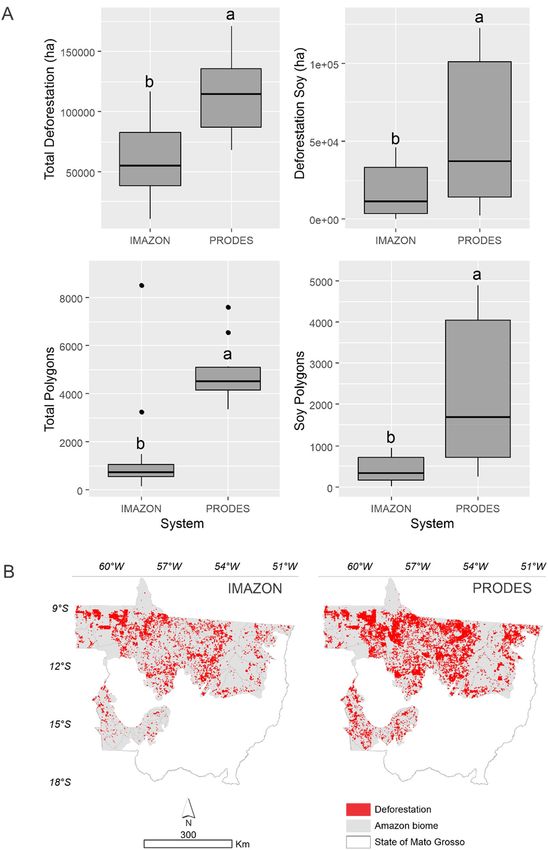
www.nature.com/scientificreports/

                                  Figure 5.  Soybean planted in the deforested area according to PRODES deforestation data. The highlighted
                                  year corresponds to the likely change point in the time series identified by the Pettitt test (Table 1).

Scientific Reports |   (2021) 11:21792 |              https://doi.org/10.1038/s41598-021-01350-y                                              7

                                                                                                                                         Vol.:(0123456789)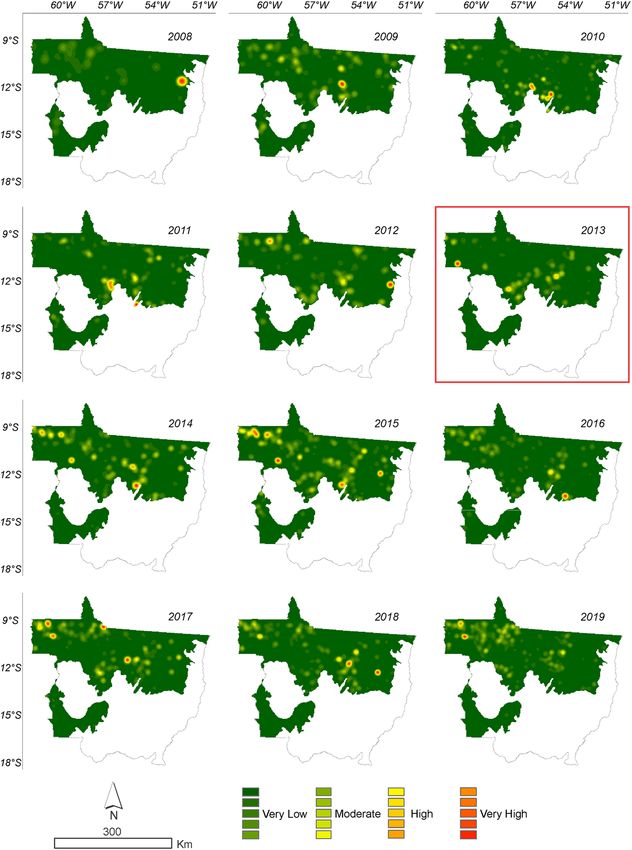
www.nature.com/scientificreports/

                                            Figure 6.  Soybean planted in the deforested area according to ImazonGeo deforestation data. The highlighted
                                            year corresponds to the likely point of change in the time series identified by the Pettitt test (Table 1).

          Scientific Reports |   (2021) 11:21792 |              https://doi.org/10.1038/s41598-021-01350-y                                                 8

Vol:.(1234567890)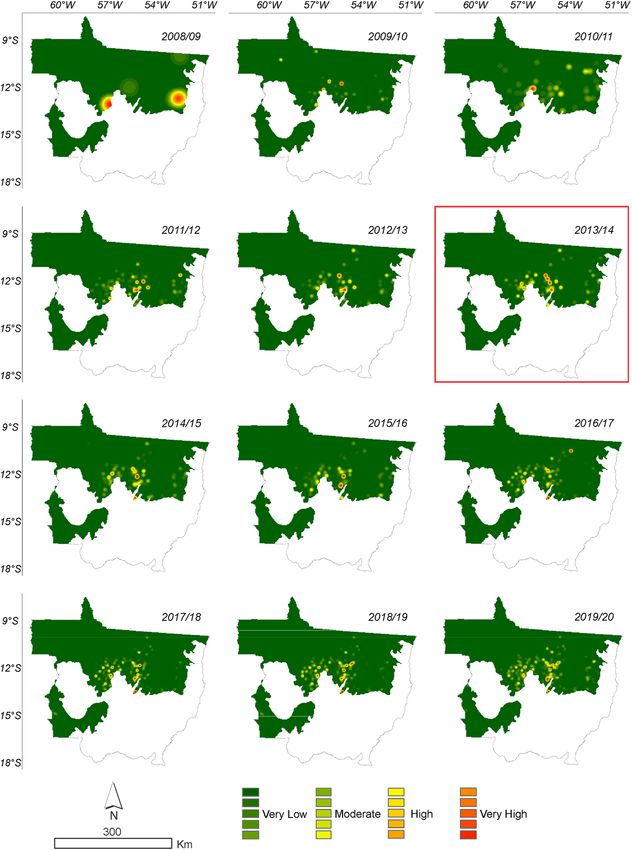
www.nature.com/scientificreports/
Figure 7. Accumulation of soybean planted in deforested area. (A) Soybean planted in deforested area
according to ImazonGeo deforestation data. (B) Soybean planted in deforested area according to PRODES
deforestation data.
SoyM. Figures 12 and 13 show the regions where there were higher conversions of forest to soybean, that is, the
more intense the red and orange tones indicate the occurrence of soybean in disagreement with the moratorium.
In Fig. 12, the municipalities that presented areas of intense occurrence, i.e., hotspots in disagreement with
the SoyM according to the PRODES data in the 2008/2009 and 2009/2010 seasons was São Félix do Araguaia,
followed in the 2010/2011 season in Ipiranga do Norte, Sorriso, and São Félix do Araguaia. In 2015/2016, the
municipalities of intense occurrence that stood out were Tabaporâ, Feliz Natal, and Santa Carmem, followed
by the municipality of São Félix do Araguaia in the 2016/2017 crop season. In the 2017/2018, 2018/2019, and
2019/2020 seasons, the occurrence of soybean areas in disagreement with the moratorium occurred with higher
intensity in the municipalities of Tabaporã, Feliz Natal, Nova Ubiratã, União do Sul, and São Félix do Araguaia.
In Fig. 13 the municipalities that presented areas of hostspots in disagreement with the SoyM according to
ImazonGeo data in the 2008/2009 season were Nova Mutum, Tapurah, Nova Maringá, São José do Rio Claro,
Lucas do Rio Verde, Querência, Ribeirão Cascalheira, and Bom Jesus do Araguaia, followed in the 2009/2010
season by the municipality of Claúdia. In the 2015/2016 season, the municipalities of Santa Carmem and Feliz
Natal stood out, followed by Nova Ubiratã and Peixoto de Azevedo in 2016/2017. In 2017/2018, 2018/2019, and
2019/2020, the municipalities of Nova Ubiratã and Feliz Natal were the most significant.
The data from PRODES and ImazonGeo indicate that the regions of highest deforestation occurrences
throughout the time series for soybean crop are located in the southern and eastern regions of the biome.
Discussion
The State of Mato Grosso is the major commodity producer in Brazil26,27 and has one of the most active deforesta-
tion frontiers in the Amazonia19 due to the global demand for food and biofuels28–30. According to our findings,
deforestation rates in Mato Grosso Amazonia from 2008 to 2019 were 1,386,497 ha for PRODES and 729,204 ha
for ImazonGeo. Of this total, 1.97% of PRODES deforestation data occurred in indigenous lands (ILs) and 0.39%
in conservation units (CUs), while 1.86% occurred in ILs and 0.67% in CUs according to ImazonGeo. One solu-
tion to contain and avoid deforestation was creating the first zero-deforestation agreement in the tropics, the soy
moratorium (SoyM), aiming to prevent the purchase of soybeans produced in deforested areas after 2 00817,31.
However, the soybean area has increased in the State of Mato Grosso over the years. In 2019/2020, soybean
occupied 10,650,421 ha in the State of Mato Grosso24, distributed in three biomes: Cerrado with 6,341,916 ha,
Amazonia with 4,303,791 ha, and Pantanal with only 4,714 ha.
The detection analysis of soybean areas in Amazonia in the State of Mato Grosso point to 1,637,791 ha in
2008/2009, expanding to 4,303,791 ha in 2019/2020. These findings represented an expansion of 2.6 times the
planted area in this short period. Despite soybean farming being one of the driving activities of the economy, the
expansion of its areas implies environmental problems like deforestation, which can occur directly or indirectly
when it occupies pasture areas, pushing the pastures to new a reas12,32–34.
According to PRODES data regarding the soybean area planted in the Mato Grosso Amazonia, between the
2008/2009 season, only 0.05% of the crop occupied newly deforested areas, increasing to 2.51% in the 2019/2020
season, and the largest areas in disagreement with the SoyM were found in the municipalities of Feliz Natal,
Scientific Reports | (2021) 11:21792 | https://doi.org/10.1038/s41598-021-01350-y 9
Vol.:(0123456789)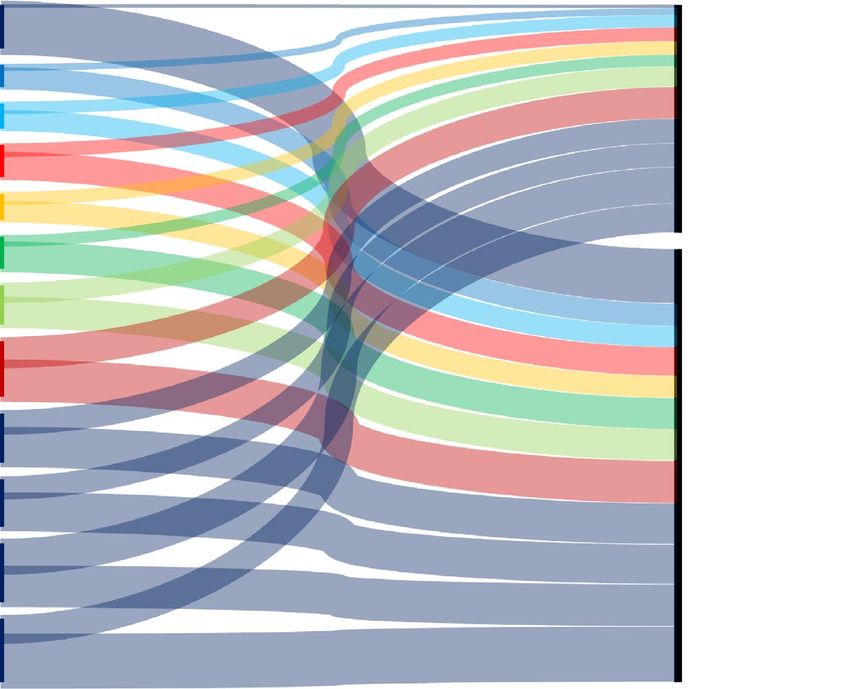
www.nature.com/scientificreports/

                                            Figure 8.  Cluster analysis of the municipalities of Mato Grosso based on the data of total deforestation and
                                            deforestation for soybean cultivation obtained by the PRODES system.

          Scientific Reports |   (2021) 11:21792 |               https://doi.org/10.1038/s41598-021-01350-y                                                 10

Vol:.(1234567890)
www.nature.com/scientificreports/
Figure 9. Cluster analysis of the municipalities of Mato Grosso based on the data of total deforestation and
deforestation for soybean cultivation obtained by the ImazonGeo system.
Scientific Reports | (2021) 11:21792 | https://doi.org/10.1038/s41598-021-01350-y 11
Vol.:(0123456789)www.nature.com/scientificreports/
Figure 10. Annual deforestation density in the Amazonia biome in the State of Mato Grosso from 2008 to 2019
with data from PRODES. The year highlighted by the red square corresponds to the likely change point in the
time series identified by the Pettitt test (Table 1).
Scientific Reports | (2021) 11:21792 | https://doi.org/10.1038/s41598-021-01350-y 12
Vol:.(1234567890)www.nature.com/scientificreports/
Figure 11. Annual deforestation density in the Amazonia biome in the State of Mato Grosso from 2008 to 2019
with data from ImazonGeo. The year highlighted by the red square corresponds to the likely change point in the
time series identified by the Pettitt test (Table 1).
Scientific Reports | (2021) 11:21792 | https://doi.org/10.1038/s41598-021-01350-y 13
Vol.:(0123456789)www.nature.com/scientificreports/
Figure 12. Density of deforestation caused by soybean in Amazonia biome in the State of Mato Grosso from
2008 to 2019 with data from PRODES. The year highlighted with red square corresponds to the likely point of
change in the time series identified by the Pettitt test (Table 1).
Scientific Reports | (2021) 11:21792 | https://doi.org/10.1038/s41598-021-01350-y 14
Vol:.(1234567890)www.nature.com/scientificreports/
Figure 13. Density of deforestation caused by soybean in Amazonia biome in the State of Mato Grosso from
2008 to 2019 with data from ImazonGeo. The year highlighted with red square corresponds to the likely point of
change in the time series identified by the Pettitt test (Table 1).
Scientific Reports | (2021) 11:21792 | https://doi.org/10.1038/s41598-021-01350-y 15
Vol.:(0123456789)www.nature.com/scientificreports/
Tabaporã, Nova Ubiratã, and União do Sul. By the ImazonGeo data, the areas in disagreement evolved from
0.004% to 1.07% and the largest municipalities were Feliz Natal, Nova Ubiratã, União do Sul, and Nova Maringá.
Expectation of new areas at odds with SoyM due to the environmental policies of the Brazilian government is
that they will continue to occur in large soy-producing municipalities due to the high land value and limited
availability of new areas. In municipalities where cattle raising predominates and soy cultivation is still in the con-
solidation phase, deforestation should not occur because there is a large offer of open pasture areas, degraded or
not. When the area of soybean in disagreement in relation to total deforestation is evaluated, it becomes evident
that the conversion of forest to soybean areas has increased from 2008/2009 to 2019/2020. Throughout the time
series evaluated by PRODES, 108,411 ha were converted into soybean areas by 2019/2020 harvest, equivalent
to 7.81%, while by ImazonGeo a total of 46,253 ha were converted into soybean areas by 2019/2020 harvest,
representing 6.3%. Soybean in disagreement with the SoyM in relation to the deforested area throughout the
time series went from 0.07% in 2008 to 7.81% in 2019 for the PRODES deforestation data, while it evolved from
0.01% in 2008 to 6.34% in 2019 for ImazonGeo data.
ima17 reported that soybean occupied 2.54% of the area deforested between August 2015 and
Silva Junior & L
July 2016 by PRODES data. Between 2004 and 2005, soybean resulting from deforestation was 30% falling to 1%
in 201415. These reports suggest that the SoyM was efficient in the early years and continues to be so, despite the
progressive increase in the rates of non-compliant areas verified in this study. The Pettitt test applied to the time
series identified 2013 as the likely point of change in the evaluated time series. This finding corroborates studies
carried out by INPE19, which reported an increase in deforestation from 0.5 million ha in 2012 to 0.7 million ha
in 2017. Environmental policies applied since 2000, such as the expansion of protected areas, creation of real-time
monitoring program (DETER) and the SoyM were not sufficient to contain deforestation from 2013, which can
be justified due to land grabbing and deforestation in rural s ettlements35.
By evaluating time series for deforestation, Gollnow et al.36 found that the year 2013 was a change point
with increasing deforestation trends. The authors also highlight that direct deforestation for soybean crops
decreased after the implementation of SoyM. However, indirect deforestation within the property increased and
has accounted for more than half of the deforestation associated with soybean expansion since 2013. Another
evidence for increased deforestation is that the SoyM does not punish farmers for deforestation on their farms
that are not converted into soybean, which encourages deforestation for other u ses15,36.
Another related factor is the increase in the price appreciation of the soybean bag due to the global demand
for food and b iofuels37. In the 2019/2020 crop season, the soybean bag reached R$ 170.00 (US$ 31.40), similar
to the fat cattle that reached R$ 171.50 in 2019 on the B3 (Official Brazilian Stock Exchange)38. These favorable
market conditions and the lack of enforcement of illegal deforestation may justify the increasing rates of areas
in disagreement with SoyM and deforestation by displacement on the p roperty15,39.
The current government of Jair Bolsonaro is also a concern, as his actions reducing resources for enforcement
agencies and other practices have enabled changes in land use and occupation in Amazonia40. Furthermore, the
government has supported the farmers’ movement, which criticizes SoyM, justifying that the Brazilian Forest
Code is one of the most thorough on the planet, and for this reason, they do not need ONGs overseeing the
sustainability of soybeans. The actions of President Bolsonaro’s government favor the expansion of agriculture in
Amazonia40,41. Possibly the farmers have expectations that current deforestation may be forgiven in the future,
as occurred with the New Forest Code of 2012, which allowed the legalization of land illegally deforested up to
the year 200842.
Most papers assessing deforestation in Amazonia and SoyM made use of PRODES data. Gibbs et al.15, when
evaluating SoyM in Brazil, used deforestation data provided by PRODES. By evaluating the soy moratorium in
the 2016/2017 season in the State of Mato Grosso, Silva Junior & L ima17 used deforestation data also provided by
23
PRODES. Lima et al. , when identifying non-compliant soybean areas in Amazonian states, applied PRODES
deforestation data. Rudorff et al.43 monitored deforested polygons mapped by PRODES to detect non-compliant
soybean fields in municipalities of Amazonian states. West & F earnside44, when evaluating Brazil’s conservation
reform and deforestation, used PRODES data to assess the development of the Action Plan for the Prevention
and Control of Deforestation in the Legal Amazonia. From this perspective, the scientific community considers
PRODES to be the greatest tropical forest monitoring program, and it has been an effective tool for this purpose45.
Few studies have been found referring to ImazonGeo, which is an important system in generating data that
enables analysis by society, assisting in constructing and developing public p olicies46–48. The Mann–Kendall test
results obtained here show a trend for the increase in deforestation over the years evaluated and an increase in
polygons, except for polygons from PRODES. In all cases, the PRODES system presented greater data variability
and statistically higher means than ImazonGeo. PRODES stands out in providing the largest deforested area,
with 66% of deforestation, while ImazonGeo provided 34%. Even if the same sensor system collects the data from
both programs, the methodology applied is different, so it will not have the same values. According to Maretto
et al.49, the PRODES system depends on remote sensing experts to analyze the images from the sensor systems,
which makes it an expensive and temporary task. Initiatives to automate image classification, as developed by
Global Forest Watch and ImazonGeo, were carried out to minimize time and costs, but they were not as efficient
as DETER and PRODES, which achieve accuracy of 90% in the c lassification49,50.
The PRODES monitoring program was identified with the most expressive result in the SoyM evaluation
compared to ImazonGeo. A total deforested area of 1,386,497 ha was identified in the Mato Grosso Amazonia
from August 2008 to 2019 for PRODES, while ImazonGeo identified 729,204 ha. PRODES stood out with the
largest deforested area at 66% and ImazonGeo with 34%.
Even with the differences regarding the results presented in this study, it can be noted that there is a small
percentage of soybean occupying deforested areas compared to the total area of soybean planted in the Mato
Grosso Amazonia, which was 2.54% (PRODES) and 1.07% (ImazonGeo) with an increasing trend throughout
the evaluated time series. Regarding the deforested area to the total of the time series went from 0.07% in 2008
Scientific Reports | (2021) 11:21792 | https://doi.org/10.1038/s41598-021-01350-y 16
Vol:.(1234567890)www.nature.com/scientificreports/
Figure 14. Study area comprising the Mato Grosso Amazonia biome.
to 7.81% in 2019 for the PRODES, and for ImazonGeo evolved from 0.01% in 2008 to 6.34% in 2019. Although
these rates are low, what draws attention is that they have not been maintained over the years but have had a
trend towards increasing, resulting from the public policies of the past and current governments.
Material and methods
Study area. The study area comprised the Amazonia biome in the State of Mato Grosso, located between
09º00’ to 18º00’S and 49º00’ to 61º00’W (Fig. 14). All the municipalities belonging to the Amazonia biome in the
State were evaluated, covering an area of approximately 661 thousand km2 and encompassing 92 municipalities.
Big data of spectral indices in soybean detection. The temporal intervals were selected based on the
agricultural calendar of soybean cultivation in the State of Mato Grosso through the Google Earth Engine (GEE)
platform51 for crop seasons from 2008/2009 to 2019/2020. A large amount of orbital data was used to perform
the calculations of the PCEI index (Perpendicular Crop Enhancement Index—Eq. 1), developed by Silva Junior
et al.20,21. The PCEI index uses reflectance factor values centered on the red and near-infrared wavelengths, rang-
ing from -1 to 1, which allows for significant positive differences between the maximum and minimum observed
in soybean crop phenology. For this purpose, we used the MODIS (Moderate Resolution Imaging Spectroradi-
ometer), product MOD13Q1 V6 (MOD13Q1.006 Terra VegetationIndices 16-Day Global 250 m – Image Col-
lection ID MODIS/006/MOD13Q1 and sur_refl_b01 (Red surface reflectance, 645 nm) and sur_refl_b02 (NIR
surface reflectance, 858 nm)).
Max ρIVP√−aρV2 −b + S − Min ρIVP√−aρV2 −b + S
1+a 1+a
PCEI = g ·
(1)
Max ρIVP√−aρV2 −b + S + Min ρIVP√−aρV2 −b + S
1+a 1+a
wherein MaxPVI—maximum PVI value observed in the period of maximum soybean development; MinPVI—
minimum PVI value observed in the pre-sowing and/or emergence period; S—enhancement coefficient ( 102);
g—gain factor ( 102).
For the initial crop seasons, only the MODIS/Earth-Aqua sensor was used in an automated way in GEE, and
from the crop season 2016/2017 on, we started the combination between MODIS, OLI (Landsat-8), and MSI
(Sentinel-2) sensors. With the advancement of these sensors, we could further refine the soybean spatializa-
tion data due to the spatial resolution. The collections used in the combination of sensors were: USGS Landsat
8 Collection 1 Tier 1 and Real-Time data TOA Reflectance—LANDSAT/LC08/C01/T1_RT_TOA / B4 (Red,
0.64—0.67 µm) and B5 (Near infrared, 0.85—0.88 µm); and MultiSpectralInstrument, Level-1C—COPERNICUS/
S2 / B4 (Red, 664.5 nm (S2A) / 665 nm (S2B)) and B8 (NIR, 835.1 nm (S2A) / 833 nm (S2B)). All medium-spatial
resolution sensors used 20% of the pixel percentage clouds. In order to facilitate the process of separating the
images and automating the crop monitoring, no specific date was used for each minimum and maximum PVI
value. Instead, a period referring to a particular soybean stage was used, whereby only one image was generated
with the best pixels from the images found in the stipulated time intervals by using .filterDate() and median()
in the JavaScript language.
Deforested areas data. Regarding deforestation data, PRODES (Legal Amazonia Deforestation Moni-
toring System) which provides annual deforestation estimates since 1988 based on Landsat satellite images at
30 m resolution with a minimum mapped area of 6.25 h ectares52,53 and SAD/ImazonGeo data that uses MODIS
Scientific Reports | (2021) 11:21792 | https://doi.org/10.1038/s41598-021-01350-y 17
Vol.:(0123456789)www.nature.com/scientificreports/
images at 250 m resolution to detect areas larger than 10 hectares with subsequent validation on Landsat (30 m
pixel) and CBERS (20 m pixel) satellite images54 were used to obtain the time series between August 2008 (Soy
Moratorium agreement) until the year 2019. Then, the junctions of deforested areas in these years were carried
out to verify the areas (polygons) converted from forest-soybean for all the municipalities belonging to the Ama-
zonia biome in the State of Mato Grosso. All data were calculated using the South America Albers Equal Area
Conic cartographic projection.
Statistical analyses. Initially, boxplots were created to show the variation of the variables evaluated over
the time series. A t-test was applied to compare the means of each monitoring system for each variable. The
Mann–Kendall test was applied to verify the trend of the variables over the time series, followed by the Pettitt test
to identify the likely point of change when the trend is significant. In all cases, a 5% probability level was adopted
for the statistical tests performed.
Pettitt and Mann–Kendall tests. To identify trends over the time series (from August 2008–2019) of each vari-
able, the Pettitt test was used. This non-parametric test allows confirmation of the stationarity of the historical
series, i.e., observations are invariant concerning the chronology of their occurrences, except for random fluc-
tuations.
Pettitt test locates the point at which an abrupt change in the mean of a time series occurred, and its signifi-
cance was calculated by Eq. (2).
2
∼ 2 exp
−6k(T)
p=
(2)
T3 + T2
The point of abrupt change is T, where the maximum of k(t) occurs. The critical values of k are given by
Eq. (3).
p
− ln 2 T 3 + T 2
kcrit = ± (3)
6
To analyze the time series trend of the aforementioned variables, the Mann–Kendall test will be applied
(Mann, 1945; Kendall, 1975) (Eq. 4).
S−1
Zmk = √ ; when S > 0
Var(S)
Zmk = 0; when S = 0 (4)
S+1
Zmk = √ ; when S < 0
Var(S)
wherein Zmk is the Z-index of the Mann–Kendall test; S is the "score" statistic, and Var (S) is the variance of the
S statistic.
Sankey diagram. Sankey diagrams, which act as a visual accounting system between two or more variables hav-
ing a starting point and at least one ending point illustrating the flows, were constructed. The thickness of each
line is proportional to the flow magnitude55–57. In this way, it allows the deforestation flow to be verified year by
year for the PRODES and ImazonGeo monitoring programs.
Cluster analysis. Ward’s hierarchical agglomerative algorithm (1963) was used, with the average Euclidean
distance as the measure of dissimilarity58,59.
Clusters were generated using the total deforestation data (area in ha) and deforestation for soybean cultiva-
tion (area in ha) from each monitoring system. The Euclidean distance and Ward’s hierarchical method were
used for this purpose. All analyses were performed on the R software using the packages “ggplot2”, “trend”,
“ManKendall”, and “factoextra”.
Kernel density. All the annual series of deforestation data and soybean substituting native forest, among the
public data, were submitted to the use of the Kernel Density (KD) estimator to identify the cities/regions with
the highest occurrences of deforestation and in disagreement with the Soy M oratorium60, obtained by Eq. (5):
n
1 x − Xi
fˆh (x) = K (5)
nh h
i=1
wherein K is the Kernel function K(s) ds = 1; h is the search radius; x is the position of the center of each cell
in the output raster; Xi is the position of point i coming from the centroid of each polygon; and n is the total
number of fire foci.
Scientific Reports | (2021) 11:21792 | https://doi.org/10.1038/s41598-021-01350-y 18
Vol:.(1234567890)www.nature.com/scientificreports/
Received: 24 May 2021; Accepted: 27 October 2021
References
1. Fearnside, P. M. Greenhouse gases from deforestation in Brazilian Amazonia: Net committed emissions. Clim. Change 35, 321–360
(1997).
2. Falkowski, P. The global carbon cycle: A test of our knowledge of earth as a system. Science (80-) 290, 291–296 (2000).
3. Cardille, J. Agricultural land-use change in Brazilian Amazônia between 1980 and 1995: Evidence from integrated satellite and
census data. Remote Sens. Environ. 87, 551–562 (2003).
4. Aragao, L. E. O. C. & Shimabukuro, Y. E. The incidence of fire in Amazonian forests with implications for REDD. Science (80-)
328, 1275–1278 (2010).
5. Oliveira, L. J. C., Costa, M. H., Soares-Filho, B. S. & Coe, M. T. Large-scale expansion of agriculture in Amazonia may be a no-win
scenario. Environ. Res. Lett. 8, 24021 (2013).
6. Coutinho, L. Biomas brasileiros (2016).
7. Barnes, A. D. et al. Direct and cascading impacts of tropical land-use change on multi-trophic biodiversity. Nat. Ecol. Evol. 1,
1511–1519 (2017).
8. Soares-Filho, B. S. et al. Modelling conservation in the Amazon basin. Nature 440, 520–523 (2006).
9. Sampaio, G. et al. Regional climate change over eastern Amazonia caused by pasture and soybean cropland expansion. Geophys.
Res. Lett. 34, 30612 (2007).
10. Nobre, C. A. & Borma, L. D. S. `Tipping points’ for the Amazon forest. Curr. Opin. Environ. Sustain. 1, 28–36 (2009).
11. (MMA), M. D. M. A. Componente Projeto Alternativas ao Desmatamento e às Queimadas. (2019).
12. Pendrill, F. et al. Agricultural and forestry trade drives large share of tropical deforestation emissions. Glob. Environ. Change 56,
1–10 (2019).
13. Goldman, E. D., Weisse, M., Harris, N. & Schneider, M. Estimating the role of seven commodities in agriculture-linked deforesta-
tion: Oil palm, soy, cattle, wood fiber, cocoa, coffee, and rubber. WRI Publ. https://doi.org/10.46830/writn.na.00001 (2020).
14. MPF Ministério Público Federal. Para Divulgar Termo de Ajustamento de Conduta Bertin assinado (TAC) (2009).
15. Gibbs, H. K. et al. Brazil’s Soy Moratorium. Science (80-) 347, 377–378 (2015).
16. Gibbs, H. K. et al. Did Ranchers and Slaughterhouses Respond to Zero-Deforestation Agreements in the Brazilian Amazon?.
Conserv. Lett. 9, 32–42 (2015).
17. Silva, C. A. & Lima, M. Soy Moratorium in Mato Grosso: Deforestation undermines the agreement. Land Use Policy 71, 540–542
(2018).
18. IMAZON, I. D. H. E. M. A. D. A.-. Sistema de Alerta de Desmatamento. https://imazongeo.org.br/#/ (2020).
19. Terra, I. P.-C.-G. de O. da. Monitoramento do Desmatamento da Floresta Amazônica Brasileira por Satélite (2021).
20. da Silva, C. A., Nanni, M. R., Teodoro, P. E. & Silva, G. F. C. Vegetation indices for discrimination of soybean areas: A new approach.
Agron. J. 109, 1331–1343 (2017).
21. da Silva Junior, C. A. et al. Mapping soybean planting area in midwest Brazil with remotely sensed images and phenology-based
algorithm using the Google Earth Engine platform. Comput. Electron. Agric. 169, 105194 (2020).
22. Huete, A. R. et al. Amazon rainforests green-up with sunlight in dry season. Geophys. Res. Lett. 33, 25583 (2006).
23. Lima, M., da Silva Junior, C. A., Rausch, L., Gibbs, H. K. & Johann, J. A. Demystifying sustainable soy in Brazil. Land Use Policy
82, 349–352 (2019).
24. SOJAMAPS. Geotecnologia Aplicada em Agricultura e Floresta (GAAF). Monitoramento de áreas de soja por meio de imagens de
Satélite https://pesquisa.unemat.br/gaaf/plataformas/ (2020).
25. Atzberger, C. Advances in remote sensing of agriculture: Context description, existing operational monitoring systems and major
information needs. Remote Sens. 5, 949–981 (2013).
26. Kastens, J. H., Brown, J. C., Coutinho, A. C., Bishop, C. R. & Esquerdo, J. C. D. M. Soy moratorium impacts on soybean and
deforestation dynamics in Mato Grosso, Brazil. PLoS ONE 12, e0176168 (2017).
27. Picoli, M. C. A. et al. Big earth observation time series analysis for monitoring Brazilian agriculture. ISPRS J. Photogramm. Remote
Sens. 145, 328–339 (2018).
28. Laurance, W. F., Sayer, J. & Cassman, K. G. Agricultural expansion and its impacts on tropical nature. Trends Ecol. Evol. 29, 107–116
(2014).
29. Newbold, T. et al. Global effects of land use on local terrestrial biodiversity. Nature 520, 45–50 (2015).
30. Becknell, J. M. et al. Landscape-scale lidar analysis of aboveground biomass distribution in secondary Brazilian Atlantic Forest.
Biotropica 50, 520–530 (2018).
31. Nepstad, L. S. et al. Pathways for recent Cerrado soybean expansion: extending the soy moratorium and implementing integrated
crop livestock systems with soybeans. Environ. Res. Lett. 14, 44029 (2019).
32. Barona, E., Ramankutty, N., Hyman, G. & Coomes, O. T. The role of pasture and soybean in deforestation of the Brazilian Amazon.
Environ. Res. Lett. 5, 24002 (2010).
33. Martinelli, L., Batistella, M., Silva, R. & Moran, E. Soy expansion and socioeconomic development in municipalities of Brazil. Land
6, 62 (2017).
34. Mammadova, A., Behagel, J. & Masiero, M. Making deforestation risk visible. Discourses on bovine leather supply chain in Brazil.
Geoforum 112, 85–95 (2020).
35. Moutinho, P., Guerra, R. & Azevedo-Ramos, C. Achieving zero deforestation in the Brazilian Amazon: What is missing?. Elem.
Sci. Anthr. 4, 125 (2016).
36. Gollnow, F., de Barros Viana Hissa, L., Rufin, P. & Lakes, T. Property-level direct and indirect deforestation for soybean production
in the Amazon region of Mato Grosso, Brazil. Land Use Policy 78, 377–385 (2018).
37. Assunção, J., Gandour, C. & Rocha, R. Deforestation slowdown in the Brazilian Amazon: prices or policies?. Environ. Dev. Econ.
20, 697–722 (2015).
38. Rural, C. Em 2020, milho é vendido a ‘preço de soja’ e soja é vendida a ‘preço de boi’; entenda os motivos. https://www.canalrural.
com.br/noticias/milho-preco-de-soja-soja-preco-de-boi/ (2020).
39. Azevedo, A. A., Stabile, M. C. C. & Reis, T. N. P. Commodity production in Brazil: Combining zero deforestation and zero illegality.
Elem. Sci. Anthr. 3, 76 (2015).
40. Ferrante, L. & Fearnside, P. M. Brazil’s new president and ‘ruralists’ threaten Amazonia’s environment, traditional peoples and the
global climate. Environ. Conserv. 46, 261–263 (2019).
41. APROSOJA. Governo alega ameaça à soberania nacional e apoia fm da Moratória da Soja. Associação dos Produtores de Soja
e Milho do Estado de Mato Grosso http://www.aprosoja.com.br/comunicacao/noticia/governo-alega-ameaca-a-soberania-nacio
nal-e-apoia-fim-da-moratoria-da-soja (2019).
42. Soares-Filho, B. et al. Cracking Brazil’s forest code. Science (80-) 344, 363–364 (2014).
43. Rudorff, B. F. T. et al. Remote sensing images to detect soy plantations in the amazon biome: The soy moratorium initiative. Sus-
tainability 4, 1074–1088 (2012).
Scientific Reports | (2021) 11:21792 | https://doi.org/10.1038/s41598-021-01350-y 19
Vol.:(0123456789)www.nature.com/scientificreports/
44. West, T. A. P. & Fearnside, P. M. Brazil’s conservation reform and the reduction of deforestation in Amazonia. Land Use Policy
100, 105072 (2021).
45. Kintisch, E. CARBON EMISSIONS: Improved monitoring of rainforests helps pierce haze of deforestation. Science (80-) 316,
536–537 (2007).
46. Finer, M. et al. Combating deforestation: From satellite to intervention. Science (80-) 360, 1303–1305 (2018).
47. Escada, M. I. S. E. M. D. R. S. amaral; D. de M. V. Avaliação de dados dos Sistemas de Alerta da Amazônia: DETER e SAD.
2934–2943 (2011).
48. Sá, C. & Grieco, J. Open data for science, policy, and the public good. Rev. Policy Res. 33, 526–543 (2016).
49. Maretto, R. V. et al. Spatio-temporal deep learning approach to map deforestation in Amazon rainforest. IEEE Geosci. Remote Sens.
Lett. 18, 771–775 (2021).
50. Hansen, M. C. et al. High-resolution global maps of 21st-century forest cover change. Science (80-) 342, 850–853 (2013).
51. Gorelick, N. et al. Google Earth Engine: Planetary-scale geospatial analysis for everyone. Remote Sens. Environ. 202, 18–27 (2017).
52. Kalamandeen, M. et al. Pervasive rise of small-scale deforestation in Amazonia. Sci. Rep. 8, 1600 (2018).
53. Lobo, F. L., Costa, M., Novo, E. M. L. M. & Telmer, K. Distribution of artisanal and small-scale gold mining in the Tapajós River
Basin (Brazilian Amazon) over the past 40 years and relationship with water siltation. Remote Sens. 8, 579 (2016).
54. Souza, C. M., Pereira, K., Lins, V., Haiashy, S. & Souza, D. Web-oriented GIS system for monitoring, conservation and law enforce-
ment of the Brazilian Amazon. Earth Sci. Inform. 2, 205 (2009).
55. Riehmann, P., Hanfler, M. & Froehlich, B. Interactive Sankey diagrams. In {IEEE} symposium on information visualization, 2005.
{INFOVIS} 2005. (IEEE). https://doi.org/10.1109/infvis.2005.1532152.
56. Bajželj, B. et al. Importance of food-demand management for climate mitigation. Nat. Clim. Chang. 4, 924–929 (2014).
57. Perez, G. J., Comiso, J. C., Aragones, L. V., Merida, H. C. & Ong, P. S. Reforestation and deforestation in Northern Luzon, Philip-
pines: Critical issues as observed from space. Forests 11, 1071 (2020).
58. Everitt, B. S., Dunn, G. Applied multivariate data analysis (1991).
59. Teodoro, P. E. et al. Path analysis in soybean genotypes as function of growth habit. Biosci. J. 31, 794–799 (2015).
60. Smith, M. De J., Goodchild, M. F., Longley, P. A. Geospatial analysis—A comprehensive guide to principles, techniques, and
software tools. 748 (2015).
Acknowledgements
The authors would like to thank the PRODES of the National Institute for Space Research (INPE), and the SAD/
ImazonGeo of the Instituto do Homem e Meio Ambiente da Amazônia (IMAZON). This study was financed in
part by the Coordenação de Aperfeiçoamento de Pessoal de Nível Superior—Brasil (CAPES)—Finance Code
001, National Council for Research and Development (CNPq), and Federal University of Mato Grosso do Sul
(UFMS). We are also thank to the research laboratories of State University of Mato Grosso (UNEMAT), and
State University of São Paulo (UNESP). This is a research derived from the first author’s degree in the graduate
program in Biodiversity and Amazonian Agroecosystems (PPGBioAgro/UNEMAT). Thanks to CNPq (National
Center for Scientific and Technological Development) for the financial support of the research project/MCTI/
CNPQ/Universal—433386/2018-5.
Author contributions
T.L and C.A.S.J collected the data. T.L, C.A.S.J and M.L. produced a draft of the manuscript. C.A.S.J., P.E.T. and
L.P.R.T. performed all statistical analyses. T.D.P., R.G.S., I.M.L. and F.S.R. contributed with a critical review of
the manuscript. All authors read and approved the final manuscript.
Competing interests
The authors declare no competing interests.
Additional information
Supplementary Information The online version contains supplementary material available at https://doi.org/
10.1038/s41598-021-01350-y.
Correspondence and requests for materials should be addressed to P.E.T.
Reprints and permissions information is available at www.nature.com/reprints.
Publisher’s note Springer Nature remains neutral with regard to jurisdictional claims in published maps and
institutional affiliations.
Open Access This article is licensed under a Creative Commons Attribution 4.0 International
License, which permits use, sharing, adaptation, distribution and reproduction in any medium or
format, as long as you give appropriate credit to the original author(s) and the source, provide a link to the
Creative Commons licence, and indicate if changes were made. The images or other third party material in this
article are included in the article’s Creative Commons licence, unless indicated otherwise in a credit line to the
material. If material is not included in the article’s Creative Commons licence and your intended use is not
permitted by statutory regulation or exceeds the permitted use, you will need to obtain permission directly from
the copyright holder. To view a copy of this licence, visit http://creativecommons.org/licenses/by/4.0/.
© The Author(s) 2021
Scientific Reports | (2021) 11:21792 | https://doi.org/10.1038/s41598-021-01350-y 20
Vol:.(1234567890)You can also read