Africa Mini-grid Developers Association - Overview, Financing & Policy Recommendation - Clean Energy ...

Page created by Herman Nelson
 
CONTINUE READING
Africa Mini-grid Developers Association - Overview, Financing & Policy Recommendation - Clean Energy ...
Africa Mini-grid Developers
        Association
 Overview, Financing & Policy Recommendation

          Aaron Leopold, CEO, AMDA
Africa Mini-grid Developers Association - Overview, Financing & Policy Recommendation - Clean Energy ...
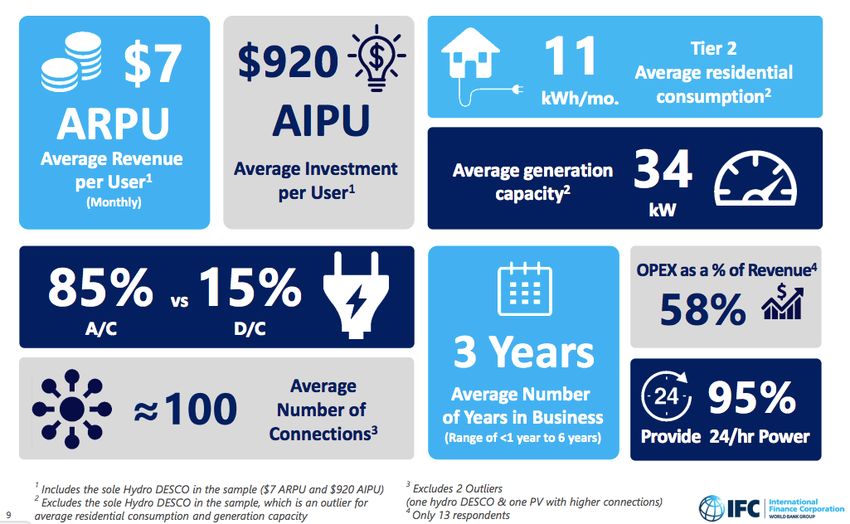
Utility Realities in Africa
     • Sub-Saharan governments contribute less than 25% of their power sector
       spending – the rest is donor subsidies

     • As of 2016, only 2 countries in Africa fully recovering their operational and
       capital costs

     • As of 2016, 19 countries in Africa are able to cover operation costs. Only 4
       were also covering half or more of capital costs

     • These gaps prevent power sectors from delivering reliable electricity, let
       alone expand supply adequately
https://www.icafrica.org/fileadmin/documents/IFT_2016/Infrastructure_Financing_Trends_2016.pdf
https://openknowledge.worldbank.org/bitstream/handle/10986/25091/108555.pdf?sequence=10&isAllowed=y
Africa Mini-grid Developers Association - Overview, Financing & Policy Recommendation - Clean Energy ...
Mini-Grid Pipeline Potential in Africa
Scaled Deployment of MG’s Across Africa
                                                                                 IMPACT
                         (Main-Grid Parity)
                           Fast Approval Process in       Transparency on
     Project Level           all AMDA Countries &        Performance and
                                                                                OUTCOMES
   Concessional Debt       Framework for Profitable    Challenges - Improved
                                    MG's              Decision Making Process

      Scaled up MG           Adaptation of Policy
                                                         Sector Information     OUTPUTS
       Deployment                Priorities

        FUNDING
                                     POLICY                    DATA
RBF Financing              - Policy Makers                                       AMDA
Private Sector Equity      - Donor community          Revenue         Power
                                                      Connections     Cost       INPUTS
Development financiers     - Other Stakeholders
Summer 2018 IFC Global Mini-Grid Data
                                        • Average revenue per
                                          user is only $84 –
                                          this is why utilities
                                          have avoided rural
                                          areas to date.

                                        • Promoting local
                                          socio-economic
                                          growth requires
                                          more OPEX, and
                                          higher quality
                                          service than utilities
                                          provide.
Project-level public support for mini-grids in
      rural TZ and KE (2011-PRESENT)

   Donor
                ACP         EEP        UNCDF       Undisclosed                      Equity                     TOTAL CAPEX
  Support
  Amount
Provided to   $ 350,000   $925,000   $124,000.00      $40,000                    $7,760,000                         $9,200,000
    date

       This represents only 14% of total project-level
       funding for mini-grids in two of the most well
       understood and donor supported markets in Africa
                                                   *Total CAPEX costs are for Solar PV & Bio Gas only
                                                   ** Includes Project data for Engie, PowerGen, Ensol, SteamaCo,
                                                   RVE.Sol, Jumeme, Rafiki Power (excludes Powerhive)
Minigrid costs are reducing as the sector
   scales
4500
                                                                                • Significant cost reduction as #
4000
                                                                                  of connections increase
3500

3000                                                                            • 2017 – Cost per Connection
2500
                                                                                  $1163

2000

                                                                                • 2018 – Cost per Connection
                                                                                  $934
1500

1000

 500
                                                                                • 2020 – Estimated Cost per
  0                                                                               connection – $600-$700
       2014   2015                      2016                      2017   2018
                     CAPEX per connection      # of Connections
Kenya and Tanzania - AMDA Pipeline
                                             Number of Sites under           If finance for AMDA’s
   Estimated Number of                                                       existing pipeline comes
                                                development
       Connections                                                           through, we are on
                                                                             track to connect
                                                                      786
                                                                             1,000,000 people by the
                            187,718                                          end of 2020.

                                                                             REA in Tanzania
                                                          390
                                                                             currently connects
                   86,870                                                    50,000 people per
          61,370
                                                                             annum (150,000 out to
                                      200       196                          2020).
 39,478

 2018     2019     2020     TOTAL     2018     2019      2020        TOTAL
KENYA & TANZANIA Financing Gap
                   2018     2019       2020

     65,317,838

                                                 65,317,838

     45,730,669

                                                 37,962,224

     54,307,922               -
                          7,768,445
                                                 31,582,645
                          22,725,277

 ESTIMATED CAPEX   FINANCE SECURED            FINANCING GAP
You can also read