AHMOSE: A KNOWLEDGE-BASED VISUAL SUPPORT SYSTEM FOR SELECTING REGRESSION MACHINE LEARNING MODELS - ARXIV
←
→
Page content transcription
If your browser does not render page correctly, please read the page content below
© 2021.This manuscript version is made available under the CC-BY-NC-ND 4.0 license https://creativecommons.org/licenses/by-nc-nd/4.0/

                                                        AHMoSe: A Knowledge-Based Visual Support System for
                                                           Selecting Regression Machine Learning Models

                                                           Diego Rojoa,∗, Nyi Nyi Htuna , Denis Parrab,c , Robin De Croona , Katrien Verberta
                                                                            a Department of Computer Science, KU Leuven, Leuven, Belgium
arXiv:2101.11970v2 [cs.HC] 30 Nov 2021

                                                               b Department of Computer Science, Pontificia Universidad Catolica de Chile, Santiago, Chile
                                                                         c Millennium Institute Foundational Research on Data, Santiago, Chile

                                                        Abstract
                                                        Decision support systems have become increasingly popular in the domain of agricul-
                                                        ture. With the development of automated machine learning, agricultural experts are
                                                        now able to train, evaluate and make predictions using cutting edge machine learning
                                                        (ML) models without the need for much ML knowledge. Although this automated ap-
                                                        proach has led to successful results in many scenarios, in certain cases (e.g., when few
                                                        labeled datasets are available) choosing among different models with similar perfor-
                                                        mance metrics is a difficult task. Furthermore, these systems do not commonly allow
                                                        users to incorporate their domain knowledge that could facilitate the task of model se-
                                                        lection, and to gain insight into the prediction system for eventual decision making. To
                                                        address these issues, in this paper we present AHMoSe, a visual support system that
                                                        allows domain experts to better understand, diagnose and compare different regression
                                                        models, primarily by enriching model-agnostic explanations with domain knowledge.
                                                        To validate AHMoSe, we describe a use case scenario in the viticulture domain, grape
                                                        quality prediction, where the system enables users to diagnose and select prediction
                                                        models that perform better. We also discuss feedback concerning the design of the tool
                                                        from both ML and viticulture experts.
                                                        Keywords: Decision Support System, Visual Analytics, Explainable AI, Automated
                                                        Machine Learning

                                                        1. Introduction

                                                            Decision support systems (DSSs) are often used in places that call for domain ex-
                                                        perts to deal with massive amounts of data. In the field of agriculture, for example,
                                                        various stakeholders such as farmers, advisers and policymakers tend to use DSSs to
                                                        facilitate farm management and planning tasks [1]. Typically, data is first gathered

                                                           ∗ Correspondingauthor
                                                            Email addresses: diego.rojogarcia@kuleuven.be (Diego Rojo), nyinyi.htun@kuleuven.be
                                                        (Nyi Nyi Htun), dparra@ing.puc.cl (Denis Parra), robin.decroon@kuleuven.be (Robin De Croon),
                                                        katrien.verbert@kuleuven.be (Katrien Verbert)

                                                        This is a manuscript version of an article published in Computers and Electronics in
                                                        Agriculture, available at: https://doi.org/10.1016/j.compag.2021.106183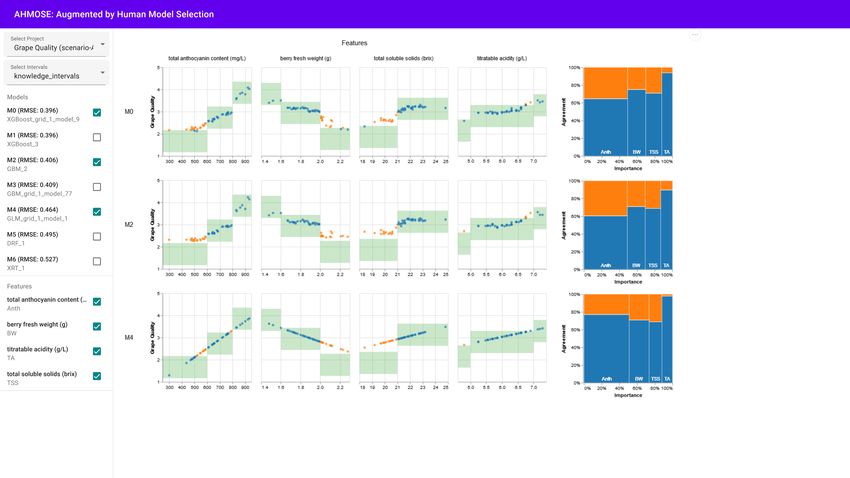
© 2021.This manuscript version is made available under the CC-BY-NC-ND 4.0 license https://creativecommons.org/licenses/by-nc-nd/4.0/

               from multiple sources including sensors, satellites and in-field observations, and anal-
               ysed using a series of statistical models. The output of such an analysis is finally used
               for the required decision making task.
                   Recent popularity and success of machine learning (ML) has also led to an in-
               creased use of off-the-shelf ML systems that can be used by domain experts with little
               to no machine learning knowledge. Examples include agricultural experts employing a
               variety of graphical user interfaces (GUIs) to predict yield, revenue, resource require-
               ments, etc. [1]. To support such use cases, the field of automated machine learning
               (AutoML) has elaborated several solutions that automate the ML pipeline such as fea-
               ture engineering [2, 3], hyperparameter optimisation [4] or neural networks architecture
               search [5]. After receiving an input dataset, an AutoML system builds and evaluates
               (usually hundreds of) different prediction models, presenting the user with a leader
               board with the models ordered by their performance score. Several AutoML products
               such as H2O Driverless AI [6] provide a GUI to enable end-users to input a dataset and
               configure parameters of the AutoML process, such as the time or the model’s families
               to consider. All these advances have empowered non-technical users to train and make
               predictions using cutting edge machine learning models.
                   Unfortunately, there are still several challenges to using these AutoML systems.
               One such challenge is related to the interpretation and selection of models that have
               very similar performance scores. A good heuristic is choosing the simplest model
               among those models performing similarly well, for instance the model with fewer pa-
               rameters [7]. However, even this task can be difficult if the simplest model is not
               aligned with experts’ knowledge, i.e., if the features that contribute the most to the
               model predictive performance are not aligned with experts’ knowledge. Gil et al. [8]
               suggested that the use of supplementary information extracted from domain knowledge
               of the experts is a potential strategy to evaluate and select a model. Such supplementary
               information includes rules defined by domain experts for knowledge-based DSSs (e.g.,
               fuzzy inference systems [9]). Enabling users to incorporate domain knowledge into
               the model assessment and selection process of AutoML systems could help diagnose
               models that struggle to generalise and identify the ones that agree with domain expert
               knowledge.
                   Another challenge of using AutoML as DSSs is their inherent lack of transparency.
               The models employed to date for agricultural DSSs [10, 11, 12, 13] remain opaque to
               users and enclosed behind the software. Hence, they are often referred to as “black-
               boxes” [14, 15]. This could lead to doubts, notably when suggestions coming from a
               DSS deviate significantly from the user’s presumption [16]. It has been argued that the
               lack of explanation regarding the decisions made by ML models and the absence of
               control over their internal processes are major drawbacks in critical decision-making
               processes [17].
                   The use of visualisation techniques has been shown to provide essential insights
               and facilitate the understanding of ML models for complex problems [18, 19], par-
               ticularly towards the users with little ML knowledge [20, 21]. Therefore, to address
               the aforementioned challenges, in this paper, we present a visual support system that
               allows agricultural experts with little ML knowledge to compare different predictive
               models by leveraging their domain knowledge. We named this system, AHMoSe for
               augmented by human model selection. The goals of AHMoSe are: (1) to be able to se-

                                                                  2
© 2021.This manuscript version is made available under the CC-BY-NC-ND 4.0 license https://creativecommons.org/licenses/by-nc-nd/4.0/

               lect models that generalise better to the data and (2) to leverage user understanding of
               the different models. It can be used with any ML model as it is based on model-agnostic
               ML interpretation methods, and thus only needs access to the input (i.e., features) and
               the predicted output of the model. In this paper, we present a case study of AHMoSe
               in the domain of viticulture.
                   The contributions of our work in this paper are as follows. First, we present the
               results of a simulation study indicating how AHMoSe can help in the selection of
               models that have a better performance than the model that would be selected by an
               AutoML process. We then present the results of a qualitative evaluation with experts
               (n=9) from viticulture and ML domains, which indicate that by showing the agree-
               ment and disagreement of each model with domain knowledge and enabling users to
               inspect the models further can promote trust. In addition, the experts identified several
               potential use cases in agriculture such as understanding how one’s products are being
               characterised by ML models, detecting anomalies in data and unqualified products, and
               highlighting the problems within the features of a model. The source code of AHMoSe
               is available at: https://osf.io/6b38w/.

               2. Related Work

                   In this section, we discuss related work in agricultural DSSs, interactive model
               analysis and human-guided machine learning systems with a focus on systems that
               allow model comparison and selection.

               2.1. Decision Support Systems in Agriculture
                   DSSs have become increasingly popular in the various sub-domains of agricul-
               ture [1]. Vite.net [12], for instance, supports crop management within vineyards. It
               provides important information about vine growth, pest control and diseases in grape
               berries and allows farmers to make informed management decisions. AquaCrop [22]
               supports simulation analysis towards the impact of climate change, especially rainfall,
               on wheat yield . Similarly, ATLAS [23] allows a simulation of crop availability on a
               landscape across different crop scenarios in relation to pests, diseases and biological
               control. While these tools can undeniably offer valuable decision supports for agri-
               cultural experts, the use of model explanation techniques is limited among agricultural
               DSSs. As mentioned earlier, black-box systems could often lead to negative percep-
               tions from users when they fail to provide meaningful explanations [16]. We address
               this by designing a system that can compare and explain the predicted outcomes of
               various machine learning models in relation to the knowledge of domain experts.

               2.2. Interactive Model Analysis
                   Interactive model analysis aims to facilitate the understanding of machine learn-
               ing models and to help users identify unsatisfactory learning processes through visual
               analytics. The majority of previous work on interactive model analysis has aimed to
               support ML experts by allowing them to not only understand and diagnose but also to
               refine ML models in order to improve their performance and robustness [24].

                                                                  3
© 2021.This manuscript version is made available under the CC-BY-NC-ND 4.0 license https://creativecommons.org/licenses/by-nc-nd/4.0/

               2.2.1. Model Explanations
                   Research on explainable artificial intelligence (XAI) has recently provided a new
               range of useful techniques that facilitate the understanding and diagnosis of models. In
               particular, the visualisation of explanations from model-agnostic interpretation meth-
               ods, such as LIME [25], SHAP [26], DeepVid [27] or RuleMatrix [28], allow users
               to understand better and diagnose different models regardless of the models’ internal
               mechanism. In AHMoSe, we use the SHAP framework to incorporate explanations as
               its methods show better consistency with human intuition [26, 29]. The latter makes it
               a good fit for our system as the users have to compare these explanations with their do-
               main knowledge. Moreover, the SHAP framework has already been used successfully
               in the agriculture domain to determine the appropriate time-series length in the predic-
               tion of agricultural droughts [30] and to identify the influence of features favourable to
               the coffee leaf rust disease [31].

               2.2.2. Model Comparison Systems
                   Although interactive model analysis systems have generally focused on diagnos-
               ing or improving a single model, some previous work already has put the spotlight
               on model comparison and selection. Zhang et al. [32] proposed Manifold, a model-
               agnostic framework aimed at ML experts that provides a visual comparison of ML
               models that can be used to diagnose and refine ML models on classification and re-
               gression tasks. Targeting non-ML experts, as in AHMoSe, Bögl et al. [33] proposed
               TiMoVA, a visual interface to select ARIMA models through interactive visual inter-
               faces based on user stories and iterative domain expert feedback. Unlike AHMoSe,
               which is model-agnostic, TiMoVa is focused on only a family of models, ARIMA. Be-
               sides, Mühlbacher and Piringer [34] presented a framework targeting experts from the
               energy sector that enables visual investigation of patterns to avoid structural assump-
               tions and allows the comparison of different regression models. The system signifi-
               cantly reduced the effort of the experts in building and improving regression models.
               Unlike the work of Mühlbacher and Piringer, where the target users have had experi-
               ence with prediction models, our target users are agricultural experts who have little to
               no ML experience.

               2.3. Human-Guided Machine Learning
                   Some recent work has looked into extending the human-in-the-loop approach to
               an AutoML context, a research area referred to as human-guided machine learning
               (HGML), and which tasks analysis and desired system requirements are presented by
               Gil et al. [8]. The end goal of HGML is to develop systems that enable domain ex-
               perts to use relevant domain knowledge to guide the different steps in an end-to-end
               AutoML process without the need for a ML expert. The major tasks foreseen by the
               authors are grouped into three categories: data use, model development, and model
               interpretation. Here, we focus on four recent systems that fit into the HGML descrip-
               tion and have support, besides other tasks, for model comparison and selection, namely
               TwoRavens [35, 8], Snowcat [36], BEAMES [37], and Visus [38].
                   To support model comparison and selection, TwoRavens [35, 8] offers some eval-
               uating metrics (accuracy, mean squared error, or F1 macro) together with a confusion

                                                                  4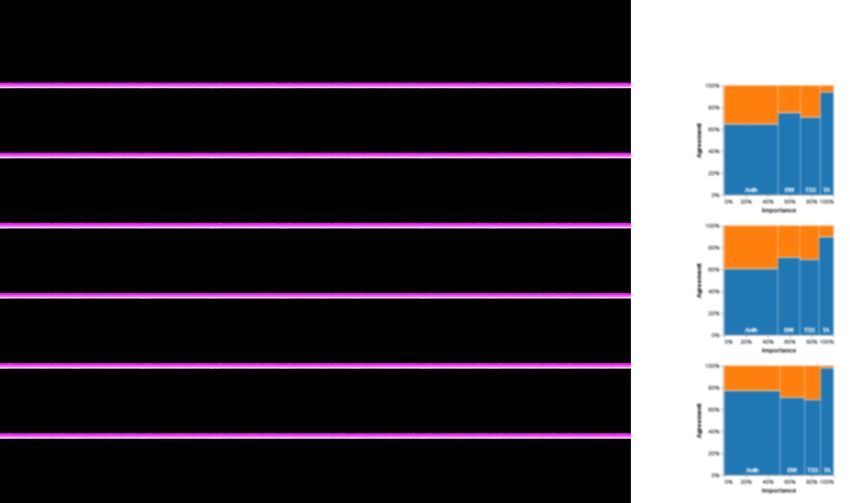
© 2021.This manuscript version is made available under the CC-BY-NC-ND 4.0 license https://creativecommons.org/licenses/by-nc-nd/4.0/

               matrix. The same approach is used by Snowcat [36], with the addition of a residual
               bar chart for regression models. BEAMES [37], that already identifies model compar-
               ison as one of the limitations and a possible line of work, allows comparing different
               models by inspecting their outputs. In contrast to the other three systems, Visus [38]
               supports more detailed explanations. In particular, for classification models, it uses
               RuleMatrix [28] model-agnostic explanations (in addition to a confusion matrix), and
               for regression models, it uses partial dependence plots [39] to explain every feature,
               and a confusion scatterplot. Note that neither Visus nor the other three HGML systems
               use any summary or overview visualisation that eases the comparison process between
               models explanations, which is one of the design decisions of AHMoSe to improve the
               comparison process.
                   Our system, AHMoSe, aims to offer a solution for the comparison of regression
               models by domain experts with little ML knowledge that uses intuitive model explana-
               tions and gives domain-knowledge a primary role on the model comparison and selec-
               tion. The design of this solution was done so that it could be integrated into any HGML
               system to improve its support for model understanding, comparison, and selection.

               3. Case Study and Design Process
                   To demonstrate AHMoSe and its design process, we use viticulture as an example
               domain. Many different aspects of the viticulture industry could leverage the use of ML
               models to generate predictions, e.g., wine quality, grape quality, fermentation duration,
               and yield. Many of such observations, however, are yearly-based (e.g., yield or grape
               quality at harvest), which makes it impossible to accelerate the gathering of data. The
               distribution of the data from year to year can vary a lot due to uncontrollable parameters
               like weather conditions [40].
                   Besides, viticulture researchers often have access to data from just a few vineyards,
               and grape growers are usually reluctant to share their data. In addition, among all possi-
               ble metrics that could be measured in viticulture, vineyards often have their own subset
               of metrics of interest, which can be different from other vineyards. This consequently
               limits the use of data from different sources together.
                   In addition to the limited size of datasets, the black-box nature of ML models has
               been criticised in the domain [41]. As a result, researchers often rely on knowledge-
               based decision support systems, such as fuzzy sets [42], that use domain knowledge
               of experts. Similarly, we designed AHMoSe to help with cases where there is a lack
               of data, and to promote user trust by explaining ML model predictions. AHMoSe
               combines domain knowledge of the experts with ML models to help domain experts
               select ML models and to explain the model behaviour as a basis to increase user trust
               in the model.
                   Following the nested model for visualisation design proposed by Munzner [43], in
               the following subsections, we (1) characterise the challenges that need to be addressed,
               (2) analyse the required data transformations and (3) devise tasks for the system.

               3.1. Domain Problem Characterisation
                   Through several discussion sessions with experts in viticulture, we characterised
               the different questions that they faced with regards to the previously described limita-

                                                                  5
© 2021.This manuscript version is made available under the CC-BY-NC-ND 4.0 license https://creativecommons.org/licenses/by-nc-nd/4.0/

               tions:
                   Should I use this model with this data? Even when the traditional ML metrics
               (e.g., accuracy, error) are shown and understood by domain experts, it is not clear for
               them to what data the model would be able to generalise. For example, if a model was
               trained using data from a nearby vineyard of a different variety, can it be used to make
               predictions on this one?
                   Why should I trust this ML model? Users must be provided with an accurate
               estimation of uncertainties from visual analytics systems so that they can trust the ac-
               quired knowledge [44]. Similar to previous work in other domains, domain experts
               are often very critical when models present outcomes that do not fully match their
               expectations [45]. In other words, does a model behave according to prior knowledge?
                   Which model should I select? When multiple models are available (different mod-
               els or the same model trained on different data), how can one decide which one is more
               appropriate to make predictions on their data?

               3.2. Data Transformation and Abstraction
                   The general transformations and flow of the data are depicted in Figure 1. In this
               section, we focus on the transformations that should be applied to the raw data to
               explain models to domain experts. Then, in Section 4, the different transformations
               and encodings that take place to generate the visualisation, as well as the interactions
               of the user with the AHMoSe interface, are described.

                                                                        AHMOSE

                Domain expert knowledge              Knowledge intervals

                    KNOWLEDGE
                        DATA

                                                                           Visualization                 User
                                  Data of interest

                     Machine         Expected              Model
                     learning          values           explanations
                      models          (SHAP)

                                 Figure 1: An overview of the flow of data in the AHMoSe ecosystem.

                                                                  6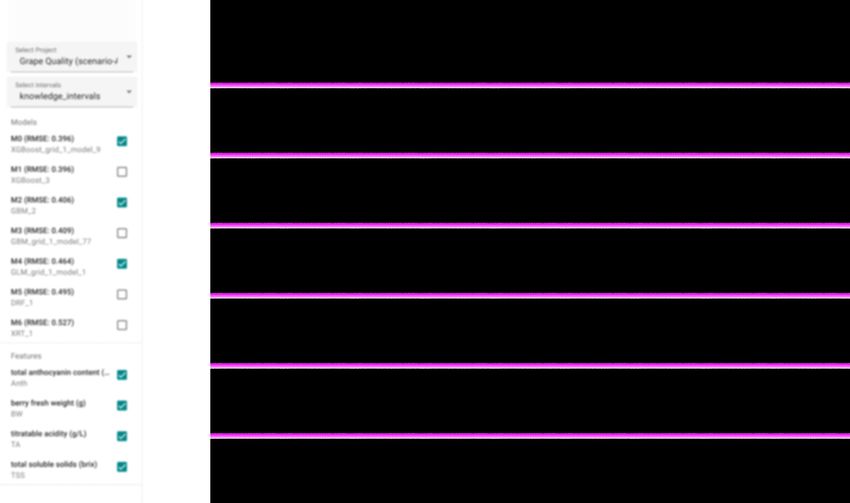
© 2021.This manuscript version is made available under the CC-BY-NC-ND 4.0 license https://creativecommons.org/licenses/by-nc-nd/4.0/

               3.2.1. Domain Knowledge
                   Previous research has shown the advantages of prompting users to reflect on their
               prior knowledge [46]. AHMoSe expects the domain experts to state their prior knowl-
               edge for features explicitly. To this end, they should provide a range where the target
               feature mean value is expected for as many different intervals of each input feature as
               they know of.

               3.2.2. Model Explanations
                    The reason behind data transformation is to be able to use an explainable ML ap-
               proach that allows us to know how the output of each model depends on each feature.
               In particular, we want to know for each observation of our data what effect each fea-
               ture has on the predicted output. Although a number of algorithms are available for
               this, we are using the SHAP framework as it shows better consistency with human
               intuition [26, 29].
                    When obtaining explanations from the SHAP framework for a model and a dataset,
               one obtains, for each observation of the data, what effect the value of each input feature
               has on the predicted output (this effect is called the SHAP value). If the model is, for
               instance, a regression model, this SHAP value indicates how feature increments or
               decrements affect the output value for that observation. The SHAP framework also
               provides a base value, which is the average model output over the dataset the model
               was trained on. This value is used in our system to translate the SHAP value from an
               effect space to the dimensions of the predicted output, which makes the interpretation
               and the comparison with domain knowledge easier.
                    The model explanation data then includes the followings for each model, each fea-
               ture, and each observation of the data of interest: the value of the feature, the effect of
               that feature on the model output (SHAP value), and the sum of the SHAP value and
               the reference value. This last value is very important as it translates the SHAP value
               from an effect space to the dimensions of the target feature, where we will be able to
               compare it with the knowledge intervals.
                    Most of the tools that visualise model explanations are usually aimed at either clas-
               sification problems [28] or regression problems [34]. AHMoSe is designed for regres-
               sion problems where both input and output variables are numeric.

               3.3. Task Abstraction
                   Based on the different questions devised in Section 3.1, using the transformed data
               (knowledge intervals and model explanations) with AHMoSe should support the fol-
               lowing tasks:
                T1. Understand model explanations. Users should be able to locate and summarise
                    the explanations of a given model.
                T2. Identify model bias. Users should be able to identify if different expected val-
                    ues of model explanations agree with the corresponding knowledge interval, are
                    over-estimations or are under-estimations.
                T3. Compare two different model explanations. Users should be able to analyse
                    the similarity of two different models.

                                                                  7
© 2021.This manuscript version is made available under the CC-BY-NC-ND 4.0 license https://creativecommons.org/licenses/by-nc-nd/4.0/
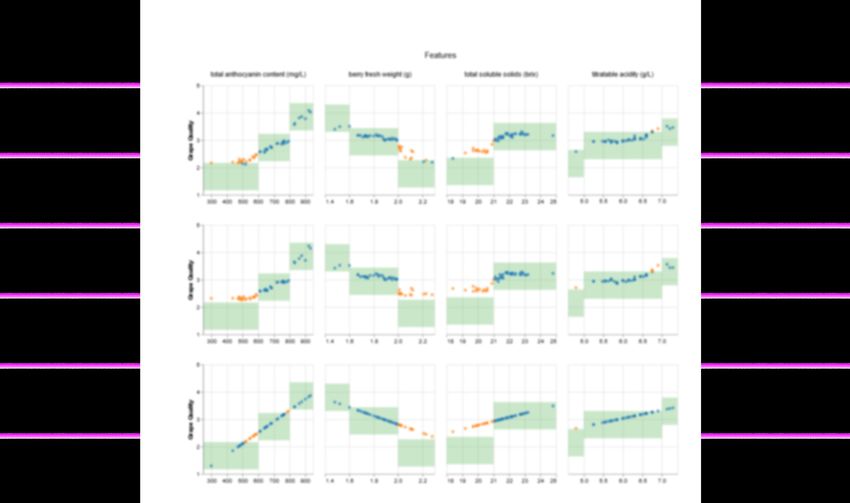
a b c
Figure 2: The AHMoSe interface: a) the sidebar controls to select the use case, intervals, models and features
to be visualised, b) the scatter plots highlight the comparisons between models’ predictions (orange and blue
dots) and domain expert knowledge (green rectangles), c) the Marimekko charts indicate the importance
of each feature according to the given model, and the agreement between the model and domain expert
knowledge.
T4. Identify a model. Users should be able to identify a model that has the highest
agreement level with knowledge intervals taking into account the importance of
each feature.
4. The AHMoSe Interface
The interface of AHMoSe consists of a sidebar (Figure 2a) and a visualisation panel
(Figure 2b and Figure 2c). The visualisation panel consists of a plot matrix that has
one row for each of the selected models the user wants to analyse. For each of the
rows (i.e., models), two different visualisations, described in the following sections,
are shown: a knowledge-agreement dependence plot for each feature (Figure 2b) and
a knowledge-agreement summary plot (Figure 2c). The AHMoSe user interface has
been developed using React and the visualisations were made with Vega-Lite [47] and
Vega [48].
4.1. Knowledge-agreement Dependence Plot
For each model and each feature, a knowledge-agreement dependence plot is shown
(e.g., Figure 3). All these plots are then arranged on a faceted plot matrix, see Figure 2b,
where each column corresponds to a feature and each row to a model. This plot has
two different layers: a knowledge layer and a model layer. Note that while the model
layer is different for each row (model) and column (feature), the knowledge layer is
different for each column (feature), but shared by all the models.
8© 2021.This manuscript version is made available under the CC-BY-NC-ND 4.0 license https://creativecommons.org/licenses/by-nc-nd/4.0/
total anthocyanin content (mg/L)
5
4
Grape Quality 3
2
1
300 400 500 600 700 800 900
Figure 3: Knowledge-agreement dependence plot for a feature (total anthocyanin content).
4.1.1. Knowledge Layer
This layer uses a green rectangle mark for each of the knowledge intervals that
correspond to the feature (e.g., total anthocyanin content in Figure 3). The x-axis limits
of each rectangle encode the minimum and maximum of each interval defined by the
domain expert. The y-axis limits of each rectangle encode the range where the domain
expert expects the target feature mean value to be (e.g., Grape Quality mean value in
Figure 3).
4.1.2. Model Layer
This layer uses a circle mark for each local explanation corresponding to a specific
model and feature (e.g., total anthocyanin content in Figure 3). The x-position encodes
the value of the feature (e.g., total anthocyanin content in Figure 3) on the observation
the local explanation was made on. The y-position encodes the expected value of the
target feature (e.g., Grape Quality in Figure 3) based on the model. Color encodes
the agreement (blue) or disagreement (orange) with the corresponding domain expert
knowledge. If no knowledge interval covers the value of the feature for a circle, then it
is encoded in grey.
The knowledge-agreement dependence plots allow the user to perform task T1 (Un-
derstand model explanations) and T2 (Identify model bias). T3 (compare two different
model explanations) can also be performed when two models are displayed at a time
on the matrix plot.
4.2. Knowledge-agreement Summary Plot
The knowledge-agreement summary plot (e.g., Figure 4) is a Marimekko chart. The
width of each group of stacked bars encodes the importance of that feature according to
the given model explanations. The height of each stacked bar encodes the percentage of
circles of the knowledge-agreement dependence plot of that feature that corresponds to
9© 2021.This manuscript version is made available under the CC-BY-NC-ND 4.0 license https://creativecommons.org/licenses/by-nc-nd/4.0/
each category: agreement (blue), disagreement (orange), or have no knowledge interval
reference (grey).
100%
80%
Agreement
60%
40%
20%
Anth BW TSS TA
0%
0% 20% 40% 60% 80%100%
Importance
Figure 4: Knowledge-agreement summary plot.
The knowledge-agreement summary plot allows the user to perform task T1 (Un-
derstand model explanations) and T3 (Compare two different model explanations) as it
shows the importance of each feature to the model. Also, the summary plots allow the
user to perform T4 (Identify a model).
To perform task T4 (Identify a model), the model with the highest weighted mean
agreement (where the weights are the feature importance) should be selected. On the
Marimekko chart, this matches with the blue area of the summary plot. Although the
comparison of areas is less effective than the comparison of lengths of an alternative
bar chart with the weighted mean agreement, the use of Marimekko charts provides
transparency to users on how this score is obtained. Also, the importance is still needed
for both T1 and T3, so at least two graphs should be added.
4.3. Sidebar Controls
The sidebar controls (see Figure 2a) have two different functions: to select which
data to use and to filter it to generate the visualisation.
To select which data to load, the user selects a project from a dropdown, which
will load the models’ explanations and related information and the list of knowledge
intervals available. Afterwards, the use of one of the available knowledge intervals for
that project can be selected from another dropdown.
When the data is selected, the sidebar displays a list with the available models and
features. The user can select which models and features to visualise.
10© 2021.This manuscript version is made available under the CC-BY-NC-ND 4.0 license https://creativecommons.org/licenses/by-nc-nd/4.0/
5. Evaluation
In this section, we describe the use case of AHMoSe1 to demonstrate the utility
of the tool. We use the scenario of grape quality prediction based on [49], where
a knowledge-based fuzzy inference system (FIS) is proposed as a model for grape
quality in vineyards. Grape quality prediction is representative of many of the common
agriculture prediction scenarios, with sparse data as one of the key characteristics.
We first present the results of a simulation study that demonstrates that our approach
can enable the selection of a model with better performance than the model proposed by
a fully automated AutoML system using a cross-validation approach. We then present
the results of a user evaluation with domain experts, which was designed to obtain
qualitative feedback on the tool.
5.1. Simulation Study
5.1.1. Scenario and Data
In this scenario, the data observations correspond to one grape variety (Vitis vinifera
cv. Agiorgitiko) on 48 10 × 20 meters cells of the same vineyard situated on Central
Greece. The data is available only for the years 2010, 2011, and 2012. The FIS model
proposed in [49] uses four measures of the grapes taken at harvest for each of the
cells as input: total soluble solids (TSS), titratable acidity (TA), total skin anthocyanins
(Anth) and berry fresh weight (BW). In order to validate the FIS model, a grape quality
score was given by five grape growers and winemakers of the Greek wine industry
with experience in Agiorgitiko variety. The grape quality score (GTQ) given by the
experts was one of the following values: very poor, poor, average, good, and excellent.
Although the GTQ value given by experts is discrete, it is considered as continuous by
the FIS model. In the same way, we encoded it from 1 (very poor) to 5 (excellent) for
training our regression models and treat it as a continuous value.
To make the use case scenario realistic, we place ourselves at the harvest time of
2012 for this case study. Thus, we have the four measures on each of the 48 cells
available for the three years, but the GTQ grape quality value only of 2010 and 2011.
Thus, the models would be trained and validated using only 2010 and 2011 data, and
the objective is to use AHMoSe to select the best-suited ML model for predicting the
quality of 2012 grapes for each of the 48 cells. The ground truth data for 2012 grape
quality will be used in Section 5.1.5 to evaluate the performance improvement obtained
when using the model selected with the aid of AHMoSe instead of the model proposed
by the fully automated AutoML system.
5.1.2. Models
To construct the different ML models, we used an AutoML system. Using an Au-
toML system to obtain the models that we are going to use has two advantages:
• AutoML systems improve the reproducibility of scientific studies and the fair-
ness of ML model comparisons [4].
1 https://93degree.github.io/AHMoSe-app/
11© 2021.This manuscript version is made available under the CC-BY-NC-ND 4.0 license https://creativecommons.org/licenses/by-nc-nd/4.0/
• Shows how AHMoSe could be integrated as part of a fully end-to-end human-
guided machine learning system.
In particular, we have used the AutoML process of the H2O.ai open-source plat-
form through its R API [50]. The H2O AutoML system trains different models, tuning
them using a grid hyperparameter optimisation. In order to evaluate and rank the mod-
els, the H2O AutoML process uses by default 5-fold cross-validation for each model
in the AutoML to evaluate and rank them. Although H2O.ai supports the use of Deep
Neural Networks, we did not use them despite the popularity of this technique [51].
Our main argument is that the number of parameters in Deep Neural Networks can be
easily more than the number of training data points, so it can easily lead to overfit-
ting despite using regularisation techniques such as Frobenius norm or dropout [52].
Furthermore, including the generation of Deep Learning models in the H2O AutoML
process leads to results that are not reproducible.
We trained the AutoML function with the 96 observations corresponding to the
data from the years 2010 and 2011 and using the default 5-fold cross-validation with
the RMSE metric. The cross-validation metrics are used for early stopping and ranking.
From the different regression metrics available to rank and evaluate the different results,
we use the root mean squared error (RMSE) throughout this scenario. Although this
metric is a bit more challenging to understand for users with little ML knowledge
than the mean absolute error (MAE), the fact that it punishes large errors makes it a
good fit. The latter idea is supported by the use of discrete scores by the growers and
winemakers.
In order to reproduce the results, the following parameters (and the default ones
for the remaining) should be used on the AutoML function running on an H2O cluster
with version 3.26.0.2:
• sort metric = "RMSE"
• stopping metric = "RMSE"
• seed = 93
• exclude_algos =
c("DeepLearning", "StackedEnsemble")
With the previous parameters, the AutoML function generated in approximately 75
seconds 101 different models: 1 DRF, 1 XRT, 1 GLM, 67 GBMs, and 31 XGBoost
models. The AutoML process was run on a virtual machine (VM) instance with 4 Intel
Xeon Skylake (2.7 GHz) and 8 GB RAM.
For the case study, only the two best-ranked models of each family based on the
RMSE score were selected (for some families, only one is generated by AutoML). In
Table 1, the seven selected models are ranked using the AutoML 5-fold cross-validation
RMSE score.
5.1.3. Prior Expert Knowledge
AHMoSe needs prior expert knowledge on how the target feature (grape quality,
GTQ) depends on each input features: total soluble solids (TSS), titratable acidity
12© 2021.This manuscript version is made available under the CC-BY-NC-ND 4.0 license https://creativecommons.org/licenses/by-nc-nd/4.0/
Table 1: The best models of each family (2 if available) with their AutoML 5-fold cross-validation RMSE
score and their rank on the AutoML leaderboard.
alias model id RMSE rank
M0 XGBoost grid 1 model 9 0.396 1
M1 XGBoost 3 0.396 2
M2 GBM 2 0.406 4
M3 GBM grid 1 model 77 0.409 6
M4 GLM grid 1 model 1 0.464 30
M5 DRF 1 0.495 42
M6 XRT 1 0.527 50
(TA), total skin anthocyanins (Anth) and berry fresh weight (BW). These prior beliefs
should be materialised as regions where the grape quality mean value is expected for
different intervals of each feature.
Although there are different strategies to obtain this prior expert knowledge, to
facilitate the reproducibility of the case study and to keep the evaluation not biased to a
single expert, we construct the prior expert knowledge from the “IF-THEN” rules that
are provided by human experts for the FIS construction in [49]. In Table 2, we show
how each feature is subdivided in a different number of intervals (between 2 and 4),
and each interval is given one of the following labels: L - low, M - medium, H - high
or VH - very high. These intervals correspond with the ones defined by the experts
in [49].
Table 2: Knowledge Intervals
Feature Label Interval WQM GTQ range
Anth L [200, 600] 1.67 [1.17, 2.17]
M (600, 800] 2.73 [2.23, 3.23]
H (800, 1000] 3.85 [3.35, 4.35]
VH (1000, 1400] 4.75 [4.25, 5.00]
BW L [1.0, 1.6] 3.80 [3.30, 4.30]
M (1.6, 2.0] 2.94 [2.44, 3.44]
H (2.0, 2.5] 1.77 [1.27, 2.27]
TSS L [15,21] 1.86 [1.36, 2.36]
H (21,30] 3.13 [2.63, 3.63]
TA L [3, 5] 2.14 [1.64, 2.64]
M (5, 7] 2.80 [2.30, 3.30]
H (7, 12] 3.29 [2.79, 3.79]
To calculate a region where the grape quality mean is expected for each interval
(GTQ range column of Table 2), we make use of the “IF-THEN” rules defined by
experts. There are 72 rules, one for each possible combination of the different intervals
13© 2021.This manuscript version is made available under the CC-BY-NC-ND 4.0 license https://creativecommons.org/licenses/by-nc-nd/4.0/
of each feature. For each combination (input), the rule defines an output (grape quality
GTQ). For example, if TSS is high (H), TA is medium (M), Anth is very high (VH),
and Berry Weight is low (L), the rule defines a GTQ of 5 (excellent).
We could obtain the expected mean value of grape quality for each interval of each
feature by averaging the output of every rule that includes it. However, such an ap-
proach would not lead to a good simulation of a domain expert of our selected vineyard
as many of these input combinations never occurred. So to make a more realistic ap-
proximation of an expert opinion, we weight each of the rules by the number of times
that the rule input combination occurred in the three years we have measures of TSS,
TA, Anth, and BW. The W column of Table 3 shows the weight of each rule.
Table 3: An excerpt of the 72 expert rules. They correspond to the rules with a weight (W) value greater than
0.
W TSS TA Anth BW GTQ W TSS TA Anth BW GTQ
28 H M M M 3 2 L M M L 3
16 H M H M 4 2 H M VH L 5
10 H M M H 2 2 L M L H 1
10 L M M M 2 2 H L M M 2
9 L M L M 1 2 H L L M 1
7 H H L M 3 1 L L M M 1
6 H M L H 1 1 L L M L 2
6 H H M M 4 1 L L H L 3
5 H M L M 2 1 H H VH M 5
4 H H L H 2 1 L M H H 2
4 H M H L 5 1 L M H L 4
4 H M VH M 5 1 H L M L 3
3 H H H M 5 1 H L H H 2
3 L H L M 2 1 H L VH H 3
3 L M H M 3 1 H M H H 3
3 H L H M 3 1 L L L L 1
2 H M M L 4
The column weight quality mean (WQM) of Table 2 shows the obtained weighted
mean for each interval of each feature. The prior belief that we consider for each
interval is a 0.5 radius interval around this value. So, for example, for medium (M)
total anthocyanin content (Anth) values, between 600 and 800 mg/L, the prior belief is
that the mean value of grape quality (GTQ) is between 2.23 and 3.23. This can be seen
in Figure 5 (corresponding green region).
5.1.4. Model Understanding and Diagnosis Using AHMoSe
Once the project and intervals are loaded using the sidebar controls, the user can
start exploring the models to understand and diagnose them.
First, looking at the knowledge-agreement summary plot (2 models can be seen in
Figure 5), a user could observe that Anth (total anthocyanin content) is the most crucial
14© 2021.This manuscript version is made available under the CC-BY-NC-ND 4.0 license https://creativecommons.org/licenses/by-nc-nd/4.0/
Features
total anthocyanin content (mg/L) berry fresh weight (g) total soluble solids (brix) titratable acidity (g/L)
5 100%
80%
4
Grape Quality
Agreement
60%
M0 3
40%
2
20%
Anth BW TSS TA
1 0%
300 400 500 600 700 800 900 1.4 1.6 1.8 2.0 2.2 18 19 20 21 22 23 24 25 5.0 5.5 6.0 6.5 7.0 0% 20% 40% 60% 80%100%
Importance
5 100%
80%
4
Grape Quality
Agreement
60%
M4 3
40%
2
20%
Anth BW TSS TA
1 0%
300 400 500 600 700 800 900 1.4 1.6 1.8 2.0 2.2 18 19 20 21 22 23 24 25 5.0 5.5 6.0 6.5 7.0 0% 20% 40% 60% 80%100%
Importance
Figure 5: Comparison between M0 (XGBoost grid 1 model 9) and M4 (GLM grid 1 model 1) models.
feature for the predictions of every model (40 − 50% of the importance).
Second, there are three intervals where most models expect a higher value than the
experts:
• Total anthocyanin content (Anth) low interval, from 200 to 600 mg/L.
• Berry fresh weight (BW) high interval, from 2.0 to 2.5 g.
• Total soluble solids (TSS) low interval, from 15 to 21 brix.
When there is a disagreement on one or more intervals that occurs with many models,
it can be a signal of either erroneous expert prior beliefs or a difference in distribution
between the training and the data of interest that lead to some models not being able to
generalise properly for those values.
5.1.5. Model Selection Using AHMoSe
Unless other particularities had arisen during the understanding and diagnosis of
the models, a sensible approach to select a model using AHMoSe is to identify the one
that has a higher weighted mean agreement (i.e., mean of the different agreement levels
weighted by the relevance/importance of each feature according to the model). Note
that this weighted mean agreement (WMA) is also equivalent to the percentage of the
blue area on the summary plot.
In Table 4, we can see the models ordered by their weighted mean agreement
(WMA) value. Also, as we have the real grape quality (GTQ) score given by domain
experts in the year 2012, in the column RSME (Test), we have listed their root mean
squared error when using the model to make predictions on our test data, the 2012
grape quality. For the sake of completeness, we have also listed the initial AutoML
5-fold cross-validation RMSE score.
If AHMoSe is not used in this scenario, the selected model would have been the
XGBoost grid 1 model 9 (M0), as the AutoML system proposes this model due to
15© 2021.This manuscript version is made available under the CC-BY-NC-ND 4.0 license https://creativecommons.org/licenses/by-nc-nd/4.0/
Table 4: Models ordered by their weighted mean agreement (WMA), listed together with their AutoML
RMSE 5-fold cross-validation score, and the RMSE score when using the model to make predictions on our
test data, the 2012 grape quality.
RMSE
alias model WMA AutoML Test
M4 GLM grid 1 model 1 0.770 0.464 0.403
M0 XGBoost grid 1 model 9 0.714 0.396 0.430
M1 XGBoost 3 0.693 0.396 0.457
M5 DRF 1 0.691 0.495 0.567
M6 XRT 1 0.690 0.527 0.585
M3 GBM grid 1 model 77 0.683 0.409 0.526
M2 GBM 2 0.679 0.406 0.507
having the lowest 5-fold cross-validation RMSE of the 101 models that were built.
In contrast, using AHMoSe, we can see that the model that has the highest weighted
mean agreement (WMA) and thus would be selected is GLM grid 1 model 1 (M4).
So, by using AHMoSe to support the model selection, we have been able to have a
6.3 percentage decrease on the root mean squared error (RMSE) for the 2012 test data,
from 0.430 to 0.403.
5.1.6. Incomplete Prior Expert Knowledge
An advantage of AHMoSe over other knowledge-based systems is that the user
does not need to know all the features of the models or their interactions. In the de-
scription of the scenario of Tagarakis et al. [49], there is some other available data that
was not incorporated into their FIS model. Namely, they have measures of the average
temperature for the growing season (April 1st to October 31st), and they also have the
relative position of each measured cell on the field (the row and column of each one on
the grid).
So, we can consider a modification of the previous scenario where we also input
these three new features to build and train the models in the AutoML system, but with-
out adding any new knowledge to AHMoSe. From now on, we refer to the previous
scenario as A and this one as B.
Following the same rationale as Section 5.1.5 for scenario B, by using AHMoSe
we select GLM grid 1 model 1 (B-M4), as it has the highest WMA, instead of the
AutoML proposed XGBoost 1 (B-M0) model (see models and metrics on Table 5).
Thus, in scenario B, we have been able in this scenario to have a 16.0 percentage
decrease on the root mean squared error (RMSE) for the 2012 test data, from 0.458 to
0.385.
As shown here, AHMoSe enables the user to incorporate new features to the pre-
diction model, which can lead, as in this case, to an improvement of the model per-
formance without the need of domain experts to know how they affect the predicted
value (grape quality, in our case). Still, the users can compare the features they have
knowledge about in the same way, and they can get an understanding of how these new
16© 2021.This manuscript version is made available under the CC-BY-NC-ND 4.0 license https://creativecommons.org/licenses/by-nc-nd/4.0/
Table 5: Scenario B models ordered by their weighted mean agreement (WMA), listed together with their
AutoML RMSE 5-fold cross-validation score, and the RMSE score when using the model to make predic-
tions on our test data, the 2012 grape quality.
RMSE
1
alias model WMA AutoML Test
B-M4 GLM grid 1 model 1 0.710 0.475 0.385
B-M2 GBM grid 1 model 90 0.657 0.425 0.525
B-M1 XGBoost grid 1 model 11 0.652 0.412 0.450
B-M0 XGBoost 1 0.647 0.409 0.458
B-M3 GBM 4 0.632 0.425 0.520
B-M5 DRF 1 0.610 0.530 0.589
B-M6 XRT 1 0.594 0.556 0.624
1
Despite some having the same name, the models are different from the ones on
scenario A, as they were trained with additional variables.
features affect the prediction of their data of interest, based on the explanations shown
in AHMoSe.
5.2. Qualitative Feedback
We also conducted an evaluation with experts to gather feedback. We interviewed
a total of nine experts, five viticulture experts (V1 – V5) and four ML experts (ML1 –
ML4) who are working across various European research institutes. The experts were
first presented with the tool and explained the individual components of the tool. They
were then given a few minutes to interact with the tool and to ask questions for further
clarifications. If there were no further question, we asked the experts the following
10 open-ended questions. Responses to each of the questions were recorded and later
transcribed for analysis.
1. How do you imagine the tool being used in real life?
2. In which situations do you think this tool will be useful?
3. Which parts of the visualisations make you trust the Machine Learning models?
4. How did the tool affect your understanding of the influence of features on each
model?
5. How easy was it to use the tool to select a model?
6. What other word choices (e.g., “agreement”, “importance”) would make the vi-
sualisation easier to understand?
7. Which aspects of the visualisations would you change to improve your under-
standing of the visualisations?
8. Which aspects of the visualisations would you change to improve your under-
standing of model explanations?
9. Which aspects of the visualisations would you change to ease the model selection
task?
10. Do you have suggestions for improvement of the visualisations?
17© 2021.This manuscript version is made available under the CC-BY-NC-ND 4.0 license https://creativecommons.org/licenses/by-nc-nd/4.0/
The transcribed data were coded and analysed following the thematic analysis ap-
proach [53], which resulted in four main themes: potential use cases, trust, usability,
and understandability.
The qualitative evaluation was carried out with different ML models and knowledge
intervals than those used for the simulation study previously described in Section 5.1.
A sample of the specific visualisations shown during the evaluation with viticulture and
machine learning experts are shown in Figure 6.
Features
total anthocyanin content (mg/L) berry fresh weight (g) total soluble solids (brix) titratable acidity (g/L)
5 100%
GBM_1(RSME: 0.37)
80%
4
Grape Quality
Agreement
60%
3
GBM_1(RSME: 0.37)
40%
2
20%
Anth BW TSS TA
1 0%
200 400 600 800 1,000 1.2 1.4 1.6 1.8 2.0 2.2 2.4 18 20 22 24 26 4 6 8 10 0% 20% 40% 60% 80%100%
Importance
5 100%
SE_1(RSME: 0.385)
80%
4
Grape Quality
Agreement
60%
3
SE_1(RSME: 0.385)
40%
2
20%
Anth BW TSS TA
1 0%
200 400 600 800 1,000 1.2 1.4 1.6 1.8 2.0 2.2 2.4 18 20 22 24 26 4 6 8 10 0% 20% 40% 60% 80%100%
Importance
5 100%
XGB_1(RSME: 0.432)
80%
4
Grape Quality
Agreement
60%
3
XGB_1(RSME: 0.432)
40%
2
20%
Anth BW TSS TA
1 0%
200 400 600 800 1,000 1.2 1.4 1.6 1.8 2.0 2.2 2.4 18 20 22 24 26 4 6 8 10 0% 20% 40% 60% 80%100%
Importance
5 100%
DeepL_1(RSME: 0.451)
80%
4
Grape Quality
Agreement
60%
3
DeepL_1(RSME: 0.451)
40%
2
20%
1
Anth BW TSS TA
0%
200 400 600 800 1,000 1.2 1.4 1.6 1.8 2.0 2.2 2.4 18 20 22 24 26 4 6 8 10 0% 20% 40% 60% 80%100%
Importance
5 100%
GLM_1(RSME: 0.463)
80%
4
Grape Quality
Agreement
60%
3
GLM_1(RSME: 0.463)
40%
2
20%
1 Anth BW TSS TA
0%
200 400 600 800 1,000 1.2 1.4 1.6 1.8 2.0 2.2 2.4 18 20 22 24 26 4 6 8 10 0% 20% 40% 60% 80%100%
Importance
Figure 6: Visualisations corresponding to five of the machine learning models available during the evaluation
with viticulture and machine learning experts.
5.2.1. Potential Use Cases
This theme highlights potential use cases that the experts believe can benefit from
our tool. All the experts recognised the advantages of using AHMoSe to compare the
18© 2021.This manuscript version is made available under the CC-BY-NC-ND 4.0 license https://creativecommons.org/licenses/by-nc-nd/4.0/
predictions of various ML models with one’s knowledge. For example, one of the
viticulture experts explained, “If I can put my measurements in there and see how the
model characterises my grapes at hand, of my sample, and see for example if my an-
thocyanin content is 500, how does this relate with the model? Is my quality good
or bad?” (V1). Another interesting use case mentioned by the viticulture experts was
detecting anomalies in data and unqualified products. For example, one expert men-
tioned, “let’s say if you have something unexpected happening on the field and you
want to see how this correlates with the quality that you are going to get. So you do
some measurements, and then you want to see how this is going to translate.” (V2).
The ML experts, unsurprisingly, were more focused on the technical process behind
each model. While they recognised the advantages of the tool for viticulture experts,
they specifically pointed out the case which requires a viticulture expert to select a suit-
able model and better understand the features. For example, one expert explained, “Of
course, there are models that are clearly unsuitable but they show where the problems
are, on which feature we have a problem in the ML algorithm. I don’t know how to ex-
ploit this information but it is clear that the berry fresh weight is a difficult feature to use
in all models.” (ML2). This expert also pointed out the utility of this tool in anomaly
detection such as, “A domain expert could ask, ‘I didn’t know that this feature, berry
fresh weight, when between 2 and 2.4, the grape quality is difficult to predict. What is
happening in that range?’ In other words...anomaly detection.” (ML2). In Figure 6,
one can see the described discrepancy between five of the models and the knowledge
intervals for the berry fresh weight feature when its values are between 2 and 2.4, as
highlighted by the orange coloured circles in the second column of the plot matrix.
The position of many circles above the knowledge interval indicates that, compared to
the expert knowledge, the models overestimate the quality of grapes with these berry
fresh weight values. Thus, it appears that anomaly detection is a potential use case the
experts envision the tool being used the most, in addition to quality prediction. Finally,
the experts also suggested to give the user more control, such as configuring different
models for each threshold (ML4).
5.2.2. Trust
The trust of users in a model often plays an important role for it to be adopted.
Explaining a model’s predictions, in a way that it is easily understandable, is perhaps
the most important aspect for earning a user’s trust [25]. This theme presents the as-
pects of our visualisations that may help users trust in the given ML models. All of
the nine participants mentioned that the ability to see dis/agreements between models’
predictions and an expert’s knowledge can help them inspect further and thus promote
trust. A viticulture expert explained, “The thing that makes us trust the models is the
fact that most of the time, there is a good agreement between the values predicted by
the model and the ones obtained for the knowledge of the experts.” (V5). Another viti-
culture expert described, “You actually help the model with some knowledge from the
experts, so when I see for example that my basic knowledge agrees with the model,
then we know that the model has some degree of certainty.” (V1). However, the same
expert also emphasised that we “cannot always take for granted and trust it with our
eyes closed.” (V1). The ML experts also had a similar remark regarding trust. For
example, one explained that “ [...] this visualisation is telling me an insight on what
19© 2021.This manuscript version is made available under the CC-BY-NC-ND 4.0 license https://creativecommons.org/licenses/by-nc-nd/4.0/
to look at. They are not going to take any decision or try to explain me why there is
this problem; just telling me there could be something going on here” (ML1). It ap-
pears that although the experts are aware of uncertainties, they recognise the potentials
of visualisations and the ability to improve predictions with the knowledge of domain
experts.
5.2.3. Usability
The usability theme focuses on the perceived ability of the tool to be used in real-
life. As previously mentioned in Section 5.2.1, all the experts saw usability of the tool
in various scenarios. However, they also expressed certain concerns and provided sug-
gestions for improvement. For example, one viticulture expert mentioned “it definitely
needed a person there like [researcher name] to explain it a bit, the logic behind the
models, what the green areas depict, the importance in the agreement of the model. It
wasn’t difficult to use it but definitely someone should be there to explain exactly what
it is. But it wasn’t difficult after that.” (V1). Adding more textual explanations and
legends may help mitigate this limitation.
The ML experts also provided some interesting suggestions to improve the usability
of the tool. These include sticky labels and using a mouse-over function to explain the
models briefly and to show various metrics of the models. For example, one expert
explained, “When you slide over [hover] a model, give more details because I can
probably imagine what the acronyms stand for but they are basically capital letters and
numbers and also add some explanations about the metrics you use. Is RMSE 0.37 high
or low, with respect to which reference value we are looking at?” (ML1). A second ML
expert suggested, “What I would have on a specific plot, for example the berry fresh
weight, is what the size of the error is of the orange dots. I mean the percentage of the
total error you get, in terms of performance. What is the error that they bring to the
total quality? Maybe you should give some insight of how big it is, how important it
is to fix this behaviour for specific classes of visualisation.” (ML2). A third ML expert
highlighted the importance of also showing the source of the data, whether is it model
or human-generated. As these suggestions have highlighted, it appears that usability
and understanding of the components may be correlated. In Section 5.2.4, we further
present the understandability of the various components in our tool.
5.2.4. Understandability
This theme focuses on how easy it was to understand the various components of the
tool and how we can improve them. While all the experts reported that they understood
the intentions of the tool, they also mentioned that the Marimekko charts (Figure 2c)
could be improved. For example, one viticulture expert explained that he wanted to see
whether “[...] this model is in the agreement with the basic bibliography. Is it in the
agreement with the expert and his/her knowledge?” (V1). One suggestion to show this
agreement was to introduce confidence intervals (ML4). Two of the viticulture experts
suggested that explicitly showing the success rate of each model may be helpful. For
example, “The right part may be a little bit confusing. And it would be useful to have a
final number [of] the percentage of success.” (V2). The tool currently shows the Root-
Mean-Square Error (RMSE) for each model, which may be confusing for the experts
who do not have an ML background.
20© 2021.This manuscript version is made available under the CC-BY-NC-ND 4.0 license https://creativecommons.org/licenses/by-nc-nd/4.0/
One ML expert stated that the Marimekko charts could be better explained by show-
ing the importance and agreement in relation to a particular baseline, for example,
“importance of a feature, and agreement with human assessor or some description
about that.” (ML1). Another ML expert suggested that showing more statistics or even
the underlying model (although this could get too technical) may help understand the
models better. For example, “[...] what is the fraction of the error per feature. Given
the wrong answer on each feature, the fraction of the error computed on that specific
dimension but maybe this is too technical.” (ML2). Surely, understandability of the
models, visualisations and features may differ between individual experts depending
on their background. However, we believe that the suggestions provided by the ML
experts could also help improve understandability for viticulture experts.
6. Conclusions and Future Work
In this article, we presented AHMoSe, a visual support system for model selection,
in particular, regression models. Our goal was to help users integrate their knowledge
for model selection in an intuitive way since several tools perform automatic model se-
lection, but in certain domains, the users need further inspection of results before turn-
ing prediction results into decision making. We provided details of the design process
that justify important implementation decisions of AHMoSe. Results of a simulation
study showed that combining expert knowledge with ML models enables to select a
model with better performance than the model that would be selected by an AutoML
system. Results of our qualitative evaluation indicated that seeing dis/agreements and
inspecting further into the models can promote trust of domain experts. Experts recog-
nised risks and uncertainties within predictions, but also the potentials of the visualisa-
tion. Besides, the experts identified several potential use cases such as understanding
how the product (e.g., grapes) may be characterised by different models, detecting
anomalies in data and unqualified products, and highlighting the problems within the
features of a model. One limitation of our tool is that it currently only deals with pre-
dicting continuous variables (regression). In future work, we will extend it to deal with
classification problems. Moreover, we will also investigate other ways to incorporate
user feedback beyond the knowledge intervals. One possibility in this line of research
is using weak supervision [54], in order to make the most out of sometimes scarce but
rich expert feedback.
Acknowledgement
Funding for this research has been provided by the European Union’s Horizon 2020
research and innovation programme: BigDataGrapes Project (grant number 780751)
and the FWO - Research Foundation Flanders (grant number G0A3319N). Author De-
nis Parra was funded by ANID - Millennium Science Initiative Program (code ICN17 002)
and by ANID, FONDECYT (grant number 1191791).
21You can also read