Model-informed COVID-19 vaccine prioritization strategies by age and serostatus
←
→
Page content transcription
If your browser does not render page correctly, please read the page content below
medRxiv preprint doi: https://doi.org/10.1101/2020.09.08.20190629.this version posted September 10, 2020. The copyright holder for this
preprint (which was not certified by peer review) is the author/funder, who has granted medRxiv a license to display the preprint in perpetuity.

                                     It is made available under a CC-BY-NC-ND 4.0 International license .

          Model-informed COVID-19 vaccine prioritization strategies by
                            age and serostatus
                               Kate M. Bubar,1,2∗ Stephen M. Kissler,3 Marc Lipsitch3,4 ,
                               Sarah Cobey5 , Yonatan H. Grad3 , Daniel B. Larremore6,7∗
                1
                    Department of Applied Mathematics, University of Colorado Boulder, Boulder, CO, 80303, USA
                           2
                             IQ Biology Program, University of Colorado Boulder, Boulder, CO, 80309, USA
                                         3
                                           Department of Immunology and Infectious Diseases,
                                 Harvard T.H. Chan School of Public Health, Boston, MA, 02115, USA
                                             4
                                               Center for Communicable Disease Dynamics,
                                 Harvard T.H. Chan School of Public Health, Boston, MA, 02115, USA
                       5
                         Department of Ecology and Evolution, University of Chicago, Chicago, IL, 60637, USA
                    6
                      Department of Computer Science, University of Colorado Boulder, Boulder, CO, 80309, USA
                          7
                            BioFrontiers Institute, University of Colorado Boulder, Boulder, CO, 80303, USA

                                         ∗ To
                                           whom correspondence should be addressed;
                            E-mail: kate.bubar@colorado.edu and daniel.larremore@colorado.edu

               When a vaccine for COVID-19 becomes available, limited initial supply will raise the
               question of how to prioritize the available doses and thus underscores the need for
               transparent, evidence-based strategies that relate knowledge of, and uncertainty in,
               disease transmission, risk, vaccine efficacy, and existing population immunity. Here,
               we employ a model-informed approach to vaccine prioritization that evaluates the im-
               pact of prioritization strategies on cumulative incidence and mortality and accounts
               for population factors such as age, contact structure, and seroprevalence, and vaccine
               factors including imperfect and age-varying efficacy. This framework can be used to
               evaluate and compare existing strategies, and it can also be used to derive an optimal
               prioritization strategy to minimize mortality or incidence. We find that a transmission-
               blocking vaccine should be prioritized to adults ages 20-49y to minimize cumulative in-
               cidence and to adults over 60y to minimize mortality. Direct vaccination of adults over
               60y minimizes mortality for vaccines that do not block transmission. We also estimate
               the potential benefit of using individual-level serological tests to redirect doses to only
               seronegative individuals, improving the marginal impact of each dose. We argue that
               this serology-informed vaccination approach may improve the efficiency of vaccination
               efforts while partially addressing existing inequities in COVID-19 burden and impact.

                                                                      1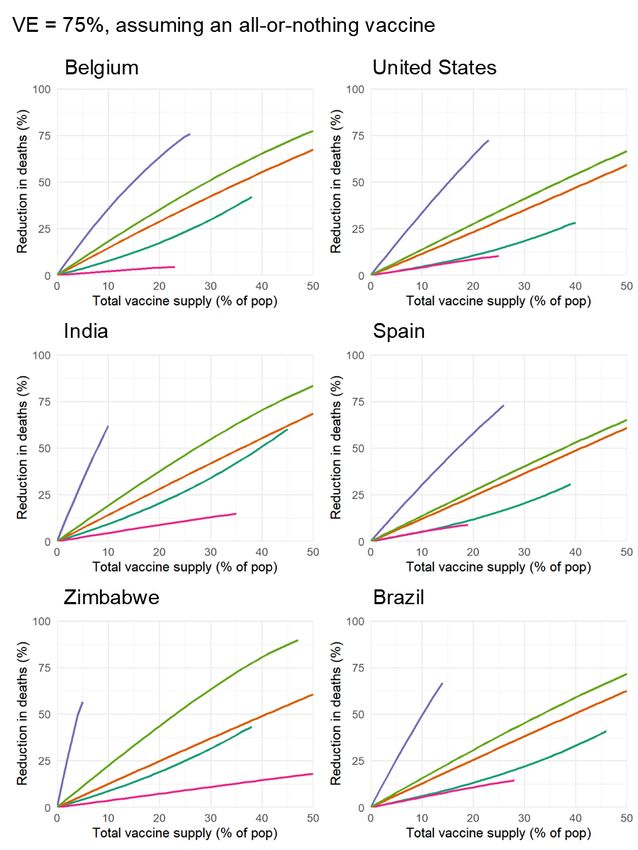
medRxiv preprint doi: https://doi.org/10.1101/2020.09.08.20190629.this version posted September 10, 2020. The copyright holder for this
preprint (which was not certified by peer review) is the author/funder, who has granted medRxiv a license to display the preprint in perpetuity.

                                     It is made available under a CC-BY-NC-ND 4.0 International license .

       Introduction

       SARS-CoV-2 has caused a public health and economic crisis worldwide. As of August 2020, there have

       been over 25 million cases and 820,000 deaths reported (1). To combat this crisis, a variety of non-

       pharmaceutical interventions have been implemented, including shelter-in-place orders, limited travel,

       and remote schooling. While these efforts are essential to slowing transmission in the short-term, long-

       term solutions—such as vaccines that confer immunity to SARS-CoV-2 infection—are urgently needed.

       As the benefits of an effective vaccine for individuals and their communities may result in high and

       widespread demand, it is critical that decision-making on vaccine distribution is transparent, particularly

       in the initial phases when vaccine availability may be limited (2).

            Here, we employ a model-informed approach to quantify the impact of COVID-19 vaccine prioriti-

       zation strategies on cumulative incidence and mortality. Our approach explicitly addresses variation in

       three areas that can influence the outcome of vaccine distribution decisions. First, we consider varia-

       tion in the performance of the vaccine, including its overall efficacy, a hypothetical decrease in efficacy

       by age, and the vaccine’s ability to block transmission. Second, we consider variation in the dynamics

       and outcomes of infection by incorporating variation in both susceptibility to infection and the infec-

       tion fatality rate by age. Third, we consider variation in the population, including the age distribution,

       age-stratified contacts, and the existing fraction of seropositive individuals, with uncertainty, by age.

            There are two main approaches to vaccine prioritization: (1) directly vaccinate those at highest risk

       and (2) protect them indirectly by vaccinating those who do the most transmitting. For influenza, model-

       based investigations of the tradeoffs between these strategies have led to recommendations that children

       be vaccinated due to their critical role in transmission (3, 4). In the context of COVID-19 vaccination,

       Matrajt et al. found that the tradeoff depends on vaccine efficacy, recommending direct vaccination of

       the elderly when the vaccine is ineffective but indirect protection otherwise (5), while Gallagher et al.

       showed the importance of indirect effects more broadly (6). The problem of vaccine prioritization also

                                                                      2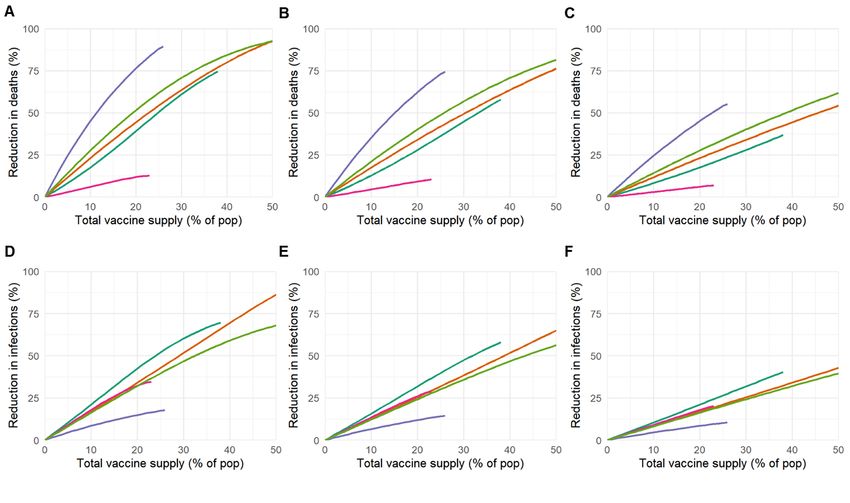
medRxiv preprint doi: https://doi.org/10.1101/2020.09.08.20190629.this version posted September 10, 2020. The copyright holder for this
preprint (which was not certified by peer review) is the author/funder, who has granted medRxiv a license to display the preprint in perpetuity.

                                     It is made available under a CC-BY-NC-ND 4.0 International license .

       bears parallels to the more general problem of optimal resource allocation to reduce transmission, e.g.

       with masks (7).

            Our approach expands on previous literature in a number of ways. First, our model includes age-

       stratified seroprevalence data and hypothetical age-varying vaccine efficacy. Second, we demonstrate

       the generalizability of our model and recommendations by evaluating numerous geographic regions.

       Third, we consider how the use of serological testing prior to vaccination can re-prioritize doses to

       seronegative individuals, thereby increasing the effective number of available doses. Importantly, this

       serology-informed dose redirection has the potential to ameliorate existing inequities in the burden and

       impact of COVID-19. We identify an optimal vaccine allocation strategy and also evaluate five heuristic

       strategies which, while sub-optimal, may be easier to implement.

       Results

       We evaluated the impact of vaccine prioritization strategies using an age-stratified SEIR model, because

       age has been shown to be an important predictor or correlate of susceptibility (8–10), seroprevalence

       (8, 11), severity (12–14), and mortality (15, 16). This model includes an age-dependent contact matrix,

       susceptibility to infection, and infection fatality rate (IFR), allowing us to estimate cumulative incidence

       and mortality via forward simulations. Cumulative incidence and mortality were then used as outcomes

       by which to compare the impacts of vaccine prioritization strategies (see Methods).

            We first examined the impact of five straightforward vaccine prioritization strategies for a hypotheti-

       cal infection- and transmission-blocking vaccine of varying efficacy. The strategies prioritized vaccines

       to children and teenagers, adults between ages 20 and 49, adults of 20 years or older, adults of 60 years or

       older, and all individuals irrespective of age (all ages; see Figure 1A). Although not exhaustive, these five

       strategies balance logistical simplicity while capturing a diverse set of possible outcomes from vaccine

       safety and efficacy trials.

            We measured the reductions in cumulative incidence and mortality achieved by each strategy, varying

                                                                      3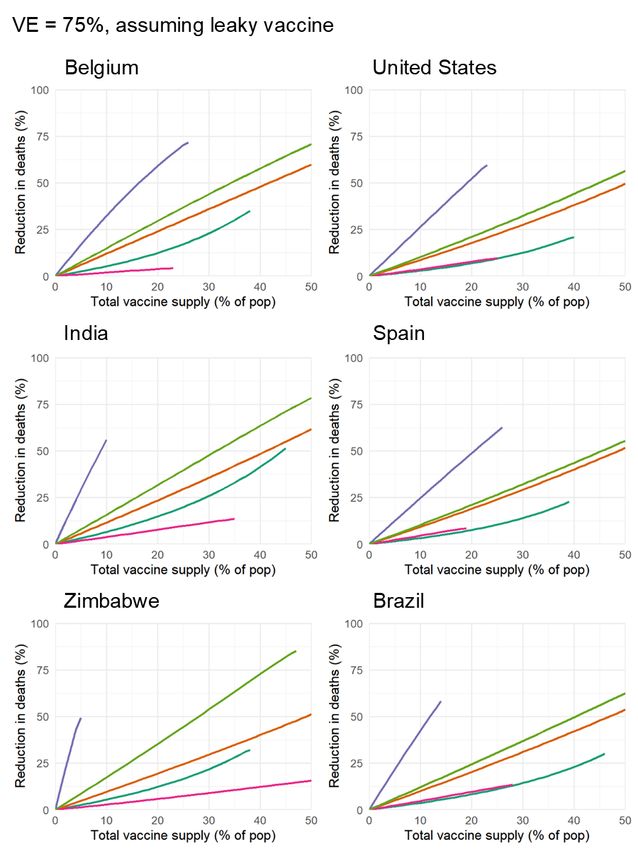
medRxiv preprint doi: https://doi.org/10.1101/2020.09.08.20190629.this version posted September 10, 2020. The copyright holder for this
preprint (which was not certified by peer review) is the author/funder, who has granted medRxiv a license to display the preprint in perpetuity.
It is made available under a CC-BY-NC-ND 4.0 International license .
Figure 1: Evaluation and Comparison of Prioritization Strategies (A) Distribution of vaccines for five
prioritization strategies: under 20, adults 20-49y, adults 20+, adults 60+ and all ages. For each strategy,
vaccines were distributed to the age groups of interest in proportion to population demographics. (B,
C, D) Percent reduction in deaths and (E, F, G) percent reduction in infections in comparison to an
unmitigated outbreak for an all-or-nothing vaccine with (B, E) 100% efficacy, (C, F) 75% efficacy, and
(D, G) 50% efficacy. Scenario includes country-specific contact matrix and demographics for Belgium
(17,18), and age-dependent susceptibility (9) and IFR (15). The lines end once everyone in the age group
has been vaccinated.
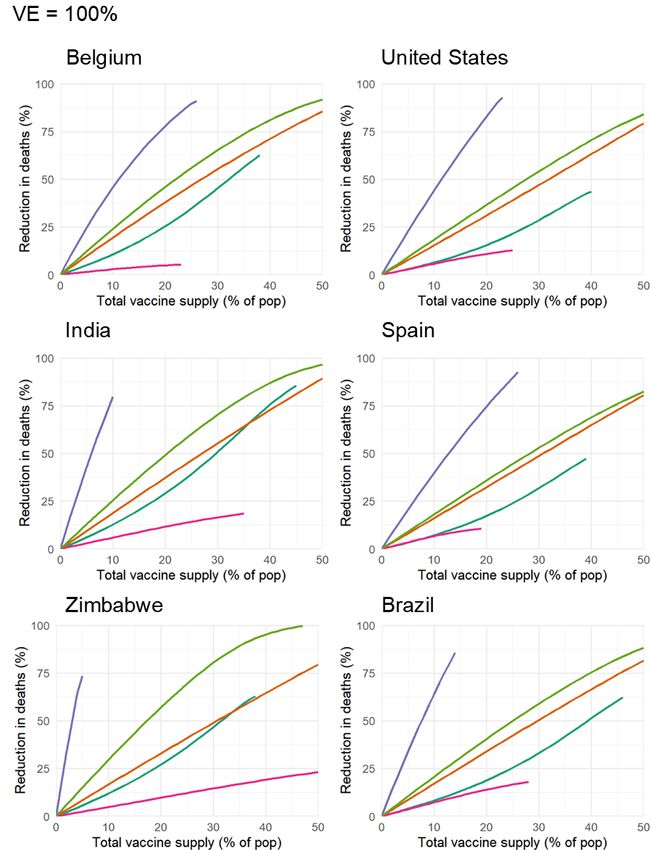
the vaccine supply between 1% and 50% of the total population, and varying vaccine efficacy of 100%,
75%, and 50%, assuming that vaccines were administered before transmission begins in the population.
We considered two ways to implement vaccine efficacy ve less than 100%: as an all-or-nothing vaccine,
where the vaccine only protects ve percent of people, or as a leaky vaccine, where vaccinated people are
ve percent protected against infection (see Methods).
Among the five strategies evaluated, and across all combinations of vaccine supply and vaccine
efficacy, direct vaccination of adults 60 years and older consistently reduced mortality substantially more
than alternative strategies (Figure 1B-D), followed by vaccination of adults 20+. In contrast, to minimize
4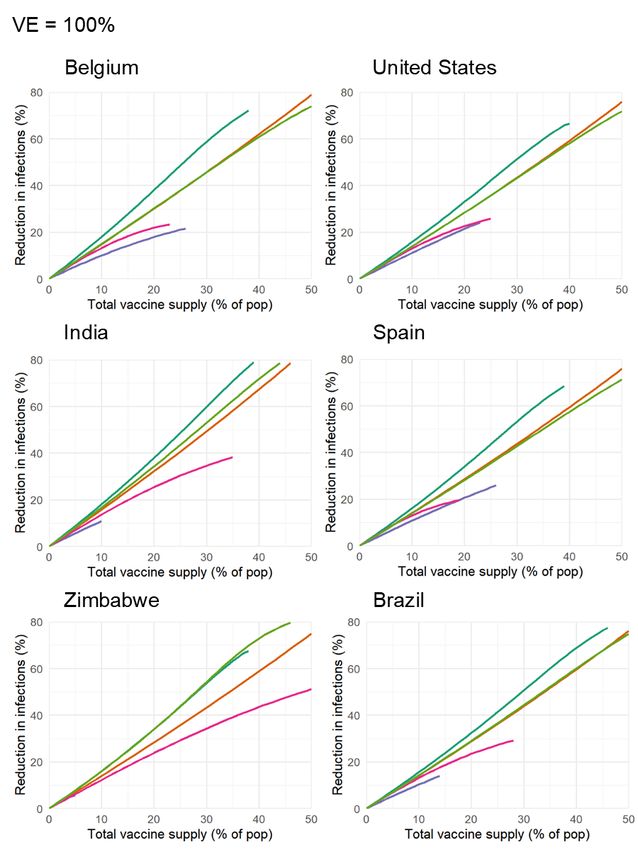
medRxiv preprint doi: https://doi.org/10.1101/2020.09.08.20190629.this version posted September 10, 2020. The copyright holder for this
preprint (which was not certified by peer review) is the author/funder, who has granted medRxiv a license to display the preprint in perpetuity.

                                     It is made available under a CC-BY-NC-ND 4.0 International license .

       cumulative incidence, vaccination of adults 60+ performed the worst across all levels of vaccine efficacy.

       For an all-or-nothing vaccine, prioritizing adults 20-49y minimized cumulative incidence across all levels

       of vaccine supply and vaccine efficacy (Figure 1E,F,G). However, for a leaky vaccine with 50% efficacy,

       prioritizing children and teenagers minimized cumulative incidence (Supplementary Figure S5).

            To determine whether our findings were robust across countries, we analyzed the ranking of pri-

       oritization strategies for demographics and modeled contact structures of Belgium (Figure 1) as well

       as the United States, India, Spain, Zimbabwe and Brazil. Across these countries, direct vaccination of

       adults 60+ minimized mortality irrespective of vaccine supply and for both types of vaccine efficacy at

       100%, 75% and 50% (Supplementary Figs. S1, S2, S3, S4, and S5). Similarly, across countries, vaccina-

       tion of adults 20-49y minimized infections for all levels of efficacy when assuming a perfectly effective

       vaccine or an all-or-nothing vaccine with 75% and 50% efficacy (Supplementary Figures S6, S7, S9).

       However, vaccinating children and teenagers was superior for a 50% effective leaky vaccine (Supple-

       mentary Fig. S10), with no consistent best strategy for a 75% effective leaky vaccine (Supplementary

       Fig. S8). The ranking of prioritization strategies thus depends on interactions between local context and

       the properties of the vaccine.

            We also considered whether the rankings of prioritization strategies to minimize deaths would change,

       were a vaccine to block COVID-19 symptoms and mortality but not SARS-CoV-2 infection or transmis-

       sion (Supplementary Text S2 and Supplementary Fig. S12) and found no meaningful changes in the

       rankings of strategies.

            Vaccines may not be equally effective across age groups in preventing infection or transmission, a

       phenomenon known to affect influenza vaccines (19–22). To understand the impact of age-dependent

       vaccine efficacy, we incorporated a hypothetical linear decrease in efficacy of both infection and trans-

       mission prevention among those 60y and older (all-or-nothing: Figure 2A, leaky: Supplementary Figure

       S16). For all-or-nothing vaccines, the most effective strategies remained the prioritization of adults 20-

       49y to minimize cumulative incidence and the adults 60+ to minimize mortality.

                                                                      5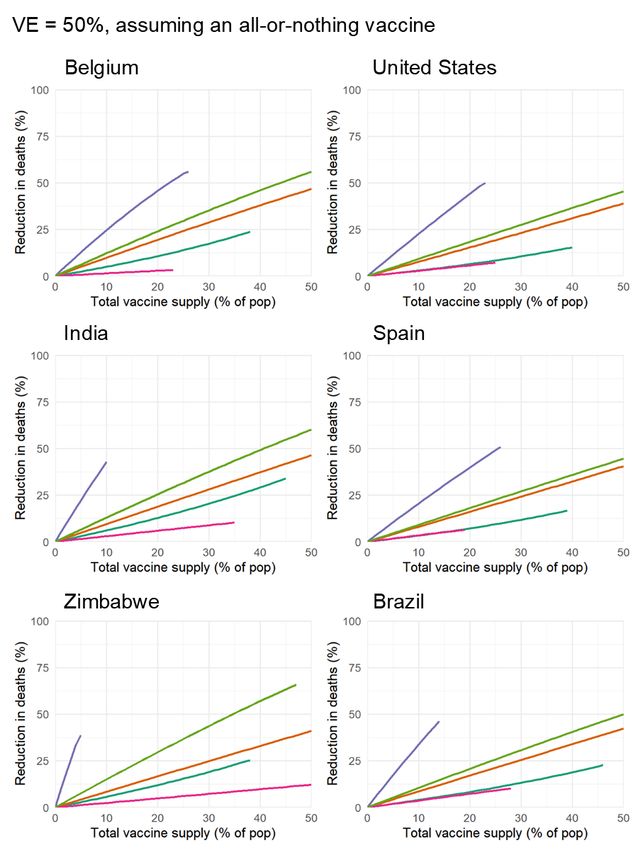
medRxiv preprint doi: https://doi.org/10.1101/2020.09.08.20190629.this version posted September 10, 2020. The copyright holder for this
preprint (which was not certified by peer review) is the author/funder, who has granted medRxiv a license to display the preprint in perpetuity.

                                     It is made available under a CC-BY-NC-ND 4.0 International license .

       Figure 2: Age-dependent vaccine efficacy (A) Here we consider two vaccines: a perfectly effective
       infection- and transmission- blocking vaccine (solid line), and a hypothetical age-dependent vaccine
       efficacy (dashed line), assuming an all-or-nothing vaccine efficacy that decreases stepwise in equal in-
       crements for each decade of age to a final ve of 50% for the 80+ age group. (B) Impact of these two
       vaccines on the reduction in death. There is no change when vaccinating those under 20 or adults 20-49y
       since the vaccine is assumed to work perfectly for those under 50 in both scenarios. Not pictured: Order
       of age-targeting strategies to minimize cases remains the same as in the base case, favoring prioritization
       of adults 20-49y.

            Decreasing vaccine efficacy in older age groups diminished the benefits of any prioritization strategy

       that included this age group (Figure 2B). The reduction in mortality changed most when prioritizing

       vaccines to adults 60+, hinting that there might be a tipping point such that direct vaccination of the

       adults 60+ would no longer be the best approach to minimizing mortality. We investigated a variety of

       hypothetical vaccine efficacy curves to determine whether such a tipping point existed and if so, the new

       mortality-minimizing strategy. Across various specifications of total vaccine supply, baseline vaccine

       efficacy, and decreased efficacy among the adults 60+, the majority of scenarios had no tipping point and

       continued to favor direct vaccination of the adults 60+ (Table 1 and Supplementary Table S2). However,

       especially for leaky vaccines, in scenarios characterized by (i) high vaccine supply, (ii) high efficacy

       for those under 50, (iii) onset of decreased efficacy at a relatively young age, and (iv) very low efficacy

       among the oldest, vaccination of adults over 20 became the mortality-minimizing strategy. This analysis

       therefore strongly suggests that direct vaccination of the adults 60+ is likely to be the most effective way

                                                                      6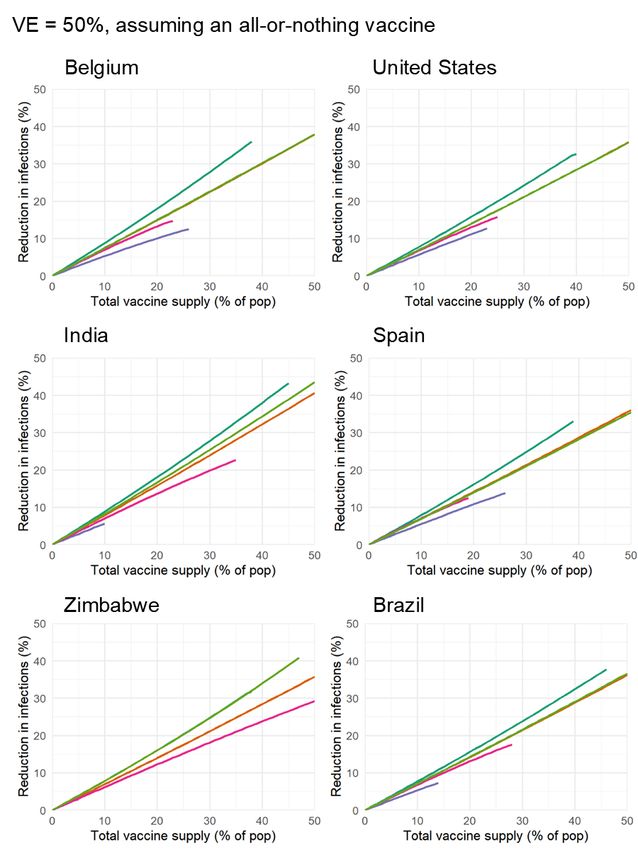
medRxiv preprint doi: https://doi.org/10.1101/2020.09.08.20190629.this version posted September 10, 2020. The copyright holder for this
preprint (which was not certified by peer review) is the author/funder, who has granted medRxiv a license to display the preprint in perpetuity.

                                     It is made available under a CC-BY-NC-ND 4.0 International license .

                                                                     Assuming an all-or-nothing vaccine.
                          Baseline efficacy        Hinge Age        Tipping point when vaccine supply is:
                                                                   5% of pop 15% of pop 25% of pop
                                                   59                   -            -             -
                          50%                      69                   -            -             -
                                                   79                   -            -             -
                                                   59                   -            -           0.8%
                          75%                      69                   -            -             -
                                                   79                   -            -             -
                                                   59                   -            -           3.9%
                          100%                     69                   -            -             -
                                                   79                   -            -             -

       Table 1: Vaccine efficacy tipping point for various vaccine efficacy curves, defined by the baseline effi-
       cacy and hinge age (See Supplementary Fig. S15). We define the tipping point as the vaccine efficacy
       in the 80+ age group where the best strategy to minimize deaths changes from prioritizing the adults
       60+ to adults 20+ to minimize deaths. “-” indicates that a tipping point does not exist. Model results
       using contact matrix and age demographic for Belgium (17,18), assuming an all-or-nothing vaccine (See
       Methods). See Supplementary Table S2 for leaky vaccine results.

       to minimize mortality.

            If naturally acquired antibodies correlate with protection from reinfection, seroprevalence will affect

       vaccine prioritization in two ways. First, depending on the magnitude and age distribution of seropreva-

       lence at the time of vaccine distribution, the ranking of strategies could change. Second, distributing

       vaccines to seropositive individuals would reduce the marginal benefit of vaccination per dose.

            To investigate the impact of vaccinating in mid-epidemic while potentially employing serology to

       target the vaccine to seronegative individuals, we included age-stratified seroprevalence estimates in our

       model by moving the data-specified proportion of seropositive individuals from susceptible to recovered

       status. We then simulated two approaches to vaccine distribution. First, vaccines were distributed ac-

       cording to the five prioritization strategies introduced above, regardless of any individual’s serostatus.

       Second, vaccines were distributed with a serological test, such that seropositive individuals would not be

       vaccinated, allowing their dose to be given to someone else. In a sub-population i with seroprevalence

       θi , reallocating vaccines in this manner leads to an effective gain of an additional θi /(1 − θi ) doses for

       each originally allocated dose.

                                                                      7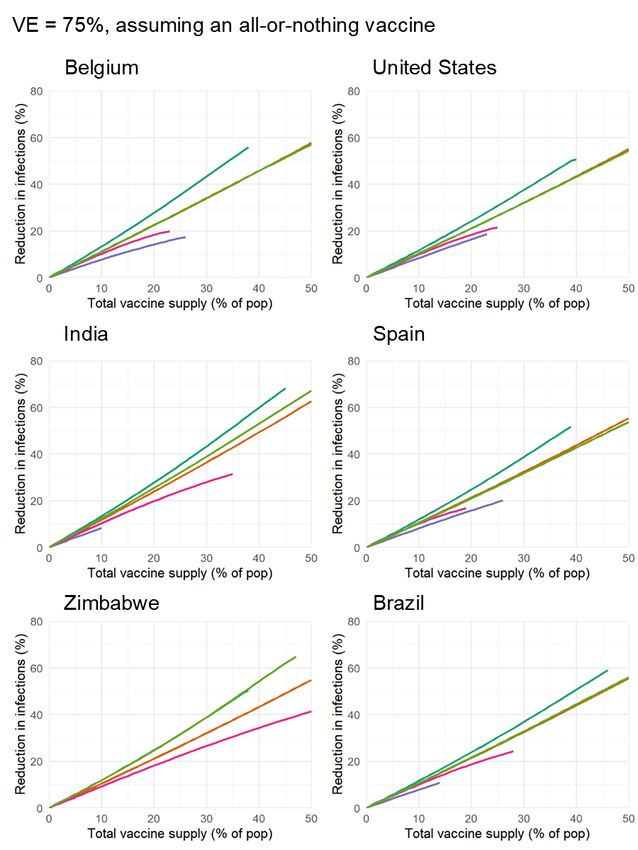
medRxiv preprint doi: https://doi.org/10.1101/2020.09.08.20190629.this version posted September 10, 2020. The copyright holder for this
preprint (which was not certified by peer review) is the author/funder, who has granted medRxiv a license to display the preprint in perpetuity.

                                     It is made available under a CC-BY-NC-ND 4.0 International license .

       Figure 3: Incorporating higher seroprevalence: Percent reduction in cumulative incidence and deaths
       when incorporating high age-dependent seroprevalence from New York City in August 2020 (mean =
       26.9%). Vaccines were distributed with (dashed) and without (solid) paired serology tests. Scenario
       includes contact matrix and demographics for the US, and New York City seroprevalence estimates (23)
       (See Table S1).

            We tested this serology-informed modeling approach by including age-stratified seroprevalence es-

       timates, demographics, and age-contact structure from New York City in August 2020 (23) (Figure 3)

       in evaluations of the previous five prioritization strategies. The ranking of strategies to minimize mor-

       tality (Figure 3A) and incidence (Figure 3B) remained unchanged: prioritizing adults 60+ most reduced

       mortality and prioritizing adults 20-49y most reduced incidence, regardless of whether vaccination was

       limited to only seronegative individuals. These rankings were unchanged when we used age-stratified

       seroprevalence estimates, demographics, and age-contact structure from Belgium in July 2020 (Supple-

       mentary Figure S13) to test the consistency of results.

            Preferentially vaccinating seronegative individuals yielded large additional reductions in cumulative

       incidence/mortality in locations with higher seroprevalence (New York City (23), August 2020 mean:

       26.9%, Fig. 3) and modest reductions in locations with low seroprevalence (Belgium (11), July 2020

       mean: 4.5%, Fig. S13). These results remained unchanged when statistical uncertainty, due to sample

       size and imperfect test sensitivity and specificity, were incorporated into the model (24) (Fig S13).

            Rather than adhering to one of the five pre-specified strategies, we next asked whether an optimal

                                                                      8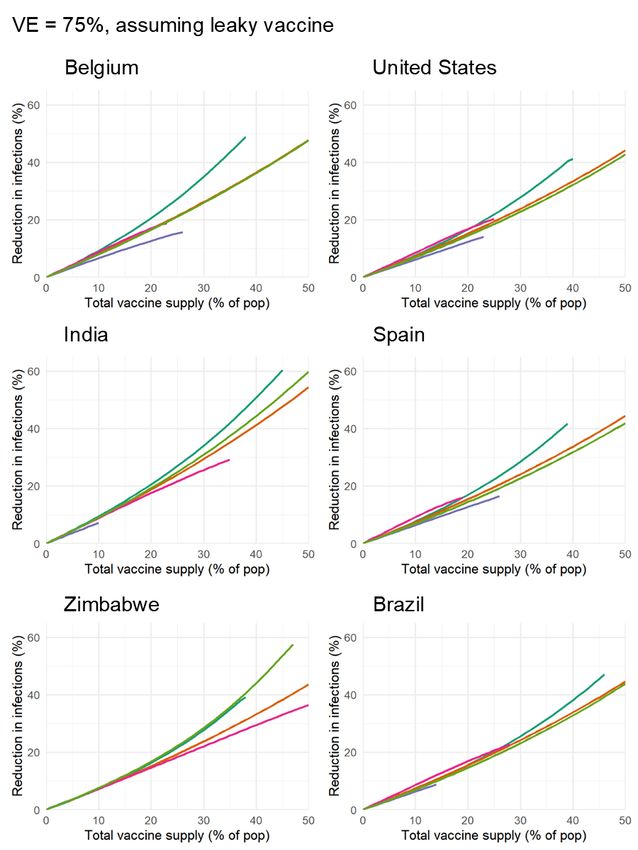
medRxiv preprint doi: https://doi.org/10.1101/2020.09.08.20190629.this version posted September 10, 2020. The copyright holder for this
preprint (which was not certified by peer review) is the author/funder, who has granted medRxiv a license to display the preprint in perpetuity.

                                     It is made available under a CC-BY-NC-ND 4.0 International license .

       Figure 4: Optimal allocation for minimizing cases: (A) Optimal vaccine distribution for three vaccine
       supplies: 10% (top), 20% (middle), 30% (bottom). (B) Percent reduction in cases when vaccines are
       distributed according to the optimization algorithm (yellow) and the five straightforward strategies. (C)
       Percent of each age group to vaccinate to minimize infections. Scenario includes country-specific contact
       matrix and demographics for Belgium (17, 18).

       prioritization existed which outperformed all others, given age-stratified data on serology, contact struc-

       ture, and demographics. To do so, we use a nonlinear optimization approach which searched over all

       possible prioritization strategies, subject to a specified total vaccine supply.

            To demonstrate the use of this optimization in practice, we computed optimal strategies using Bel-

       gian data, deriving incidence-minimizing strategies for vaccine supplies of 10%, 20% and 30% of the

       total population. For a 10% total supply, the optimal strategy immunizes only those aged 30-49 (Figure

       4A; top), while a 20% supply leads to expanded vaccination of some aged 10-29. A 30% total supply

                                                                      9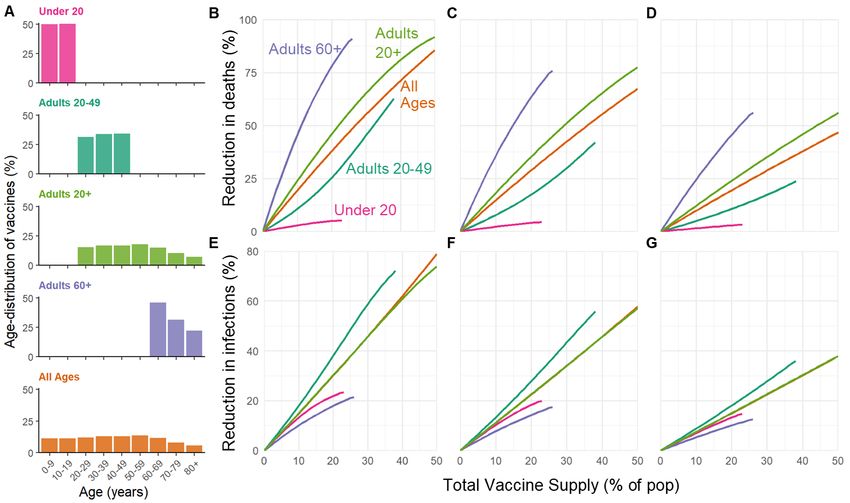
medRxiv preprint doi: https://doi.org/10.1101/2020.09.08.20190629.this version posted September 10, 2020. The copyright holder for this
preprint (which was not certified by peer review) is the author/funder, who has granted medRxiv a license to display the preprint in perpetuity.

                                     It is made available under a CC-BY-NC-ND 4.0 International license .

       leads to broader vaccination of those 10-49 with a small fraction of vaccines prioritized for those 50-

       59 (Figure 4A; bottom). All optimal strategies for minimizing incidence prioritize multiple age groups

       before completely vaccinating any given age group (Figure 4C). In contrast, to minimize mortality, vac-

       cines with equal efficacy across age groups should be prioritized to the oldest first, starting from the

       very oldest in the population and moving down the age range (Supplementary Fig. S14). The opti-

       mal strategy suppressed the epidemic at a vaccine supply of only 42% (Figure 4B), outperforming, as

       expected, the five pre-specified strategies. We caution that this optimal allocation strategy depends on

       country- and time-specific variables included in the modeled scenario (in this case, ve = 100% and R0 =

       2.6, and no age-dependence of efficacy), and of course on assumptions about age-specific susceptibility,

       transmissibility, etc.

       Discussion

       This study demonstrated the use of an age-stratified modeling approach to evaluate and compare vac-

       cine prioritization strategies for SARS-CoV-2. After accounting for country-specific age structure, age-

       contact structure, infection fatality rates, and seroprevalence, as well as the age-varying efficacy of a

       hypothetical vaccine, we found that across countries those 60y and older should be prioritized to min-

       imize deaths. This recommendation is robust because of the dramatic differences in IFR by age. Our

       model identified a few scenarios in which prioritizing all adults over 20 would provide greater mortal-

       ity benefits than prioritizing older adults. These scenarios were restricted to the conditions of a large

       enough vaccine supply, very low efficacy in older adults, very high efficacy in younger adults, and de-

       clines in efficacy starting at 49 or 59, for a leaky vaccine, and even more restrictive conditions for an

       all-or-nothing vaccine. Moreover, the advantage of prioritizing all adults vs. older adults was small even

       with these conditions. Thus, we conclude that for mortality reduction, prioritization of older adults is a

       robust strategy that will be optimal or close to optimal to minimize mortality for virtually all plausible

       vaccine characteristics.

                                                                      10
medRxiv preprint doi: https://doi.org/10.1101/2020.09.08.20190629.this version posted September 10, 2020. The copyright holder for this
preprint (which was not certified by peer review) is the author/funder, who has granted medRxiv a license to display the preprint in perpetuity.
It is made available under a CC-BY-NC-ND 4.0 International license .
In contrast, the ranking of infection-minimizing strategies depended on whether we considered an
all-or-nothing vaccine or a leaky vaccine. Modeling all-or-nothing vaccines led to consistent recommen-
dations to prioritize adults 20-49y across efficacy values and countries. However, for leaky vaccines, pri-
oritization shifted toward children and teenagers for vaccine efficacy of 50%, in line with prior work (5).
We also found that the transition point between top-ranked strategies varied by country demographics
and contact patterns when considering a leaky vaccine. Because a vaccine is likely to have properties
of both leaky and all-or-nothing models, empirical data on vaccine performance could help resolve this
difference in model recommendations, recognizing that such data are difficult to obtain in practice (see,
e.g. (25, 26)).
While any pre-specified age-based prioritization strategy can be evaluated using this model, we
showed how prioritization can be optimized to meet goals of either minimizing incidence or minimizing
death most efficiently. Critically, this approach showed that an incidence-minimizing strategy prioritizes
doses to those 10-59y, while a mortality-minimizing strategy prioritizes direct vaccination of the 60+
population. This finding is a consequence of the high infection fatality rates among the adults 60+ and
an inability of lower incidence alone to provide indirect protection. However, a vaccine with declining
efficacy among the elderly could change optimal strategies, highlighting the importance of age-stratified
estimates of vaccine efficacy.
Due to the expedited testing and approvals process, it is not yet clear whether the first-generation of
COVID-19 vaccines will be approved for the elderly or those under 18y (27, 28). While our conclusions
assumed that the vaccine would be approved for all age groups, both the evaluation and optimization
approaches introduced here can be tailored to evaluate a subset of approaches restricted to those within
the age groups for which a vaccine is licensed, using open-source tools such as those that accompany
this manuscript. Furthermore, we considered two possible goals of vaccination: minimizing cumulative
incidence or mortality. Our framework could also be adapted to include more morbidity, age-specific
data in order to consider other goals of vaccination, such as minimizing hospitalizations or economic
11medRxiv preprint doi: https://doi.org/10.1101/2020.09.08.20190629.this version posted September 10, 2020. The copyright holder for this
preprint (which was not certified by peer review) is the author/funder, who has granted medRxiv a license to display the preprint in perpetuity.
It is made available under a CC-BY-NC-ND 4.0 International license .
costs, or maximizing quality-adjusted life years.
We demonstrated that there would be value in pairing individual-level serological tests with vacci-
nation, inclusive of the uncertainties in existing seroprevalence surveys (24), particularly in locations
where seroprevalence rates are high. However, the marginal gain in effective vaccine supply, relative to
no serological testing, must be weighed against the challenges of serological testing prior to vaccination.
Delays in serological tests results would impair vaccine distribution.
Equitable vaccine distribution among social and demographic groups is a major concern for vaccine
allocation strategies, and one our model did not explicitly address. Nevertheless, vaccinating seronega-
tive individuals could help to ensure equitable allocation as long as natural infection confers protection
at least as good as vaccination and vaccines are distributed to specific geographical areas for exclu-
sively local use. For instance, in a hypothetical neighborhood with high seroprevalence, vaccinating
only seronegatives would extend the local positive direct and indirect benefits of vaccination, but only if
doses were reallocated locally. In this way, serology could allow locales which suffered larger burdens
to extend their doses further. We caution that changing distribution in response to seroprevalence and
rebalancing doses away from high seroprevalence neighborhoods could create a double blow of high
initial burden followed by seroprevalence-based deprioritization during vaccination.
Our recommended strategies depend on the contact matrix, which is affected by social distancing. We
used pre-pandemic contact matrices (17) with the goal of returning to normal life once a vaccine is avail-
able. The scenarios modeled here did not incorporate physical distancing or other non-pharmaceutical
interventions, which we would expect to persist if vaccination coverage is incomplete. Our framework
could easily be adapted to pandemic-era contact matrices like the CoMix survey (29). Doing so will
indeed be critical, as mobility restrictions fluctuate.
Our study relies on both global and country-specific estimates of epidemiological parameters and
therefore highlights key quantities that must be estimated as part of effective vaccine prioritization. In
local contexts, these include age-structured seroprevalence and IFR, which vary by geographic region
12medRxiv preprint doi: https://doi.org/10.1101/2020.09.08.20190629.this version posted September 10, 2020. The copyright holder for this
preprint (which was not certified by peer review) is the author/funder, who has granted medRxiv a license to display the preprint in perpetuity.
It is made available under a CC-BY-NC-ND 4.0 International license .
(15, 16, 30). Globally, key parameters include the degree to which antibodies protect against reinfection
or severity of disease and relative infectiousness by age. From vaccine trials, we also need evidence of
efficacy in groups vulnerable to severe outcomes, including the elderly. Additionally, it will be critical
to measure whether the vaccine protects only against symptomatic disease, or whether it also blocks
infection and transmission of SARS-CoV-2. If the vaccine does not block transmission or only protects
against severe infection, the public health community will need to clearly communicate this to the public
to discourage risky behavior that could increase negative externalities on the most vulnerable who cannot
be vaccinated.
The role of children during this pandemic has been unclear. Under our assumptions about suscepti-
bility by age, children are not the major drivers of transmission in communities. Thus, our results differ
from the optimal distribution for influenza vaccines, which prioritize school-age children and adults age
30-39 (4). However, both the relative susceptibility and relative infectiousness of SARS-CoV-2 by age
remain uncertain. While it is unlikely that susceptibility to infection is constant across age groups (8),
we ran our model to test the sensitivity of this parameter. Under the scenario of constant susceptibility
by age, vaccinating those under 20 has a greater impact on reducing cumulative cases than before, but
the overall ranking of strategies remains the same (Supplementary Figures S17, S18). In our model, we
assumed constant infectiousness (conditional on contact) by age, but a better understanding of this is
paramount to accurately modeling disease dynamics.
Our study is subject to a number of limitations. First, our evaluation and optimization strategy
considers variation in disease severity only by age. However, there are other factors that are have been
shown to correlate with disease outcomes, such as treatment and healthcare access and comorbidities,
which may correlate with factors like rural vs urban location, socioeconomic status, sex (31, 32), and
race and ethnicity (33), that are not accounted for in this study. Inclusion of these factors in a model
would be possible, but only with statistically sound measurements of both their stratified contact rates
and disease outcomes. Even in the case of age stratification, contact surveys have typically not surveyed
13medRxiv preprint doi: https://doi.org/10.1101/2020.09.08.20190629.this version posted September 10, 2020. The copyright holder for this
preprint (which was not certified by peer review) is the author/funder, who has granted medRxiv a license to display the preprint in perpetuity.
It is made available under a CC-BY-NC-ND 4.0 International license .
those 80 years and older, yet it is this population that suffers dramatically more severe COVID-19 disease
and higher infection fatality rates. We extrapolated contact matrices to those older than 80, but direct
measurements would be superior.
Our study also considers variation in disease risk only by age, via age-structured contact matrices,
while many discussions around COVID-19 vaccine distribution have thus far focused on prioritizing
healthcare or essential workers (34, 35). Contact rates, and thus transmission potential, vary greatly not
only by occupation and age but also by living arrangement (e.g., congregate settings, dormitories), neigh-
borhood and mobility (36–39), and whether the population has a coordinated and fundamentally effective
policy to control the virus. With a better understanding of population structure during the pandemic, and
risk factors of COVID-19, these limitations could be addressed. Meanwhile, the robust findings in favor
of prioritizing those age groups with the highest IFR to minimize mortality could potentially be extended
to prioritize those with comorbidities that predispose them to a high IFR, since the strategy of prioritizing
the older age groups depends on direct rather than indirect protection.
Vaccine prioritization is not solely a question of science but a question of ethics as well. A hallmark
of the COVID-19 pandemic, as with other global diseases, is one of inequalities and disparities. While
our modeling efforts incorporate key parameters that focus on age and minimizing incidence and death
within a simply structured population, other considerations are crucial, from equity in allocation between
countries down to disparities in access to the benefits of vaccination within individual communities.
Thus, the model’s simplistic representation of vulnerability (age) should be augmented over time with
better information on the correlates of infection risk and severity. Fair vaccine prioritization should avoid
further harming disadvantaged populations. We suggest that pairing serological testing with vaccination
in the hardest hit populations is one possible equitable way to extend the benefits of vaccination in
settings where vaccination might otherwise not be deemed cost-effective.
14medRxiv preprint doi: https://doi.org/10.1101/2020.09.08.20190629.this version posted September 10, 2020. The copyright holder for this
preprint (which was not certified by peer review) is the author/funder, who has granted medRxiv a license to display the preprint in perpetuity.
It is made available under a CC-BY-NC-ND 4.0 International license .
Methods
We used a continuous-time, ODE-based compartmental model stratified by age. The model compart-
ments (Si , Ei , Ii , Ri , Vi ), described below, represent mutually exclusive epidemiological states stratified
by age group i, i ∈ {0-9, 10-19, . . . , 70-79, 80+}. We assume that people are initially susceptible,
unless they have been effectively vaccinated or have infection-derived antibodies, assuming antibodies
are protective against reinfection. Susceptible people (S) transition to the exposed state (E) after effec-
tive contact with an infectious individual. After a latent period, exposed individuals become infectious
(I). After an infectious period, individuals move to a recovered state (R). We assume that recovered
individuals are no longer infectious and are immune to reinfection. The duration of time spent in each
compartment, in expectation, is specified in Table S1. Model equations were solved using lsoda ODE
solver from the package ‘deSolve’, R version 3.6.0 (40).
The force of infection, λi for a susceptible individual in age group i is
X Ij
λi = βi cij ,
Nj
j
where βi is the probability of a successful transmission given contact with an infectious individual, cij
is the number of age-j individuals that an age-i individual contacts per day, and Ij /Nj is the probability
that a random age-j individual is infectious. To calculate the basic reproductive number, R0 , we define
the next-generation matrix as
M = Dβ CDdI ,
where Dβ is a diagonal matrix with diagonal entries βi , C is the country-specific contact matrix, and
DdI is a diagonal matrix with diagonal entries dI , where dI is the infectious period. R0 is the absolute
value of the dominant eigenvalue of M .
We scaled the estimated age-susceptibility βi from Davies et al. (9) to obtain an R0 = 2.6 in Belgium,
and used the same βi for all countries (29). Thus, the realized R0 changes by country according to the
contact matrix and demographics.
15medRxiv preprint doi: https://doi.org/10.1101/2020.09.08.20190629.this version posted September 10, 2020. The copyright holder for this
preprint (which was not certified by peer review) is the author/funder, who has granted medRxiv a license to display the preprint in perpetuity.
It is made available under a CC-BY-NC-ND 4.0 International license .
The R0 for SARS-CoV-2 has been estimated between 2.1 and 3.1, with a mean of 2.6 (29). We ran
the Belgian scenario for this range of R0 to test the sensitivity of our results. The ranking of the strategies
remained the same for all simulated values of R0 (Supplementary Fig. S11).
We used synthetic country-specific contact matrices from Prem et al. (17). These matrices include
four types of contact: home, work, school, and other. We combined their 5-year age bins into 10-
year age bins, and extrapolated an 80+ age group (See Supplementary Text S1). We used country age
demographics from the UN World Population Prospects 2019 (18).
We ran simulations to completion of the outbreak, when the total number of infectious people in
compartment I was less than 1. To compare the impact of different vaccination prioritization strategies,
we calculated the cumulative number of infections and deaths. To estimate the total number of deaths,
we multiplied the cumulative number of infections for each age group at the end of the simulation by an
age-dependent IFR (15), and thus assumed deaths negligibly impacted transmission.
In the simplest version of the model, the vaccine is assumed to be transmission- and infection- block-
ing, and to work with 100% efficacy. To incorporate vaccinations, we initialized the model by dividing
the total population of each age group between the susceptible compartment (S) and vaccinated compart-
ment (V ), according to the vaccine prioritization strategy and number of vaccines available. The model
was seeded with one infected person in each age group i, unless all age-i individuals were vaccinated.
We also implemented age-dependent vaccine efficacy, ve . A vaccine with less than perfect efficacy
can either be a leaky vaccine, where vaccinated people are ve percent protected against infection, or an
all-or-nothing vaccine, where the vaccine effectively protects ve percent of people but does not work
in (1- ve ) percent of people (See Supplementary Text S3). Since the vaccine efficacy is unknown at
this time, we ran simulations with both types of vaccine efficacy. The type of vaccine efficacy does
not change the ranking of the prioritization strategies (all-or-nothing vaccine: Results, leaky vaccine:
Supplementary Fig. S16).
To incorporate age-dependent vaccine efficacy, we used a three parameter vaccine efficacy curve to
16medRxiv preprint doi: https://doi.org/10.1101/2020.09.08.20190629.this version posted September 10, 2020. The copyright holder for this
preprint (which was not certified by peer review) is the author/funder, who has granted medRxiv a license to display the preprint in perpetuity.
It is made available under a CC-BY-NC-ND 4.0 International license .
define a baseline ve , hinge age and final ve (Supplementary Fig. S15). We assumed that the vaccine
efficacy starts at a baseline ve for all ages younger than the hinge age, then decreases stepwise in equal
increments for each decade of age to a final ve for the 80+ age group. We define the vaccine efficacy
tipping point as the final ve where the best strategy switches from vaccinating the adults 60+ directly to
minimize deaths. We estimated this point using the bisection method (41) for various for baseline ve and
hinge ages (Table 1 and S2).
To incorporate serology and compare areas with differing naturally-acquired immunity, we used
data and seroprevalence estimates from New York City and Belgium (11, 23). We inferred the true
seroprevalence distributions for these seroprevalence estimates when the sensitivity and specificity of
the antibody test was available, according to (24). To assess how sensitive the model results are to the
seroprevalence, we sampled from these distributions 100 times to get seroprevalence estimates for each
age group, and then ran the simulation forward for each estimate. To set our initialization parameters,
we moved the corresponding proportion of seropositive individuals into the recovered compartment, R.
There are two ways to implement a vaccination strategy with seropositive individuals in the popu-
lation: either vaccinate people regardless of serostatus, or pair the vaccine strategy with a serological
test. That way, if someone is seropositive, they will not be vaccinated under the assumption that innate
immunity is protective against reinfection. Without a paired serology test, the initial conditions for our
model were
Vi (0) = vi − Ni P (vaccinatedi )P (seropositivei ),
Ri (0) = seropositivei ,
for an age group i, where vi is the number of people of age i vaccinated according to a given vacci-
nation strategy, P (vaccinatedi ) is the probability that an individual of age i is vaccinated according to a
given vaccine allocation strategy, and P (seropositivei ) is the probability that a person of age i is seropos-
itive. If an individual is both seropositive and vaccinated, they are put in the recovered compartment, R.
17medRxiv preprint doi: https://doi.org/10.1101/2020.09.08.20190629.this version posted September 10, 2020. The copyright holder for this
preprint (which was not certified by peer review) is the author/funder, who has granted medRxiv a license to display the preprint in perpetuity.
It is made available under a CC-BY-NC-ND 4.0 International license .
Alternatively, when vaccinating with paired serology tests, the initial conditions are
Vi (0) = vi ,
Ri (0) = seropositivei .
Finally, we inverted the problem and asked: given serology, a certain vaccine efficacy, contact struc-
ture, and demographics, what would be the optimal prioritization of vaccines? For this, we used a con-
strained optimization algorithm cobyla from the package ‘NLopt’. The constraints on our system were
vaccinating a minimum of 0% and a maximum of 100% people in each age group, and fixing the total
amount of vaccine supply. For the constrained optimization, we initially allocated vaccines uniformly
across all age groups, with noise to make the initialization stochastic. Then, we ran the optimization
algorithm 50 times for vaccine supply varying between 1% and 50% of the population and stored the
allocation that performed best.
Acknowledgments
The authors wish to thank Sereina Herzog. The work was supported in part by the Interdisciplinary
Quantitative Biology (IQ Biology) PhD program at the BioFrontiers Institute, University of Colorado
Boulder. The work was supported in part by the Morris-Singer Fund for the Center for Communicable
Disease Dynamics at the Harvard T.H. Chan School of Public Health. Reproduction code is open source
and provided by the authors.
18medRxiv preprint doi: https://doi.org/10.1101/2020.09.08.20190629.this version posted September 10, 2020. The copyright holder for this
preprint (which was not certified by peer review) is the author/funder, who has granted medRxiv a license to display the preprint in perpetuity.
It is made available under a CC-BY-NC-ND 4.0 International license .
References
1. COVID-19 dashboard by the center for systems science and engineering at johns hopkins university.
Online, 2020 (accessed August 30, 2020). https://coronavirus.jhu.edu/map.html.
2. Roxanne Khamsi. If a coronavirus vaccines arrives, can the world make enough? Nature, 580:578–
580, 4 2020.
3. Derek Weycker, John Edelsberg, M. Elizabeth Halloran, Ira M. Longini, Azhar Nizam, Vincent
Ciuryla, and Gerry Oster. Population-wide benefits of routine vaccination of children against in-
fluenza. Vaccine, 23(10):1284 – 1293, 2005.
4. Jan Medlock and Alison P. Galvani. Optimizing influenza vaccine distribution. Science, 325, 2009.
5. Laura Matrajt, Julie Eaton, Tiffany Leung, and Elizabeth R Brown. Vaccine optimization for
COVID-19, who to vaccinate first? medRxiv, 2020.
6. Molly E. Gallagher, Andrew J. Sieben, Kristin N. Nelson, Alicia N. M. Kraay, Ben Lopman, Andreas
Handel, and Katia Koelle. Considering indirect benefits is critical when evaluating SARS-CoV-2
vaccine candidates. medRxiv, 2020.
7. Colin J. Worby and Hsiao-Han Chang. Face mask use in the general population and optimal resource
allocation during the COVID-19 pandemic. Nature Communications, 11(4049), 2020.
8. Edward Goldstein, Marc Lipsitch, and Muge Cevik. On the effect of age on the transmission of
SARS-CoV-2 in households, schools and the community. medRxiv, 2020.
9. Nicholas Davies, Petra Klepac, Yang Liu, Kiesha Prem, Mark Jit, and Rosalind M Eggo. Age-
dependent effects in the transmission and control of COVID-19 epidemics. Nature Medicine,
26(1205-1211), 2020.
19medRxiv preprint doi: https://doi.org/10.1101/2020.09.08.20190629.this version posted September 10, 2020. The copyright holder for this
preprint (which was not certified by peer review) is the author/funder, who has granted medRxiv a license to display the preprint in perpetuity.
It is made available under a CC-BY-NC-ND 4.0 International license .
10. Juanjuan Zhang, Maria Litvinova, Yuxia Liang, Yan Wang, Wei Wang, Shanlu Zhao, Qianhui Wu,
Stefano Merler, Cécile Viboud, Alessandro Vespignani, Marco Ajelli, and Hongjie Yu. Changes in
contact patterns shape the dynamics of the COVID-19 outbreak in China. Science, 368(6498):1481–
1486, 2020.
11. Sereina Herzog, Jessie De Bie, Steven Abrams, Ine Wouters, Esra Ekinci, Lisbeth Patteet, Astrid
Coppens, Sandy De Spiegeleer, Philippe Beutels, Pierre Van Damme, Niel Hens, and Heidi Theeten.
Seroprevalence of igg antibodies against sars coronavirus 2 in belgium: a prospective cross-sectional
nationwide study of residual samples. medRxiv, 2020.
12. Amber L. Mueller, Maeve S. McNamara, and David A. Sinclair. Why does COVID-19 dispropor-
tionately affect older people? Aging, 12(10):9959–9981, 2020.
13. Yang Liu, Bei Mao, Shuo Liang, Jia-Wei Yang, Hai-Wen Lu, Yan-Hua Chai, Lan Wang, Li Zhang,
Qiu-Hong Li, Lan Zhao, Yan He, Xiao-Long Gu, Xiao-Bin Ji, Li Li, Zhi-Jun Jie, Qiang Li, Xiang-
Yang Li, Hong-Zhou Lu, Wen-Hong Zhang, Yuan-Lin Song, Jie-Ming Qu, and Jin-Fu Xu. Associ-
ation between age and clinical characteristics and outcomes of COVID-19. European Respiratory
Journal, 55(5):2001112, 2020.
14. Jaana Westmeier, Krystallenia Paniskaki, Zehra Karaköse, Tanja Werner, Kathrin Sutter, Sebas-
tian Dolff, Marvin Overbeck, Andreas Limmer, Jia Liu, Xin Zheng, Thorsten Brenner, Marc M.
Berger, Oliver Witzke, Mirko Trilling, Mengji Lu, Dongliang Yang, Nina Babel, Timm Westhoff,
Ulf Dittmer, and Gennadiy Zelinskyy. Impaired cytotoxic CD8+ T cell response in elderly COVID-
19 patients. bioRxiv, 2020.
15. Andrew T Levin, Gideon Meyerowitz-Katz, Nana Owusu-Boaitey, Kensington B. Cochran, and
Seamus P. Walsh. Assessing the age specificity of infection fatality rates for COVID-19: Systematic
review, meta-analysis, and public policy implications. medRxiv, 2020.
20medRxiv preprint doi: https://doi.org/10.1101/2020.09.08.20190629.this version posted September 10, 2020. The copyright holder for this
preprint (which was not certified by peer review) is the author/funder, who has granted medRxiv a license to display the preprint in perpetuity.
It is made available under a CC-BY-NC-ND 4.0 International license .
16. Henrik Salje, Cécile Tran Kiem, Noémie Lefrancq, Noémie Courtejoie, Paolo Bosetti, Juliette
Paireau, Alessio Andronico, Nathanaël Hozé, Jehanne Richet, Claire-Lise Dubost, Yann Le Strat,
Justin Lessler, Daniel Levy-Bruhl, Arnaud Fontanet, Lulla Opatowski, Pierre-Yves Boelle, and Si-
mon Cauchemez. Estimating the burden of SARS-CoV-2 in France. Science, 369(6500):208–211,
2020.
17. Kiesha Prem, Kevin van Zandvoort, Petra Klepac, Rosalind M Eggo, Nicholas G Davies, Alex R
Cook, and Mark Jit. Projecting contact matrices in 177 geographical regions: an update and com-
parison with empirical data for the COVID-19 era. medRxiv, 2020.
18. United Nations Department of Economic and Social Affairs Population Division. World population
prospects. Online, 2019 (accessed August 30, 2020). https://population.un.org/wpp/.
19. Peter A. Gross, Alicia W. Hermogenes, Henry S. Sacks, and Joseph Lau. The efficacy of influenza
vaccine in elderly persons. Annals of Internal Medicine, 123(7):518–527, 1995. PMID: 7661497.
20. Jason K. H. Lee, Gary K. L. Lam, Thomas Shin, Jiyeon Kim, Anish Krishnan, David P. Greenberg,
and Ayman Chit. Efficacy and effectiveness of high-dose versus standard-dose influenza vaccination
for older adults: a systematic review and meta-analysis. Expert Review of Vaccines, 17(5):435–443,
2018. PMID: 29715054.
21. Th. M. E. Govaert, C. T. M. C. N. Thijs, N. Masurel, M. J. W. Sprenger, G. J. Dinant, and J. A.
Knottnerus. The Efficacy of Influenza Vaccination in Elderly Individuals: A Randomized Double-
blind Placebo-Controlled Trial. JAMA, 272(21):1661–1665, 12 1994.
22. Joseph A. Lewnard and Sarah Cobey. Immune history and influenza vaccine effectiveness. Vaccines,
6, 2018.
23. City of New York. COVID-19 data. Online, 2020 (accessed August 31, 2020). https://www1.
nyc.gov/site/doh/covid/covid-19-data-testing.page.
21medRxiv preprint doi: https://doi.org/10.1101/2020.09.08.20190629.this version posted September 10, 2020. The copyright holder for this
preprint (which was not certified by peer review) is the author/funder, who has granted medRxiv a license to display the preprint in perpetuity.
It is made available under a CC-BY-NC-ND 4.0 International license .
24. Daniel B Larremore, Bailey K Fosdick, Kate M Bubar, Sam Zhang, Stephen M Kissler, C. Jes-
sica E. Metcalf, Caroline Buckee, and Yonatan Grad. Estimating SARS-CoV-2 seroprevalence and
epidemiological parameters with uncertainty from serological surveys. medRxiv, 2020.
25. Dennis Ellenberger, Ronald A Otten, Bin Li, Michael Aidoo, I Vanessa Rodriguez, Carlos A Sariol,
Melween Martinez, Michael Monsour, Linda Wyatt, Michael G Hudgens, et al. HIV-1 DNA/MVA
vaccination reduces the per exposure probability of infection during repeated mucosal SHIV chal-
lenges. Virology, 352(1):216–225, 2006.
26. Kate E Langwig, Andrew R Wargo, Darbi R Jones, Jessie R Viss, Barbara J Rutan, Nicholas A
Egan, Pedro Sá-Guimarães, Min Sun Kim, Gael Kurath, M Gabriela M Gomes, et al. Vaccine
effects on heterogeneity in susceptibility and implications for population health management. mBio,
8(6), 2017.
27. Paula Span. Older adults may be left out of some COVID-19 trials. New York Times, 6 2020.
28. Hannah R Sharpe, Ciaran Gilbride, Elizabeth Allen, Sandra Belij-Rammerstorfer, Cameron Bissett,
Katie Ewer, and Teresa Lambe. The early landscape of coronavirus disease 2019 vaccine develop-
ment in the UK and rest of the world. Immunology, 160:223 – 232, 2020.
29. Christopher I Jarvis, Kevin Van Zandvoort, Amy Gimma, Kiesha Prem, CMMID COVID-19 work-
ing group, Petra Klepac, G James Rubin, and W John Edmunds. Quantifying the impact of physical
distance measures on the transmission of COVID-19 in the UK. BMC Med, 18(124), 2020.
30. Selene Ghisolfi, Ingvild Almas, Justin Sandefur, Tillmann von Carnap, Jesse Heitner, and Tessa
Bold. Predicted COVID-19 fatality rates based on age, sex, comorbidities, and health system capac-
ity. Center for Global Development, 2020.
31. Takehiro Takahashi, Mallory K. Ellingson, Patrick Wong, Benjamin Israelow, Carolina Lucas, Jon
Klein, Julio Silva, Tianyang Mao, Ji Eun Oh, Maria Tokuyama, Peiwen Lu, Arvind Venkataraman,
22medRxiv preprint doi: https://doi.org/10.1101/2020.09.08.20190629.this version posted September 10, 2020. The copyright holder for this
preprint (which was not certified by peer review) is the author/funder, who has granted medRxiv a license to display the preprint in perpetuity.
It is made available under a CC-BY-NC-ND 4.0 International license .
Annsea Park, Feimei Liu, Amit Meir, Jonathan Sun, Eric Y. Wang, Arnau Casanovas-Massana,
Anne L. Wyllie, Chantal B.F. Vogels, Rebecca Earnest, Sarah Lapidus, Isabel M. Ott, Adam J.
Moore, Yale IMPACT research team, Albert Shaw, John B. Fournier, Camila D. Odio, Shelli Farha-
dian, Charles Dela Cruz, Nathan D. Grubaugh, Wade L. Schulz, Aaron M. Ring, Albert I. Ko,
Saad B. Omer, and Akiko Iwasaki. Sex differences in immune responses that underlie COVID-19
disease outcomes. Nature, 2020.
32. Dimple Chakravarty, Sujit S. Nair, Nada Hammouda, Parita Ratnani, Yasmine Gharib, Vinayak
Wagaskar, Nihal Mohamed, Dara Lundon, Zachary Dovey, Natasha Kyprianou, and Ashutosh K.
Tewari. Sex differences in SARS-CoV-2 infection rates and the potential link to prostate cancer.
Communications Biology, 3(374), 2020.
33. Monica Webb Hooper, Anna Marı́a Nápoles, and Eliseo J. Pérez-Stable. COVID-19 and
Racial/Ethnic Disparities. JAMA, 323(24):2466–2467, 06 2020.
34. Melissa Jenco. CDC vaccine committee may prioritize health care workers for COVID-19 vaccines.
AAP News, 8 2020.
35. Jon Cohen. The line is forming for a COVID-19 vaccine. Who should be at the front? Science, 6
2020.
36. Sharmistha Mishra, Jeffrey C. Kwong, Adrienne K. Chan, and Stefan D. Baral. Understanding
heterogeneity to inform the public health response to COVID-19 in Canada. CMAJ, 192(25):E684–
E685, 2020.
37. Laura Hawks, Steffie Woolhandler, and Danny McCormick. COVID-19 in Prisons and Jails in the
United States. JAMA Internal Medicine, 180(8):1041–1042, 08 2020.
23medRxiv preprint doi: https://doi.org/10.1101/2020.09.08.20190629.this version posted September 10, 2020. The copyright holder for this
preprint (which was not certified by peer review) is the author/funder, who has granted medRxiv a license to display the preprint in perpetuity.
It is made available under a CC-BY-NC-ND 4.0 International license .
38. Hamada S Badr, Hongru Du, Maximilian Marshall, Ensheng Dong, Marietta M Squire, and Lau-
ren M Gardner. Association between mobility patterns and COVID-19 transmission in the USA: a
mathematical modelling study. The Lancet Infectious Diseases, 2020.
39. Jamie Ducharme. These maps show how drastically COVID-19 risk varies by neighborhood. Time,
2020. https://time.com/5870041/COVID-19-neighborhood-risk/.
40. R Core Team. R: A Language and Environment for Statistical Computing. R Foundation for Statis-
tical Computing, Vienna, Austria, 2019.
41. Kendall E. Atkinson. An Introduction to Numerical Analysis, chapter 2, pages 56–58. Wiley, 2
edition, 1989.
24medRxiv preprint doi: https://doi.org/10.1101/2020.09.08.20190629.this version posted September 10, 2020. The copyright holder for this
preprint (which was not certified by peer review) is the author/funder, who has granted medRxiv a license to display the preprint in perpetuity.
It is made available under a CC-BY-NC-ND 4.0 International license .
Supplementary Materials For:
Model-informed COVID-19 vaccine prioritization strategies
by age and serostatus
Kate M. Bubar,1,2∗ Stephen M. Kissler,3 Marc Lipsitch3,4 ,
Sarah Cobey5 , Yonatan H. Grad3 , Daniel B. Larremore6,7∗
1
Department of Applied Mathematics, University of Colorado Boulder, Boulder, CO, 80303, USA
2
IQ Biology Program, University of Colorado Boulder, Boulder, CO, 80309, USA
3
Department of Immunology and Infectious Diseases,
Harvard T.H. Chan School of Public Health, Boston, MA, 02115, USA
4
Center for Communicable Disease Dynamics,
Harvard T.H. Chan School of Public Health, Boston, MA, 02115, USA
5
Department of Ecology and Evolutionary Biology, University of Chicago, Chicago, United States
6
Department of Computer Science, University of Colorado Boulder, Boulder, CO, 80309, USA
7
BioFrontiers Institute, University of Colorado Boulder, Boulder, CO, 80303, USA
∗
To whom correspondence should be addressed;
E-mail: kate.bubar@colorado.edu and daniel.larremore@colorado.edu
S1 Extrapolating contact matrix to 80+
We made two adaptations to the contact matrices from Prem et al. (17) First, we combined their five year
age bins into ten year bins to match our model’s age bins. Second, we extrapolated their final age bin
(75+) to add an 80+ age bin. To extrapolate, we copied the contact rates from 70-79 y.o. to our new row
and column for 80+, along the diagonal. Then we filled in the end of our new row and column with the
70-79 y.o. contact rates with 0-9 y.o., assuming interactions with 0-9 y.o. are similar for people 70+.
Lastly, to account for increased housing in long term living facilities for 80+ y.o., we decreased their
contacts for 0-60 y.o. by 10% and added it to the 70 and 80 y.o. contacts. Thus, 80+ year-olds have
the same total number of contacts as 70-79 year-olds, but relatively fewer among 0-69-year-olds and
proportionally more among 70+ year-olds.
S2 Non-transmission blocking vaccine
We considered a vaccine that prevents severe manifestations of COVID-19 infection, including death,
but does not block transmission of SARS-CoV-2. To implement, we used an SEIR model according to
S1You can also read