Another Brick in the Wall - Where is the battleground at the next election? - Onward
←
→
Page content transcription
If your browser does not render page correctly, please read the page content below
Another Brick
 in the Wall
 Where is the battleground at
     the next election?
About Onward

Onward is a modernising think tank whose mission is to develop bold and
practical ideas to boost economic opportunity and strengthen communities in
all parts of the United Kingdom.

We are not affiliated to any party but believe in a mainstream conservatism. We
recognise the value of markets and support the good that government can do,
and believe that a strong society is the foundation of both. We want to seize the
opportunities of the future while preserving the accumulated knowledge of the
past. We believe that most people are hard-working, aspirational and decent,
but that many do not have the opportunities to fulfil their potential.

Our goal is to address the needs of the whole country: young as well as old;
urban as well as rural; in all parts of the UK – particularly places that feel
neglected or ignored in Westminster – by working with ordinary people
directly and developing practical policies that work.

Thanks

Onward is a small non-profit that relies on the generosity of our donors and
patrons to do our work. We are indebted, in particular, to our Founding
Patrons: Martyn Rose, Michael Spencer, David Meller, Bjorn Saven, Richard
Oldfield, Robert Walters, Tim Sanderson, James Alexandroff, Jason Dalby,
Graham Edwards, John Nash and Theodore Agnew. Without this philanthropic
support, our work would not be possible.
About the authors

James Blagden

James Blagden is Chief Data Analyst at Onward and leads the Future Politics
programme of work on the UK’s changing political geography. He previously
studied at the University of Southampton and holds a Masters degree in Public
Policy from the University of Reading.

Will Tanner

Will Tanner is the director of Onward. He previously advised the Prime Minister
Theresa May between 2013 and 2017, as a Special Adviser in the Home Office
and as Deputy Head of Policy in 10 Downing Street. He has also previously
worked for the leading communications firm, Portland, and for the independent
thinktank, Reform.

About Future Politics

Our work on the UK’s changing electoral geography led us to identify the
importance of the Red Wall and Workington Man ahead of the 2019 election.
The Future Politics programme is focused on the changing values and voting
patterns of the electorate and the future of the Union.
Endorsements

Rt Hon. The Lord Hague of Richmond

“This is a timely and clear-sighted report on the central issue in British
electoral politics – can the new Conservative coalition be maintained? It offers
a persuasive antidote to the idea that Tories can only succeed in the north at
the expense of the south, but carries its own warnings – this is important
reading for Conservatives.”

Rt Hon. Damian Green MP

“This is a fascinating snap-shot of the geography of where the next electoral
battleground is likely to be. It illustrates that genuine One Nation policies are
needed to take the Conservative message to all parts of the UK and that One
Nation politics is the best way to maximise support.”

Richard Holden MP

“As ever Onward are bang on the money with their analysis. There is a massive
opportunity to make further significant progress across Wales, the Midlands
and in the North of England. It is vital that the Conservative Party seizes this
major opportunity for the future.”

Simon Fell MP

“This essential report shows why the realignment in British politics is an
unfinished journey and is so important. The breaching of the Red Wall was a
significant moment, but there is further to go and we shall only get there if we
truly deliver on the promise of levelling up and speak for the communities who
have put their trust in us.”
Katherine Fletcher MP

“Since the 2019 General Election many North West MPs and I have chatted
about the near misses, seats where we believe we could have won with
additional structured effort. This fascinating report adds data and evidence to
those hunches and anecdotes, there is yet more opportunity in the Red Wall -
well worth a read.”

Rt Hon Matt Hancock MP

"We need to listen to the findings of this Onward report, that there are yet
more potential voters open to supporting the Conservative Party, but that we
Conservatives need to ensure we're attracting younger generations too. We
must engage with younger generations as, ultimately, they hold the keys to our
country’s future.”

Rt Hon Sir Robert Buckland MP

“The true strength of Conservatism is that it has a national appeal, as shown in
the 2019 result. Instead of wringing our hands, we should be embracing the
opportunity we have been given to implement One Nation policies. With
seriousness of purpose, and a clear plan, this can be done.”
Contents

Summary                                    1

Will the real Blue Wall please stand up?   5

A paler shade of blue                      14

Future battlegrounds                       31

Conclusion                                 54
Summary

Another brick in the wall   1
At the last election, the Conservatives swept to victory on the back of the fall of
the “Red Wall”, a cluster of seats in the North and Midlands of England that
shrugged off long-standing Labour incumbency to return Conservative MPs. It
was a seismic realignment of the British electorate that delivered a historic
fourth Conservative term and plunged Labour into existential crisis. The
battleground of British politics appeared to shift North.

But just over two years on, attention has swung back to the South of England,
towards the so-called “Blue Wall” of Conservative seats that many believe are
becoming vulnerable. This was heightened by the shock loss of Chesham and
Amersham and North Shropshire in 2021 and by the perception – right or
wrong – that “levelling up” means taking resources and political focus away
from some places and giving it to others.

This has called into question the durability and depth of the Conservatives’ new
electoral coalition – and raised fears that 2019 may in retrospect prove to be a
moment of pride before the fall. But is the conventional wisdom right? Was the
Conservatives’ regional pivot in 2019 the beginning or the end of the electoral
rotation? Has it gone too far, exposing the Conservatives’ Southern flank? Could
a doubling down on levelling up the economies of the North and Midlands
inadvertently lead to a levelling down of Conservative seat tallies in the South?
Is the “Blue Wall” even real, insofar as the “Red Wall” was before 2019?

To date there has been little attempt to answer these questions empirically.
This paper attempts to correct that using data from 2019 and historically. We
use election results and demographic data from 1983-2019 to take the long view
and analyse structural changes in the Conservative coalition. We also make use
of our extensive polling from November to December 2019, carried out by Stack
Data Strategy, to look in more detail at the last election – and the electoral
coalition it bequeathed.

Our results reveal the fundamentals of Britain’s post-2019 electoral geography,
rather than a commentary on more recent poll swings. In doing so, they offer a
corrective to those who argue that the Conservatives may have oversteered
towards the Red Wall - and indeed reinforce the case for a near-term strategy
focused in the North and Midlands at the next election. But our analysis –
crucially – also suggests that the prosperous commuter belt of the South of
England may not stay blue forever.

Another brick in the wall                                                         2
In both the short and medium term, this clearly points to a “one nation”
strategy that appeals to both North and South. As Onward showed in our study
of the 2019 General Election, No Turning Back, the centre-right coalition is
relatively united in both values and policy priorities. We find that:

●   There is no such thing as a “Blue Wall” in the South of England that mirrors
    the definition of the “Red Wall” identified before the 2019 election by James
    Kanagasooriam. This is not to say that there are no vulnerable Conservative
    seats in the South, or that if the tide goes out on the Conservative vote
    larger numbers of Southern seats would not fall. But there is no clear
    cluster of contiguous seats, where the Conservative vote share over-
    performs relative to demographic factors, and where constituencies have
    not regularly changed hands in recent years. In addition, although these
    seats are more Conservative than expected, they do not resemble typical
    Labour seats, and model-based predictions would not suggest that Labour
    is likely to win in many of them.

●   If the Blue Wall is anywhere, it is in the West Midlands rather than the
    London commuter belt. Using the same methodology that identified the
    Red Wall, we identify a group of seats where the Conservatives consistently
    over-perform relative to demographics in the West Midlands extending into
    Cheshire. This list of seats includes North Shropshire. They typically have
    larger majorities than Labour enjoyed in the Red Wall before the 2019
    election. But, while North Shropshire’s 41% majority made the seat seem out
    of reach for other parties, low turnout among 2019 Conservative voters
    meant that the party’s vote share fell by 31 points.

●   Based on the potential for large scale seat switches, the main battleground
    at the next election looks likely to be in the North and Midlands of England,
    with the Party’s 2019 gains at risk of switching back. We estimate that while
    there are 51 potential battleground seats in the North, there are only 19
    battleground seats in the South of England.

●   The risk to the Conservatives in the South appears to be overstated, at least
    in the short term. This is for two reasons. First, the left is fractured and
    cannibalises its own vote. We estimate that the Liberal Democrats are just
    as likely to compete with Labour as the Conservatives in the South of
    England. Second, the distribution of political liberals is less efficient than
    that of political conservatives. The Labour Party stacks up enormous
    majorities in Merseyside and London, but this doesn’t help them in marginal

Another brick in the wall                                                        3
seats elsewhere. This means that, if running on a purely left-liberal ticket,
    Labour would need to achieve an extraordinary 49.7% of the national vote
    to generate even a slim majority (by winning 320 seats).

●   But the Conservatives should not be complacent. The long-term trajectory
    across much of the South is heading away from the Conservative Party.
    Going back to 1983, we find that areas like Surrey, East and West Sussex,
    Buckinghamshire, Oxfordshire, Berkshire and London have been steadily
    trending away from the Party for several election cycles. In these parts of
    the country, there is a long-term secular decline in conservatism that puts
    their old heartland at serious risk.

As things stand today, given the outlook for living standards and the corrosive
effect of political scandals, the Conservatives should be more immediately
concerned about reinforcing their new Northern seats than losing their old
Southern strongholds.

Another brick in the wall                                                           4
Chapter 1 Will the real Blue Wall please stand up? Another brick in the wall 5
1. How to define the Blue Wall

Since the May elections, several pollsters and commentators have published
political research suggesting that the Conservatives are at risk of desertion or
defeat in a so-called “Blue Wall” of seats in the South of England. The use of this
term is a deliberate echo of the Red Wall concept coined by the pollster James
Kanagasooriam before the last election, which successfully predicted the fall of
swathes of Labour’s heartlands in the North and Midlands.

In these analyses, the “Blue Wall” is typically centred on the commuter belt
Conservative strongholds of Surrey, Hertfordshire and Buckinghamshire.
Beyond that, however, there is little agreement on how to define the Blue Wall
and different models give quite different results.

●   YouGov has defined the Blue Wall based on the following criteria: seats that
    backed Remain in 2016, which are located in the South of England, and
    whose electorate includes more than 25% of people with a degree. The
    resulting list includes 53 parliamentary seats, which YouGov
    interchangeably describes as either “Blue Wall” seats or “traditional
    heartland seats”.

●   The political analyst Steve Akehurst has identified the Blue Wall using a
    different set of criteria: seats held by the Conservatives since at least 2010,
    where Labour or the Liberal Democrats over-performed the national swing
    versus the Conservatives in both 2017 and 2019, and where the Conservative
    majority now stands at under 10,000 votes. This creates a different but
    overlapping list of 41 seats.

These analyses employ a markedly different methodological model to that
which identified the Red Wall prior to the 2019 election. In doing so, they risk
distorting the risks and opportunities for different parties, and shifting the
political debate onto areas that are - in reality - much less important for
understanding our politics than other parts of the country. There are three key
limitations that quickly become apparent:

First, mistaking strongholds for bellwethers. The Red Wall was focused on long-
standing Labour seats. But YouGov’s definition of the Blue Wall includes at least
10 seats that have been held by other parties in just the last 20 years, including
some that voted Labour or Liberal Democrat three times in a row when Tony

Another brick in the wall                                                         6
Blair was Prime Minister. Seats like Winchester, which was held by the Liberal Democrats between 1997 and 2010, are very different to the Red Wall seat of Newcastle-under-Lyme, which consistently voted Labour for 100 years. Second, they tend to overstate the importance of some demographic or political markers, such as education level and Brexit vote, at the expense of others. While both of those are good proxies, there are several other demographic factors that we would need to consider, including age, occupation, homeownership, and income. Third, they underplay the importance of seats falling to different parties. The reason the Red Wall was so important was the fact the seats fell unilaterally from Labour to the Conservatives, giving the latter a large majority. But, in the South, Labour and the Liberal Democrats could both be significant beneficiaries of Conservative decline. The relatively strong performance of the Liberal Democrats in the South East of England means that a Conservative loss is not quite the same as a Labour victory. Table 1: YouGov’s “Blue Wall” constituencies that have been held by other parties since 1997 Source: House of Commons Library, Onward analysis Constituency Last held by another party Kensington Labour 2017-2019 Winchester Liberal Democrat 1997-2010 Cheltenham Liberal Democrat 1992-2005 Finchley and Golders Green Labour 1997-2010 Hendon Labour 1997-2010 Stroud Labour 1997-2010 and 2017-2019 Truro and Falmouth Liberal Democrat 1997-2010 Harrow East Labour 1997-2010 Newbury Liberal Democrat 1993-2005 Lewes Liberal Democrat 1997-2015 Another brick in the wall 7
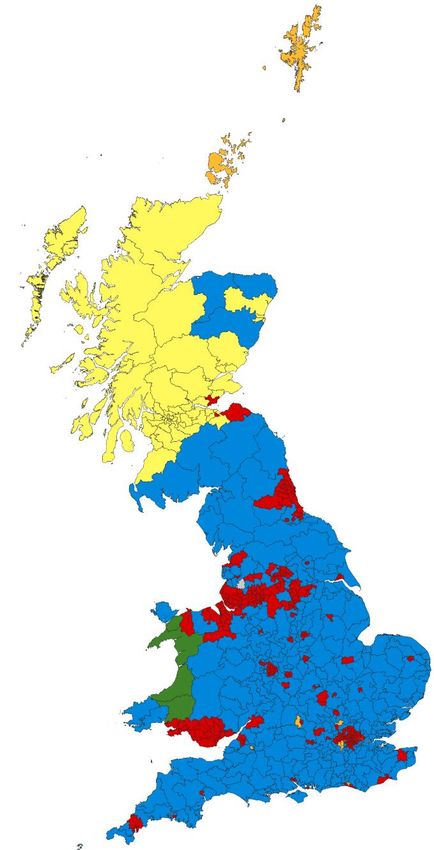
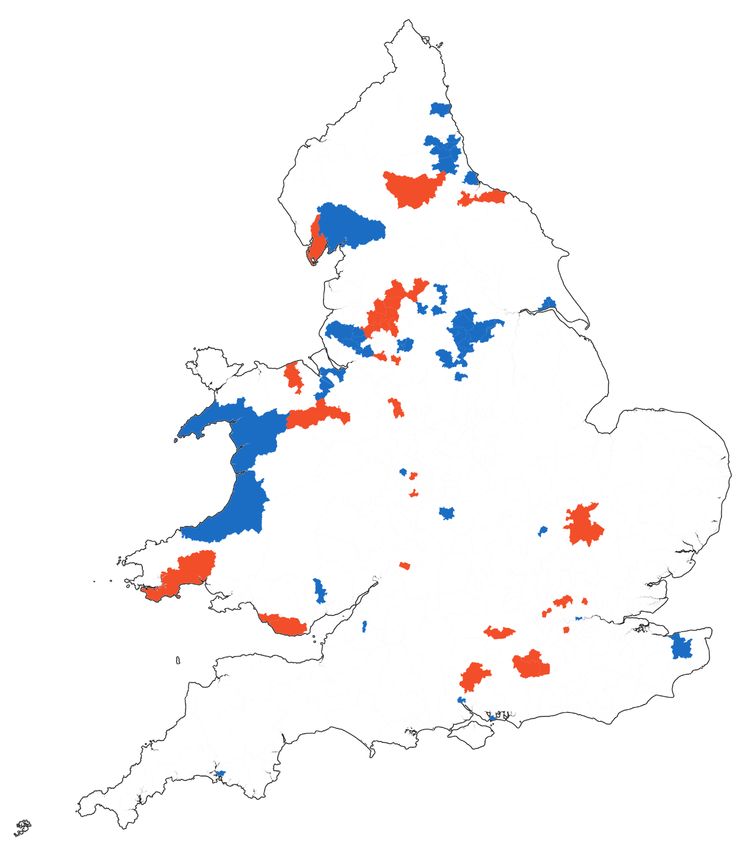
For these reasons, it is unlikely that either model will prove very useful in
determining Conservative vulnerability the next time voters go to the ballot
box. There is also a wider point. Dividing the country into “Red” and “Blue”
groups risks alienating voters based purely on geography – voters who broadly
share a common set of values and policy priorities despite living in different
parts of the country.

2. Applying the Red Wall methodology

As discussed earlier, the Red Wall was not just a geographic cluster of
constituencies that historically returned Labour MPs. Nor was it simply a
collection of marginal Labour seats, or even a group of marginal Labour seats
that had voted to Leave the EU. It identified a set of seats that on paper, based
on demographic markers, looked like Conservative seats. But, for cultural,
political, and hygiene factors they had consistently returned Labour MPs over
several electoral cycles.

This means that the Blue Wall, if it exists, will be a cluster of seats that are
demographically similar to seats held by parties other than the Conservatives
but have not returned another party for several decades. They should look like -
statistically speaking - Labour or Liberal Democrat seats but nonetheless have
historically voted Conservative. The key question is: do seats like this exist?

Using the same methodology that identified the Red Wall in 2019, we can
identify which seats over-perform their demographic fundamentals and
therefore might be vulnerable.

As you can see in Figure 1 below, there are 130 Conservative seats where the
party over-performed demographic fundamentals by 5 percentage points at the
2019 election. Looking at the left-hand map, there is an obvious (and quite
large) cluster of over-performing seats in the West Midlands extending into
Cheshire and North West Wales.

If we exclude from this West Midlands cluster all those seats that have been
held by other parties at various points since 1997, to remove bellwethers, this
gives us the 17 constituencies highlighted in dark blue in the right-hand map.

Another brick in the wall                                                           8
These seats have been held by the Conservatives since at least the 1980s, did
not turn to Labour even in 1997, and the party over-performed by more than 5
points in 2019.

Figure 1: Over-performing Conservative seats
All seats with residual >5%                                   ‘Blue Wall’

There are other areas too in which the party does better than expected: North
Yorkshire, Lincolnshire, the Home Counties, and around the Thames Estuary.
But these are not nearly as large as the group in the West Midlands and, when
we remove seats that have returned Labour or Liberal Democrat MPs in the last
20 years, they shrink even more.

In contrast to the Labour Party’s over-performance, which was mostly
clustered around the M62 corridor, Conservative over-performance is more
evenly distributed across the country.

Another brick in the wall                                                       9
This may be a function of the Conservatives’ more efficient vote distribution.
Labour generates impregnable majorities in Merseyside and London, whereas
Conservatives are spread thinner but more efficiently around the country. In
fact, Labour are three-times as likely as the Conservatives to have majorities
over 50%. After the 2019 election, 12% of Labour seats were won with majorities
larger than 50% (24 out of 202), but only 4% of Conservative seats are in the
same position (13 out of 365).

Even though the Conservative Party over-performs in parts of the West
Midlands and Cheshire, that does not mean we would expect these seats to
swing decisively to Labour. This is because the Conservatives enjoy much larger
majorities in many of these seats than the Labour Party did in the Red Wall
before the 2019 election, making them much more difficult to overturn – but
not impossible.

This suggests that if we interpret over-performance as a ‘correction waiting to
happen’, these seats are safe enough to withstand the type of swings seen in the
Red Wall in 2019. Low-turnout by-elections aside, the average 40% majority in
the Conservatives’ over-performing West Midlands cluster would be hard to
overturn in one election.

Another brick in the wall                                                     10
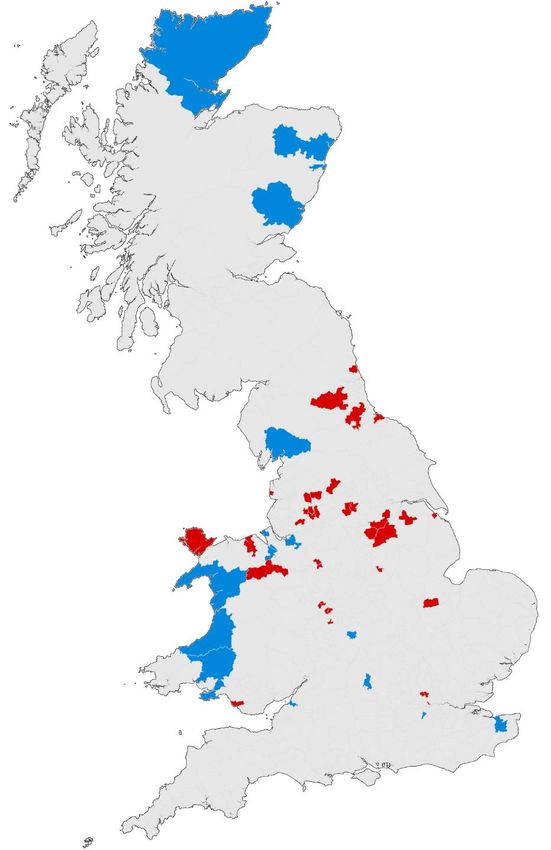
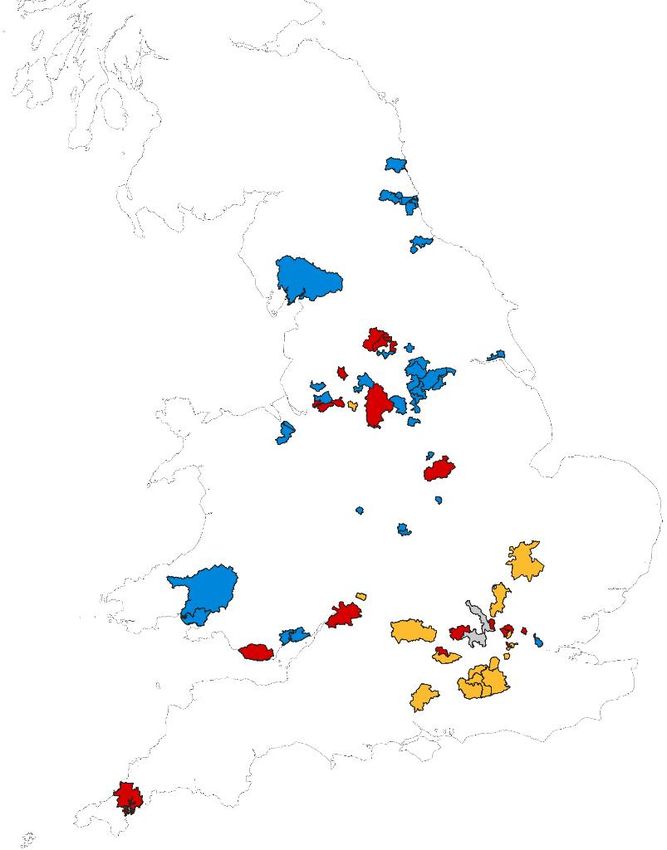
3. The difference between ideal and revealed preference

The absence of a Blue Wall is confirmed when we compare actual voting
behaviour in 2019 to a person’s “ideal” party.

In December 2019, we polled people on which party they would ideally vote for
if they disregarded the merits of particular candidates or the parties that
actually ran in their seat. We then ran an MRP with Stack Data Strategy on the
results to estimate the ideal party vote share in each constituency, and how
much parties benefited from “contract voting”- in which voters opted for a
party other than their ideal party to achieve a specific outcome (such as
delivering Brexit). We can therefore measure which party would have won if
you remove the effect of contract voting, and the main parties were reduced to
just their core “ideal” supporters.

Figure 2 shows which seats the Conservatives would have won (blue) and those
that they would have lost (red) in this scenario. Conservative losses are almost
entirely in the North of England, highlighting the reliance of their new coalition
on contract voting around Brexit and preventing a Corbyn victory. If this played
out exactly at a future election, the hypothetical losses would include some of
the most iconic 2019 gains, including Blyth Valley, Sedgefield and Great
Grimsby. But it would not include Workington, Bolsover or Bishop Auckland.

In Figure 3, we take a similar approach, but instead we calculate the difference
between actual Conservative vote share and estimated ideal Conservative vote
share. We can see that Conservative over-performance on this measure is
concentrated in the East of England, particularly in Kent, Essex, Lincolnshire,
and the Yorkshire coast. It also shows that most of the Home Counties are
about as Conservative as we would expect them to be. Or, in other words, most
of the tactical switching may have already taken place. In places like Esher and
Walton, Henley, Runnymede, and Guildford, this analysis suggests that the
Conservatives have already been whittled down to just their core supporters,
potentially making large reductions unlikely. Of course, if the demographic
profiles of these seats change in the future, then the ‘Conservative floor’ in such
places will shift downwards, unlocking more votes for other parties.

Another brick in the wall                                                        11
Figure 2: Conservative seats where a different party is the ‘ideal’ winner
(red) and other parties’ seats where the Conservatives are the ‘ideal’
winner (blue)

Another brick in the wall                                                12
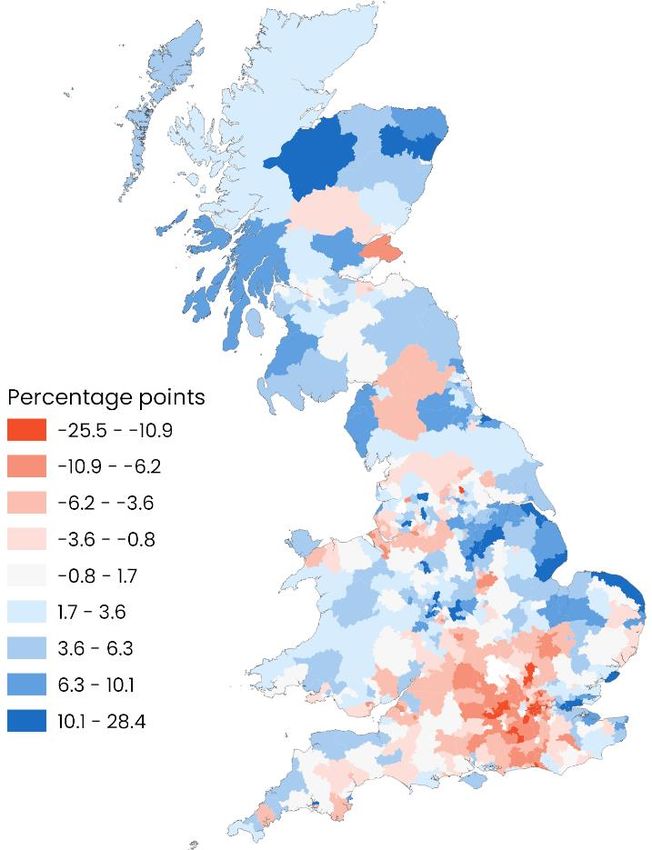
Figure 3: Percentage point gap between actual 2019 Conservative vote
share and estimated ideal vote share

                   2.3 – 9.6
                   9.6 – 11.4
                   11.4 – 12.5
                   12.5 – 14.1
                   14.1 – 15.7
                   15.7 – 17.2
                   17.2 – 19.6
                   19.6 – 29.3

Another brick in the wall                                              13
Chapter 2
A paler shade of blue
Another brick in the wall 141. Long-term demographic forces The demographic forces that propelled the Conservatives to victory in 2019 took time to translate into seat gains. By the same token, the changes we estimate in this paper will take time to undermine the Conservative vote. It is therefore worth asking in which seats we would expect demographics to pose a long-term challenge for the Conservatives. We know that at the last election characteristics like age, homeownership, ethnicity, and education strongly predicted voting behaviour, and we can use them to forecast likely effects into the future. We can estimate that if a Conservative constituency ticks all the following boxes, then it is likely to be at risk in the longer term (but not necessarily in the next cycle, or as a collapsing wall): • More young people (age 20-29) than average • Fewer older people (aged 60+) than average • Larger BAME population than average • More graduates than average • Fewer homeowners than average Figure 4 shows which seats are vulnerable based on this model. Please note that a constituency needs to have all four characteristics to be highlighted on the left-hand side below. As you can see, there seems to be a London/Home Counties archipelago of at-risk seats. But it also shows a slightly broader geographic spread than the ‘Southern Blue Wall’ commentary would suggest. Another option is to look at each seat’s changing composition since 2010. If a Conservative constituency has seen a faster-than-average increase in its share of young people and a decline (or slower increase) in the proportion of older people, become more ethnically diverse, and increased its share of graduates, then we can estimate that it is at risk of drifting away from the Conservatives. These seats are set out in the right-hand map of Figure 4, below. As you can see, while some of these seats are based around London, we also identify several constituencies in the North and Midlands that could become gains for other parties: Rushcliffe, Broxtowe, Heywood and Middleton, and Pudsey. This Another brick in the wall 15
further reinforces the point that worrying about a Blue Wall of seats in the
 South of England is myopic.

 Figure 4: Demographically at-risk seats
Based on current demographic profile                 Based on recent demographic trends

 2. Change over time

 We can also identify constituencies which have been shifting away from the
 Conservatives in past elections to expose seats that may yet be becoming more
 vulnerable. We look at Conservative vote share since 2010 as boundaries are
 consistent over that period, comparing both David Cameron’s pre-Brexit 2015
 majority with Boris Johnson’s post-Brexit 2019 majority and the change in vote
 share at each election.

 In Figures 5 and 6 below, we show the difference between 2015 and 2019 vote
 share, adjusted for national swing. This reveals which areas are more or less
 Conservative than they were pre-Brexit. Or to explain another way, in the
 context of the Conservatives gaining an average 7.1 percentage points across all
 GB constituencies between 2015-2019, if the Conservatives gained 1 point in a
 given seat, it would receive a value of -6.1pp (it became 6.1 points less
 Conservative than the average seat).

 Another brick in the wall                                                      16
This shows a cluster of seats in the Home Counties that have drifted away from
         the Conservative Party since 2015. This group looks a bit like YouGov’s Blue
         Wall. In fact, most of the seats that became 10 points less Conservative than
         average are in and around the Greater South East, except Altrincham & Sale
         West and Rushcliffe. This list includes two seats of former Conservative Prime
         Ministers – Witney and Maidenhead – while Uxbridge became 4.96 points less
         Conservative than average. By contrast, the Conservatives have strengthened
         their position all along the English east coast, around the Black Country, and
         Staffordshire.

Figure 5: Change in Conservative vote share      Figure 6: All 2019 Conservative seats that
2015-19, higher than average (blue) and          became 10 points less conservative than
lower than average (red)                         average compared to 2015

          Another brick in the wall                                                   17
Another way to look at this is to identify seats held by the Conservatives
continuously since 2010, which have nonetheless moved away from the party at
each election. Examples include Chipping Barnet and Aylesbury. The former
saw the Conservative vote decline in 2015, 2017 and 2019; the latter saw declines
in 2015 and 2019, and an increase of 4 percentage points in 2017. But, because
this was lower than the national swing of 5.5 points, we say that it became less
Conservative than the average seat.
Table 2: A closer look at Aylesbury and Chipping Barnet
Change in vote share
2010-15 2015-17 2017-19
Chipping Barnet -0.2% -2.3% -1.6%
Aylesbury -1.5% +4.0% -1.0%
National swing +0.8% +5.5% +1.2%
The map below shows all of the seats that have been held by the Conservatives
continuously since 2010 that also saw a change in Conservative vote share that
was lower than the national average in 2 elections (pale red) and 3 elections
(dark red). The eight seats that saw three consecutive declines in relative
Conservative vote share are listed alongside. Witney and Maidenhead are
shown in pale red in the map below, having seen relative Conservative vote
share decline in 2017 and 2019.
So there does seem to be a cluster of seats in the Home Counties that have
moved away from the Conservatives in recent elections. However, dig a little
deeper and the question becomes more complex:
• Most of the decline took place in 2017 and 2019, after the referendum. Of
these 83 seats shown in Figure 7, 68 saw Conservative vote share increase
faster than average in 2015 but then less than average in 2017 and 2019.
• Only two seats became more Conservative in 2017: Eddisbury and Richmond
(Yorks) in which their respective incumbents may have benefited from a
‘sophomore swing’.
• Five became more Conservative in 2019 (Basingstoke, East Devon, Rochford
& Southend East, Welwyn Hatfield, and Preseli Pembrokeshire), having
declined in 2015 and 2017.
Another brick in the wall 18Figure 7: Downward trend in Conservative vote share
Three consecutive declines
● Aylesbury
● Beckenham
● Bromley and Chislehurst
● Chesham and Amersham
● Chingford and Woodford Green
● Chipping Barnet
● North West Hampshire
● Worthing West
Note: This calculation subtracts the change in each seat’s Conservative vote share from the
nation-wide figure, plus one. We add the 1pp buffer to make sure we’re capturing seats that
have unambiguously swung away from the Conservatives, rather than borderline cases.
Among the eight seats that have trended away from the Conservatives at each
election since 2010, two were more Remain-voting than average (Chesham &
Amersham and Chipping Barnet) and two were more Leave-voting than average
(North West Hampshire and Worthing West). The remaining four were split
50:50, which suggests that Brexit is probably not the key driving factor
explaining the downward trend in these eight seats.
Another brick in the wall 19But among the 75 seats that drifted away from the Conservatives at two of the
three elections since 2010 (bearing in mind that most of this happened in 2017
and 2019, rather than 2015), 47% were more Remain-voting than average and
just 24% were more Leave-voting than average. The remaining 29% were split
50:50. The average Leave vote share is 47.6% in these seats. Figure 8 illustrates
this point.
Figure 8: Leave vote share in seats that became less Conservative than
average in at least 2 out of the last 3 elections
2010-15 2015-17 2017-19
10% 10% 10%
Relative change in Conservative vote share
Relative change in Conservative vote share
Relative change in Conservative vote share
R² = 0.0472
5% 5% 5%
R² = 0.6031 R² = 0.3427
0% 0% 0%
-5% -5% -5%
-10% -10% -10%
-15% -15% -15%
20% 30% 40% 50% 60% 70% 20% 30% 40% 50% 60% 70% 20% 30% 40% 50% 60% 70%
Leave vote share Leave vote share Leave vote share
The relationship between the change in Conservative support and Leave vote
share is strongest in 2015-17, which confirms that more Remain-leaning areas
swung away from the Conservatives following the referendum. A correlation
coefficient of -0.217 (R2 = 0.047) tells us that there is no relationship between
change in the Conservative vote 2010-15 and the 2016 Brexit vote among seats
held continuously 2010-19; if anything, the relationship is slightly negative.
Contrast this with the very tight, positive relationship between the 2015-17
change in vote share and 2016 Brexit vote (R2 = 0.603).
Another brick in the wall 20However, the relationship between 2017-19 swing and Leave vote is noticeably
weaker. It may be that a large portion of defections from the Conservatives to
other, more liberal, parties had already taken place. Add to this the above map
(Figure 3) comparing 2019 Conservative vote share and estimated ideal
Conservative vote share, which suggested that the Conservatives have already
been whittled down to only their core supporters in many of the Remain-
leaning Home Counties seats. Rather than an increasing number of
Conservative voters switching allegiance at future elections, liberal parties may
in fact experience diminishing marginal returns.
3. The fall of the real Blue Wall - in 1997
In an important sense, the Blue Wall fell in 1997. London was more Conservative
than the national average at every election between 1974 and 1997, and has been
less Conservative than average at every election since then. In 1997, many long-
time Conservative seats flipped red and never returned, switching London’s
position almost overnight. And Brexit has turbo-charged this divergence since
2016. To put this into context:
• In 1987, the Conservatives held 69% of London seats and 46% of the votes.
But the capital swung hard to Labour in 1997. The decline in vote share and
proportion of seats was steeper in London than it was nationally.
• In 1992, the Conservatives were +3.4 points above average for vote share in
London and +5.5 points above average for the proportion of seats held;
these figures fell to +0.5 points and -10 points respectively in 1997.
• Relative performance declined at each successive election from 2005 to
2019. As the Conservative Party picked up seats elsewhere throughout the
2000s, it failed to replicate this in London.
• In 2019, Conservatives won 56% of all UK seats but just 29% of London
seats, which means that their current under-performance in London is
twice the size of their over-performance in 1987 (-27% vs +11%,
respectively).
• The Conservatives have never held a smaller share of London seats, while
being in Government, than they do now.
Another brick in the wall 21Figure 9: Conservative vote share and seats share in London, compared
to national average
Share of seats Vote share
15% 6%
10% 4%
5% 2%
0% 0%
-5% -2%
-10% -4%
-15% -6%
-20% -8%
-25% -10%
-30% -12%
2010
2015
1974O
2010
2015
1966
1974F
1974O
2017
2019
1966
1974F
2017
2019
1979
1979
1970
2001
2005
1970
2001
2005
1992
1997
1997
1983
1983
1992
1987
1987
To look closer at the London Blue Wall, we ran a linear regression to identify
seats where the Conservative Party performed better than expected in 1987,
based on demographics. We used local data on characteristics like age, class,
unemployment, marital status, car ownership and housing tenure. The gap
between predicted vote share and actual vote share (the residual) gives us our
measure of Conservative ‘over-performance’ or ‘under-performance’.
Figure 11 shows that Conservatives over-performed in 49 of their 60 London
seats. If we define the London Blue Wall very narrowly as seats held by
Conservatives in 1987, in which they over-performed by more than 5%, we get a
list of 33 seats. It looks like there was indeed a correction waiting to happen.
Seven of these seats fell in 1992. Although boundaries changed, we can translate
this list of 33 into the roughly equivalent 32 seats on 1997 boundaries. Only 10 of
the 32 (31%) remained Conservative after Tony Blair swept to victory.
Another brick in the wall 22This process looks similar to what happened to the Conservatives in Merseyside
between the 1970s and 1990s, where Labour support spread outwards from the
city to the suburbs. Looking forward, non-Conservative voting behaviour could
continue to spill over from the city – partly through urban sprawl and improved
transport that makes Surrey feel more like an extension of London – and also
through population shifts of liberal-minded professionals moving beyond the
GLA and taking their politics with them.
Figure 10: Forty years of election results in London
1987 1997 2019
Conservative Labour Liberal
Figure 11: Where was the London Blue Wall?
Conservative residual in seats they All over-performing Conservative Seats with a residual >5%
held in 1987 seats
Another brick in the wall 235. The slow and sudden collapse of the Red Wall
In the opposite trend to outer London, Red Wall seats have been moving
towards the Conservatives over the last 10 years.
Figure 12 below shows Conservative vote share in the Red Wall increasing from
28% in 2010 (8 points below average) to 42% in 2019 (just 1.7 points below
average). Much of this was achieved in 2017, when the Conservative vote share
in the region rose by 11 points, but not quite to a level that was high enough to
deliver any additional MPs. With an increase of just 4 percentage points
between 2017 and 2019, half of the Red Wall changed hands. This reinforces the
argument that the foundations for the 2019 victory were laid two years earlier,
even if it may not have felt like it for Conservatives at the time.
Figure 12: Conservative vote share in the Red Wall and whole UK since
2010
50%
40%
30%
20%
10%
0%
2010 2015 2017 2019
Red Wall UK
Figure 13, below, shows this change on a seat-by-seat basis. Votes switching to
the Conservatives did not happen uniformly across the Red Wall. In 2015, there
was no discernible difference in vote share between seats that would go on to
be won by the Conservatives in 2019 and those that would not. In other words,
seats that swung further towards the Conservative did not necessarily start out
more Conservative. Burnley and Halifax are great examples of this. Burnley had
the lowest Conservative vote share of any Red Wall seat in 2015, at just 14%, but
this almost trebled to 40% in 2019. Halifax on the other hand had the second-
highest Conservative vote share in 2015, rising to 42% in 2017 and falling to 41%
in 2019.
Another brick in the wall 24Figure 13: Conservative vote share in Red Wall seats 2015-19, coloured by
winner in 2019
2020 Burnley Halifax
2019
2019
2018
Burnley Halifax
2017
2017
2016
Burnley Halifax
2015
2015
2014
0% 10% 20% 30% 40% 50% 60% 70%
2019 Conservative seats 2019 Labour seats
Looking slightly beyond the Red Wall at other seats that have trended towards
the Conservatives, we find that there are 66 seats where the Conservative
Party’s increase in vote share has exceeded the UK average (by more than 1pp)
at each election since 2010.
• 35 of these were Conservative in 2010 (many were pre-Blair Conservative
seats that the Conservatives regained in 2010) with vote share slowly
returning to what it was in the 1980s, and a few are long-held seats where
the party has since consolidated even further (like Grantham and Stamford).
• 11 fell in 2015, including several former-Liberal Democrat seats like Yeovil
and Eastleigh, and also Morley and Outwood in an early hint of the fall of
the Red Wall. The Conservatives have continued to make greater-than-
average gains in vote share in these seats.
The table below shows the seats that moved towards the Conservatives (more
than the national swing) at each election since 2010, and which were won in
2017 or 2019. This shows that there was an underlying trend towards the
Conservatives in many of these seats that predated Brexit: it took several
election cycles for the Party to become serious contenders in these seats, they
swung hard and came close in 2017, and then they all crossed the victory
threshold at the same time in 2019.
Another brick in the wall 25Table 3: Seats that trended towards the Conservatives, which were won
in 2017 or 2019
Year the seat
2010-15 2015-17 2017-19
changed hands
Stoke-on-Trent South 2017 4.3% 16.4% 13.1%
North East Derbyshire 2017 3.8% 12.5% 9.5%
Mansfield 2017 1.8% 18.5% 17.3%
Redcar 2019 2.4% 17.0% 12.8%
Stoke-on-Trent North 2019 3.6% 17.9% 7.0%
Bishop Auckland 2019 6.2% 14.4% 6.8%
Blyth Valley 2019 5.1% 15.6% 5.4%
Sedgefield 2019 6.0% 9.3% 8.4%
North West Durham 2019 3.4% 11.1% 7.5%
Newcastle-under-Lyme 2019 2.5% 11.2% 4.4%
Darlington 2019 3.7% 8.1% 4.8%
Birmingham, Northfield 2019 2.1% 7.0% 3.6%
Barrow and Furness 2019 4.2% 6.5% 4.8%
Of this list of 66 seats that became more conservative than average at each
election since 2010, there are only seven that do not have Conservative MPs.
These are listed in Table 4.
Table 4: Seats that trended towards the Conservatives, which are held
by other parties
Swing Swing Swing 2019 vote
2010-15 2015-17 2017-19 share
Stockton North 2.0% 8.5% 4.1% 40.6%
Wansbeck 4.2% 11.0% 7.5% 40.3%
Newport East 4.3% 7.5% 4.2% 39.0%
Neath 2.3% 8.4% 4.3% 28.0%
Kingston upon Hull North 1.9% 10.2% 2.4% 27.6%
Cynon Valley 2.0% 7.3% 2.8% 22.2%
Na h-Eileanan an Iar 3.2% 8.8% 5.7% 22.2%
Another brick in the wall 26We can discount several on this list as completely out of reach. Although the
Conservatives have gained successively, they started from a low base and still
sit well below a third of the vote. But in Stockton North, the Conservatives have
risen from 26% in 2010 to 41% in 2019. In Wansbeck, the Conservatives have
more than doubled their vote share in just those 9 years, from 18% to 40%.
5. Between two landslides
We can further examine the secular trends in Conservative support by
calculating Conservative vote share at a county level, relative to the UK average.
This suggests that there are two main types of constituency:
• A relatively consistent increase or decrease in relative Conservative
popularity over the whole period 1983-2019, which would suggest long-
term demographic shifts in those areas. Examples include East Sussex and
Northamptonshire.
• Relative stability followed by a sharp increase or decrease between 2015 and
2019, which is most likely a Brexit effect. Examples include Surrey and
Humberside.
The chart below shows that some counties became more Conservative than
average pre-Brexit and then less than average post-Brexit (including Surrey,
Oxfordshire and Berkshire). The opposite pattern holds true for Cleveland and
South Yorkshire.
The first period, from 1997-2015 is marked by relative stability. Areas that we
would expect to vote more Conservative or more Labour pretty much did so in
line with the national mood.
But the period 2015-2019 saw much larger shifts, some of which ran counter to
historical trends. Forecasting from a linear trend is going to be very uncertain,
but if the political reorientation continues, we could very well see a steady
reduction in Conservative vote share in some of these counties in the bottom-
right quadrant of Figure 14.
Another brick in the wall 27Figure 14: Trend in relative Conservative vote share (compared to UK
average) 1997-2015 vs 2015-2019
4%
Humberside
Lincolnshire
3% Northumberland
South Yorkshire Durham Staffordshire
2%
Essex
Cleveland Shropshire
Linear trend 2015-2019
1%
0%
Cambridgeshire
Merseyside
-1%
East Sussex
-2% Oxfordshire
London
Surrey Berkshire
-3%
-4%
-0.6% -0.4% -0.2% 0.0% 0.2% 0.4% 0.6%
Linear trend 1997-2015
The other key observations, given that we are interested in the longer-term
shifts away from the Conservatives, are those counties in the bottom-left
quadrant. We have discussed London, and Merseyside is hardly surprising, but
it is notable that we also see East Sussex and Cambridgeshire becoming less
Conservative. For East Sussex, this is a trend that was already underway in the
early 1980s, and which started in the mid-1990s in Cambridgeshire. By
removing the effect of all the electoral shocks that have happened since 1983,
this suggests that places like these are becoming (and may continue to become)
structurally less Conservative over time.
We can see this more clearly in Figure 15 below. On the left-hand side, we have
several Midlands counties which are becoming steadily more Conservative over
time: Staffordshire, Shropshire, Lincolnshire and Northamptonshire. And the
Another brick in the wall 28same is true of Essex and Northumberland. On the right-hand side, we have
places becoming a paler shade of blue: East Sussex, London, Merseyside and
Cambridgeshire.
Figure 15: Counties that have been moving away from or towards the
Conservatives, relative to the UK average
Trending more Conservative Trending less Conservative
25% 25%
20% 20%
15% 15%
10% 10%
5% 5%
0% 0%
-5% -5%
-10% -10%
-15% -15%
-20% -20%
-25% -25%
Staffordshire Northumberland Cambridgeshire London
Lincolnshire Essex East Sussex Merseyside
Shropshire Northamptonshire
Put another way, while Surrey had the highest Conservative vote share in
England at every election between 1987 and 2015, it has since fallen to the 21st
most Conservative county (out of 45). In a similar vein, between 1983 and 2019
East Sussex fell from 4th to 36th and Berkshire fell twenty places from 7th to
27th. In fact, East Sussex and Staffordshire have almost exactly switched places
in the ranking, as have several other pairs of counties.
Another brick in the wall 29Table 5: Pairs of counties that have switched places, ranked by
Conservative vote share
Rank in 1983 Rank in 2019
Staffordshire 33 4
East Sussex 4 36
Humberside 35 16
Oxfordshire 15 32
Northumberland 42 30
London 34 43
Shropshire 27 5
Buckinghamshire 5 24
Although constituency boundaries have changed since 1983, we can show the
distribution of vote share within counties. The graph below does this for
Surrey, East Sussex, Staffordshire and Lincolnshire. Comparing 1983 and 2019,
the distribution of Conservative vote share across Surrey constituencies has
shifted leftwards (in other words, decreased).
In 1983, every East Sussex MP was returned with an absolute majority (winning
over 50% of the vote), but in 2019 only two seats voted majority Conservative:
Wealden and Bexhill & Battle. The opposite is true in Staffordshire. The
distribution of vote share has shifted considerably to the right. With the
exception of Stoke-on-Trent Central, every seat is now majority Conservative.
In fact, the 2019 election was the first in history where the Conservative Party
won every seat in the county.
Figure 16: Conservative vote share by constituency, 1983 and 2019
Surrey 1983
Surrey 2019
East Sussex 1983
East Sussex 2019
Staffordshire 1983
Staffordshire 2019
Lincolnshire 1983
Lincolnshire 2019
0% 10% 20% 30% 40% 50% 60% 70% 80% 90%
Another brick in the wall 30Chapter 3
Future battlegrounds
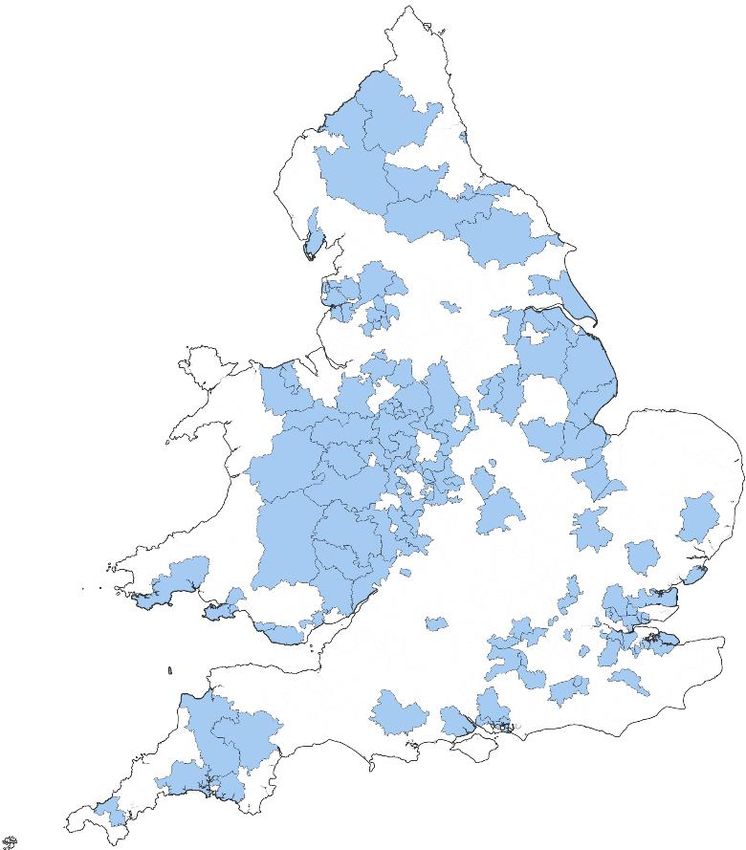
Another brick in the wall 31If there is no such thing as the Blue Wall, where will the battleground of the next election be? Should the Conservatives’ focus be on retaining 2019 gains or holding their older seats in the South? Should the Labour Party focus on winning in Surrey or holding onto Warrington? 1. The battleground will be in the North of England To identify where the political battleground might be in the next election, we return to the analysis which identified the original Red Wall in 2019. We compare the ‘correction waiting to happen’ (the over- or under-performance of the Conservatives) to the two-party swing that would be required for the Conservatives to lose to the current runner up or to win the seat from the incumbent. Figure 20, below, shows the seats that would change hands. As you can see, the battleground is quite clearly in the North of England, specifically around the original Red Wall identified by James Kanagasooriam before the 2019 election. We estimate that there are 51 potential battleground seats in the North, of which the Conservatives could win 36 and lose 15 if each seat adjusted to match demographic fundamentals. This suggests that the Conservatives’ assault on Labour’s heartlands may not yet be complete, but also that their new gains are not yet secure. To reiterate, this assumes no national swing, that demographics remain strongly predictive of voting behaviour, and that shifts in the main parties’ coalitions continue. Using this method also reveals that there are just 19 battleground seats in the South of England. The Conservatives would stand to lose 12 of these, including 7 seats to the Liberal Democrats and 5 to the Labour Party (all in North London). The losses to Labour could potentially include high-profile seats such as Chingford and Woodford Green and Uxbridge and South Ruislip. Another brick in the wall 32
Figure 17: Seats the Conservatives risk losing (red) or could win (blue), if
each seat aligned perfectly to demographic fundamentals
Source: Onward/Stack Data Strategy (2021), Onward analysis

      Risk
      Opportunity

Another brick in the wall                                                 33
2. County lines In parts of the country that have trended away from the Conservatives, how much opportunity exists for other parties to gain? And in areas becoming more Conservative, how much more room is there for further advances? Although it looks like the heart of the Conservative Party is moving northwards to Staffordshire, there are no more seats left to win in that county, so any further gains in support would be inefficient. The same is true in Essex, Lincolnshire and Shropshire. In these counties, barring interference from the Boundary Commission, the Conservatives have hit their metaphorical ceiling in terms of seats. County-wide shifts will not play out uniformly across constituencies, but we can give a general impression of risk and opportunity. Only 10% of seats in the 10 counties that drifted most towards the Conservatives are held by other parties, so there isn’t much room for expansion there. But the Conservatives hold 49% of seats in the 10 counties that moved furthest away from them, which gives other parties plenty of opportunities to make gains at the Conservatives’ expense. Figure 18, below, shows that the Conservatives hold many more seats in counties that are drifting away from them than opposition parties hold in counties that are becoming more Conservative. Specifically, of the top ten counties trending towards the Conservatives, there are only nine only seats that are not currently held by the Party. In other words, the Conservatives were riding high after 2019, and therefore have further to fall. Another brick in the wall 34
Figure 18: Number of seats won by each party in 2019
   10 counties that saw the largest increase in                10 counties that saw the largest decrease in
       Conservative vote share since 1983                          Conservative vote share since 1983

100%                                                      100%
                                                                                                         3
                                                                                             1                1
90%                                 2                     90%                           1
            1                                                                    2
                         3
80%                                                       80%      4
                                        3
                                                                                        1                     2
                                                                                             4
70%                                                        70%
                                                                                                         49
60%                                                       60%
                                                                                                                  14
50%    12       7   18       5               7    8       50%            8   7                      11

40%                                 9                     40%
            3                                                                    6
                         7                                         11                   4
30%                                                        30%                                                5
                                        4                                                    6

20%                                                        20%
                                                                                                         21
 10%                                                       10%
                                                                                                                  1
 0%                                                         0%

                                                                   Conservative Party       Labour

            Conservative Party      Labour                         Liberal Democrats        Green

                                                                   SPK

        Table 6: Labour seats in counties that are trending Conservative
        Constituency                                  County
        Wansbeck                                      Northumberland
        Kingston upon Hull East
        Kingston upon Hull North                      Humberside
        Kingston upon Hull West and Hessle
        Chesterfield
                                                      Derbyshire
        Derby South
        City of Durham
        Easington                                     Durham
        North Durham

        Another brick in the wall                                                                        35
3. Continuing political rotation We know that the post-Brexit shift towards the Conservative Party is larger in historically Labour-voting areas in the North and Midlands – and the shift away from the Conservatives was larger in some Home Counties seats. But if that pattern continued, and the 2015-19 change in vote share was replicated at the next election, which seats would change hands? We can take the change in relative Conservative vote share between 2015 and 2019 and treat that as the two-party swing at the next election. So, in Conservative-held seats, the percentage point decrease in Conservative vote share accrues to the current runner-up and, in seats held by other parties, the Conservatives take vote share from the current incumbent. For example, the Conservatives gained 12.7 percentage points in Barnsley East between 2015 and 2019. In the context of gaining 7.1 points nationally, this is a relative increase of 5.6 points. If we assume that the Conservatives gain another 5.6 points, and Labour lose 5.6 points, this would just give the Conservatives a majority (given the Labour majority was 8.5 points in 2019). In Wantage, where the relative change in Conservative vote share was -9.6 points and the 2019 majority stood at 18.8 points, the Liberal Democrats would win with a slim majority of 0.4 points. Using this method across every constituency, we can identify 36 seats the Conservatives could lose and 47 they could gain, for a net change of +11. Of course, we run into the same problems as noted above. A perfect two-party swing doesn’t happen in any constituency and the exact mechanics of Conservative-Labour-Liberal Democrat switching is complex and heavily dependent on the success of local campaigning. But we could interpret this as the maximum extent of potentially volatility. In the left-hand graph of Figure 19, seats that are nearer to the dotted line are ‘close losses’, where the two-party swing is just enough for the 2019 runner up to pip the Conservatives to the post. The right-hand graph functions in the same way for seats that the Conservatives could gain, colour-coded by the incumbent party. Another brick in the wall 36
Figure 19: Seats that would change hands if we replicate 2015-19 change
                                     in Conservative vote share

                                            36 Conservative losses                                                           47 Conservative gains
                               0%                                                                                 25%

                                                                                    Swing towards Conservatives
Swing against Conservatives

                              -5%                                                                                 20%

                              -10%                                                                                15%

                              -15%                                                                                10%

                              -20%                                                                                5%

                              -25%                                                                                0%
                                     0%     5%     10%   15%      20%   25%   30%                                       0%        5%       10%         15%    20%
                                                    2019 majority                                                                      2019 majority

                                          Labour    Lib Dem       Other                                           Labour        Lib Dem     Plaid Cymru      SNP

                                     Looking closer, we can see that 10 of these 47 gains are in Scotland, which is
                                     mostly a function of the Conservatives recovering from their almost-total
                                     wipeout in 1997. For two decades, the Party polled below 20% and never had
                                     more than one MP. Conservative vote share across all of Scotland was 25% in
                                     2019, which is 10 percentage points higher than in 2015. But it roughly matches
                                     the results of 1983, 1987 and 1992 (28%, 24% and 26%, respectively). So this
                                     probably doesn’t indicate an upward trend. There is nothing in the data to
                                     suggest a continuing shift towards the Conservatives in Scotland.

                                     If we remove these 10 Scottish seats, the total number of Conservative gains
                                     falls to 37. This would mean a net gain of just +1 seat. The map below shows this
                                     geographically, keeping national vote share consistent, and altering the
                                     distribution of each party’s voters.

                                     Figure 20, below, shows that shifting the distribution of the Conservative vote
                                     in line with recent trends would open up significant opportunity in the North of
                                     England, particularly in South Yorkshire. Even with no change in national vote

                                      Another brick in the wall                                                                                        37
share, the Liberal Democrats would make 15 gains in the Greater South East and only one in the North: Cheadle, a suburban seat south of Manchester that the party previously held from 2001-2015. Labour would pick up nine southern seats and gain eight from elsewhere. Figure 20: Seats that could change hands if recent trends in political realignment continued, holding national vote share constant Please note: the two grey constituencies are South West Hertfordshire and Beaconsfield, in which David Gauke and Dominic Grieve stood as independents and came second in their respective seats. Another brick in the wall 38
4. Cannibalism on the Left

         The collapse of the Conservatives in the South is made less likely by the fact the
         left is fragmented – split between different parties that cannot defeat the
         Conservatives without either Labour and the Liberal Democrats resolving to
         stop competing with each other or one party cannibalising the other’s vote.

         There are 35 seats in which the Liberal Democrat residual (their demographic
         over-performance) is greater than +10%. This list contains all of their English
         and Welsh seats. Comparing the size of the Conservative and Labour residuals
         in these same seats can indicate which party the Liberal Democrats are
         suppressing the most, statistically speaking.

Figure 21: Seats where the Liberal                Figure 22: Seats where the Liberal Democrats
Democrats over-perform, coloured by 2019          over-perform, coloured by the party whose
winner                                            vote share is most suppressed

         Another brick in the wall                                                      39
We find that in five of these seats, the Labour residual is within 5 points of the Conservative residual, indicating that the Liberal Democrats are suppressing both other parties roughly equally. In 28 seats, the Labour residual is substantially lower than the Conservative residual (more than 5 points) and in two further seats the Conservative residual is substantially lower than Labour’s. This does not necessarily mean that Labour and the Liberal Democrats are directly trading votes in the 28 red seats identified in Figure 22 below, but it does suggest that the Liberal Democrat vote share should be lower and Labour’s should be higher. We can also look at the 30 constituencies in which the Liberal Democrats under-performed the most (seats in which their actual vote share is lower than their predicted vote share). The Conservative residual is larger than Labour’s in 9 of those seats, Labour’s over-performance exceeds the Conservatives’ in a further 9 and, in the remaining 12, both parties did better than expected in roughly equal measure. In these 30 seats, the average over-performance (likely coming from Liberal under-performance) is 2.6% for the Conservatives but 5.2% for Labour. Here, again, it seems like the Liberal Democrats pose at least as much of a problem for Labour – and perhaps slightly more so – than for the Conservatives. Considering all seats in England, Table 7 shows that Labour over-performance is strongly negatively correlated with Liberal Democrat over-performance. But Liberal Democrat over-performance doesn’t coincide with Conservative under- performance. A ‘correction’ away from the Conservatives is therefore more likely to benefit Labour than the Liberal Democrats, even in the South. It could also imply that Labour are in a better position than the Conservatives to squeeze the Liberal Democrat vote. But, since Labour are in third place in many southern seats, the electoral impact of that strategy may be small. More simply, we can look at the change in party vote share from 2017-19 in the Greater South East (Figure 23). We can see that the Liberal Democrats lost support in 13 seats and gained in 201 seats. And the graph shows that the change in Liberal Democrat vote share is correlated with change in Conservative and Labour vote share to exactly the same extent (the R 2 value is roughly 27% in both cases). Another brick in the wall 40
You can also read