Applied Clinical Tandem Mass Spectrometry-Based Quantification Methods for Lipid-Derived Biomarkers, Steroids and Cannabinoids: Fit-for-Purpose ...
←
→
Page content transcription
If your browser does not render page correctly, please read the page content below
biomolecules

Communication
Applied Clinical Tandem Mass Spectrometry-Based
Quantification Methods for Lipid-Derived Biomarkers, Steroids
and Cannabinoids: Fit-for-Purpose Validation Methods
Isabelle Matias † , Ilaria Belluomo †,‡ , Pierre-Louis Raux                  and Monique Vallée *

                                         INSERM, Neurocentre Magendie, University of Bordeaux, U1215, F-33000 Bordeaux, France
                                         * Correspondence: monique.vallee@inserm.fr
                                         † These authors contributed equally to this work.
                                         ‡ Current address: Hammersmith Campus, Department of Surgery and Cancer, Imperial College London,
                                           Du Cane Road, London W12 0NN, UK.

                                         Abstract: The emergence of metabolomics and quantification approaches is revealing new biomarkers
                                         applied to drug discovery. In this context, tandem mass spectrometry is the method of choice,
                                         requiring a specific validation process for preclinical and clinical applications. Research on the two
                                         classes of lipid mediators, steroids and cannabinoids, has revealed a potential interaction in cannabis
                                         addiction and metabolism-related disorders. Here we present the development of GC-MS/MS and
                                         LC-MS/MS methods for routine quantification of targeted steroids and cannabinoids, respectively.
                                         The methods were developed using an isotopic approach, including validation for linearity, selectivity,
                                         LLOQ determination, matrix effect, carryover, between- and within-run accuracy and precision, and
                                         stability tests to measure 11 steroids and seven cannabinoids in human plasma. These methods were
                                         satisfactory for most validity conditions, although not all met the acceptance criteria for all analytes.
                                         A comparison of calibration curves in biological and surrogate matrices and in methanol showed
                                         that the latter condition was more applicable for our quantification of endogenous compounds.
                                         In conclusion, the validation of our methods met the criteria for GLP-qualified rather than GLP-
Citation: Matias, I.; Belluomo, I.;
                                         validated methods, which can be used for routine analytical studies for dedicated preclinical and
Raux, P.-L.; Vallée, M. Applied
                                         clinical purposes, by combining appropriate system suitability testing, including quality controls in
Clinical Tandem Mass
                                         the biological matrix.
Spectrometry-Based Quantification
Methods for Lipid-Derived
Biomarkers, Steroids and
                                         Keywords: quantification methods; tandem mass spectrometry; steroids; cannabinoids; human
Cannabinoids: Fit-for-Purpose            plasma; GC-MS/MS; LC-MS/MS; validation
Validation Methods. Biomolecules
2023, 13, 383. https://doi.org/
10.3390/biom13020383
                                         1. Introduction
Academic Editor: Jesús Balsinde
                                              In preclinical and clinical research, the emergence of the term “omics” has spread
Received: 23 December 2022               in recent years to many multidisciplinary fields ranging from genomics, epigenomics,
Revised: 9 February 2023                 transcriptomics, and proteomics, as well as their downstream pathways that are embedded
Accepted: 11 February 2023
                                         in the metabolomics field, one of the newest “omics” fields [1]. Therefore, characteriz-
Published: 17 February 2023
                                         ing metabolomic profiles can be a powerful tool for understanding the mechanisms that
                                         contribute to physiological and pathological phenotypes in a single individual. Namely,
                                         metabolomics provides the qualitative and quantitative analysis of endogenous small
Copyright: © 2023 by the authors.
                                         molecules present in different biological compartments, such as cells, tissues, organs, or
Licensee MDPI, Basel, Switzerland.
                                         biofluids, in response to environmental fluctuations or perturbations [2–4]. Hence, the
This article is an open access article
                                         content of metabolites fulfils the role of a central control tower of the organism and can
distributed under the terms and          account for the health status of individuals, whether in human or animal models. The
conditions of the Creative Commons       resulting broader potential knowledge of biological mechanisms can accelerate preclinical
Attribution (CC BY) license (https://    and clinical research discoveries. Still, progress in this field is strictly linked to the evolution
creativecommons.org/licenses/by/         of analytical technologies used to identify and measure the levels of small molecules.
4.0/).

Biomolecules 2023, 13, 383. https://doi.org/10.3390/biom13020383                                    https://www.mdpi.com/journal/biomolecules
Biomolecules 2023, 13, 383 2 of 24
Among many approaches available to measure a wide range of small molecules,
immunoassays (IAs) represent the classic analytical techniques commonly used in clinical
practice. This type of screening requires a simple process with minimal cost, and robotic
techniques give the possibility of full automation. Despite this technique being easy to
perform and effective in evaluating biomolecule concentrations, it still presents many
limitations. First, ligand-binding assays are not available for all biomolecules. Second,
when available, the antigen–antibody reaction presents possible crossover between similar
molecules, therefore reducing specificity in many cases and leading to potential false-
positive results [5–8]. In addition, since IAs target mainly one biomolecule, there is a lack of
information about related metabolites which may have different molecular and/or cellular
targets than the molecule of interest. Consequently, this methodology does not support the
evaluation of pathways and networks in the same sample.
To overcome these challenges, mass spectrometry (MS)-based technologies have been
developed and have challenged the analytical chemistry field, becoming an essential tool
in metabolomics [9,10]. MS techniques can ensure the assessment of several molecules in a
single biological sample during the same analytical run, giving the possibility to evaluate
a whole panel of compounds and pathway mapping. Additionally, chromatographic
separation, often coupled to MS, assures the separation for the detection and measurement
of similar molecules, such as isomers [11]. Another advantage of this analytical technique
is the use of internal standards (ISs), providing high validity in terms of accuracy, precision,
and reproducibility [12]. Although the non-targeted metabolomics hype aims to discover a
large number of new molecules, metabolomics applied to targeted metabolites can provide
a more appropriate tool for routine individual clinical diagnosis [13].
Lately, the development of tandem MS has offered a higher specificity together with better
sensitivity and specificity [13]. This type of MS is considered the gold standard for targeted
measurement of biomolecules when a data-driven panel of compounds has been established
and quantitative methods can be designed ad hoc. Validation of the analytical methods is the
key feature to ensure the robustness of every bioanalytical approach. Accordingly, tandem
MS targeted method validation is a meticulous process aimed to achieve the best qualitative
and quantitative performance for the measurement of an established group of compounds
through the optimization and validation of different variables. This process is detailed in
specific guidelines released and continuously revised by the European Medical Agency (EMA)
in Europe and the Food and Drug Administration (FDA) in the United States [14,15]. These
guidelines can be applied and adapted to different groups of metabolites.
Among the different biological classes of metabolites, lipids and lipid-derived com-
pounds have attracted much interest in recent years because of their relevance in transla-
tional research and clinical applications [16–18]. Specifically, endogenous steroids (STs) and
cannabinoids (CBs) can be identified as major targets and biomarkers for various neuroen-
docrine and behavioral-based dysfunctions [19–24]. For instance, our group and collabora-
tors previously showed a link between these two classes of compounds in cannabis-related
addiction [25] and energy balance-related disorders [26–28]. Our recent findings have
highlighted the role of endogenous steroids, particularly pregnenolone (PREG), as an
endogenous modulator of the type-1 cannabinoid (CB1) receptor [25,29], which is one
of the main central targets that drive the bioactivity of cannabinoids, including the en-
docannabinoids anandamide (AEA) and 2-arachidonoylglycerol (2-AG), as well as the
exogenous cannabinoid ∆9 -tetrahydrocannabinol (THC), the main psychoactive compo-
nent of Cannabis sativa, and its psychoactive metabolite 11OH-THC [30,31]. In addition,
crosstalk between endogenous steroids (or neurosteroids when synthesized de novo within
the brain) and endocannabinoids is an underlying pattern in cannabis addiction [32], as well
as in metabolic-related disease [26–28] and stress-related disorders [22,33,34]. The growing
interest in these compounds in preclinical and clinical research has led to the need to devise
methods for their accurate, sensitive, and specific quantification. This is notably what has
been addressed with tandem MS coupled with chromatographic techniques [6,13,35–37],Biomolecules 2023, 13, x FOR PEER REVIEW 3 of 25
as in metabolic‐related disease [26–28] and stress‐related disorders [22,33,34]. The grow‐
Biomolecules 2023, 13, 383 ing interest in these compounds in preclinical and clinical research has led to the need to
3 of 24
devise methods for their accurate, sensitive, and specific quantification. This is notably
what has been addressed with tandem MS coupled with chromatographic techniques
[6,13,35–37],
although a fewalthough a few simultaneously
simultaneously analyzedand
analyzed endogenous endogenous
exogenousand exogenous[38,39],
cannabinoids canna‐
binoids [38,39], as well as steroids and (endo)cannabinoids [40–42]
as well as steroids and (endo)cannabinoids [40–42] in the same samples. in the same samples.
Forall
For allthese
thesereasons,
reasons,our
ourresearch
researchstrategy
strategywas
wasfocused
focusedonontargeted
targetedmetabolomics
metabolomics
involvingthe
involving thestudy
studyofofthe
thetwo
twolipid
lipid subtypes,
subtypes,STs
STsand
andCBs,
CBs,for
forapplication-based
application‐basedresearch
research
onpotential
on potentialbiomarkers
biomarkersand anddrug
drugdiscovery
discovery(Figure
(Figure1).
1).
Figure1.1.Schematic
Figure Schematicrepresentation
representationof
ofour
ouranalytical
analyticalresearch
researchstrategy
strategytotoassess
assessthe
thecross-functional
cross‐functional
interplay between steroid and cannabinoid systems. Among the omics research topics,
interplay between steroid and cannabinoid systems. Among the omics research topics, our ourtargeted
targeted
metabolomics approach focuses on lipidomics, specifically on steroids (STs) and cannabinoids
metabolomics approach focuses on lipidomics, specifically on steroids (STs) and cannabinoids (CBs).
(CBs). Our studies benefit from advances in the development and validation of tandem mass spec‐
Our studies benefit from advances in the development and validation of tandem mass spectrometry
trometry (MS/MS) methods to provide new insights into biomarkers and drug discovery.
(MS/MS) methods to provide new insights into biomarkers and drug discovery.
Therefore,we
Therefore, wehave
havelocally
locallyimplemented
implementedtwo twoparallel
parallelquantification
quantificationmethods
methodsin inour
our
analytical platform for the quantification of STs and CBs involving highly
analytical platform for the quantification of STs and CBs involving highly specialized specialized
staff. In
staff. In this
thispaper,
paper,wewepresent
presentthethe
development
development of two tandem
of two MS methods,
tandem MS methods, a gasachro‐
gas
matography–tandem mass spectrometry (GC‐MS/MS) method for
chromatography–tandem mass spectrometry (GC-MS/MS) method for the measurement the measurement of
eleven STs, including pregnenolone (PREG) and downstream steroids
of eleven STs, including pregnenolone (PREG) and downstream steroids (Figure 2A), and(Figure 2A), and
liquidchromatography–tandem
liquid chromatography–tandemmass mass spectrometry
spectrometry (LC‐MS/MS)
(LC-MS/MS) method
method forfor
thethe meas‐
measure-
urement of seven CBs, of which the two endocannabinoids AEA and 2‐AG,
ment of seven CBs, of which the two endocannabinoids AEA and 2-AG, and the related fattyand the related
fatty acids,
acids, OEA (oleoylethanolamine)
OEA (oleoylethanolamine) and PEAand PEA (palmitoylethanolamide)
(palmitoylethanolamide) (Figure (Figure 2B),as
2B), as well as
well together
THC as THCwith together with its
its hydroxyl andhydroxyl
carbonyl and carbonyl
metabolites metabolites
(11OH-THC and(11OH‐THC
11COOH-THC, and
11COOH‐THC,
respectively) respectively)
(Figure 2C). (Figure 2C).
Method development is an overall procedure that also includes pre-analytical and
analytical phases that require a validation process before being applied to real samples
as described in Figure 3. Once all the pre-analytical and analytical settings have been
optimized, validation is a necessary step to define the limit of acceptability of the methods.
In this paper, we focused on the development and validation of mass spectrometry methods
that can be applied for analytical studies of molecules of research interest involving inter-
connected steroid and cannabinoid systems. Since sample extraction and chromatographic
conditions have been previously established with good recovery and good separation of
the analytes of interest [20,25,43–45], our work addressed the validation of mass spectro-
metric conditions, including ionization and fragmentation, which are important conditions
governing a quantification method.Biomolecules 2023, 13, 383 4 of 24
omolecules 2023, 13, x FOR PEER REVIEW 4 of 25
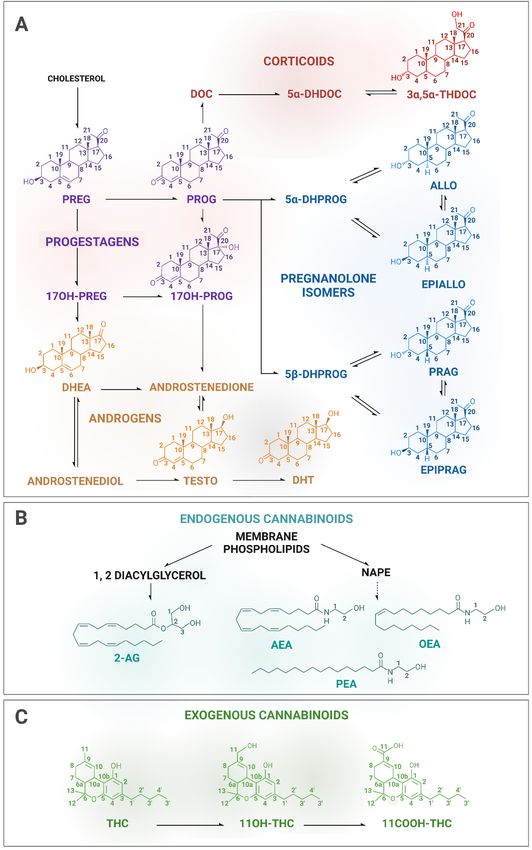
Figure 2. Structures and metabolic pathways of the targeted molecules. The steroids of interest in‐
Figure 2. Structures and metabolic pathways of the targeted molecules. The steroids of interest in-
clude four progestagens (PREG, PROG and its 17hydroxy metabolite), one corticoid (3α,5α‐
clude four progestagens (PREG, PROG and its 17hydroxy metabolite), one corticoid (3α,5α-THDOC),
THDOC), four pregnanolone isomers (ALLO, EPIALLO, PRAG and EPIPRAG), and two androgens
(TESTO and four
DHT)pregnanolone isomers (ALLO,
(A). The cannabinoids EPIALLO,
of interest PRAG
include two and EPIPRAG),(AEA
endocannabinoids and two
and androgens
2‐ (TESTO
AG), and twoand DHT)
related (A).acids
fatty The cannabinoids
(OEA and PEA) of interest
(B) and include two endocannabinoids
the exogenous cannabinoid THC(AEA and 2-AG), and two
and its
two metabolites (11OH‐THC
related and(OEA
fatty acids 11COOH‐THC)
and PEA) (B) (C).and
Notthe
all exogenous
metabolic pathways are represented.
cannabinoid THC and its two metabolites
See abbreviations in the abbreviation
(11OH-THC section. (C). Not all metabolic pathways are represented. See abbreviations
and 11COOH-THC)
in the abbreviation section.spectrometric conditions, including ionization and fragmentation, which are important
conditions governing a quantification method.
The choice of these methods meets local routine research needs for preclinical and
clinical trials and the compounds included in the methods were selected based on their
clinical and biological relevance. Our methods allowed the separation of similar com‐
Biomolecules 2023, 13, 383 5 of 24
pounds with specific biological functions and achieved relatively good results in terms of
sensitivity and specificity for some of the targeted compounds.
Figure3.3.Pre-analytical
Figure Pre‐analytical and
and analytical
analytical phases
phases of
of the
the validation
validationprocess.
process.The
Thesteps ofof
steps thethe
methods
methods
include 1/sample extraction optimization, 2/mass spectrometry method development, 3/the valida‐
include 1/sample extraction optimization, 2/mass spectrometry method development, 3/the validation
tion process of the method, and 4/the application to real biological samples in human and animal
process of the method, and 4/the application to real biological samples in human and animal models.
models.
The choice of these methods meets local routine research needs for preclinical and
2. Methods
clinical trials and the compounds included in the methods were selected based on their
clinicalIsotope dilution GC‐MS/MS and LC‐MS/MS methods were developed in parallel for
and biological relevance. Our methods allowed the separation of similar compounds
the bioassay of clinically relevant STs and CBs in human plasma. All the experimental
with specific biological functions and achieved relatively good results in terms of sensitivity
procedures were conducted on the basis of good laboratory practice‐like (GLP‐like) pro‐
and specificity for some of the targeted compounds.
cedure. Indeed, the tests were conducted with reference to and adapting the guidelines
2.for bioanalytical method development [14,15]. Precision and accuracy acceptability were
Methods
established at CV < 20% and ±20%, respectively, which can be accepted criteria for mass
Isotope dilution GC-MS/MS and LC-MS/MS methods were developed in parallel
spectrometry‐based quantification of endogenous small molecules [46]. For calibration
for the bioassay of clinically relevant STs and CBs in human plasma. All the experimental
curves (except for LLOQ), the criteria were set at CV < 15% and ± 15% [46].
procedures were conducted on the basis of good laboratory practice-like (GLP-like) pro-
The following variables were evaluated for the validation of the two analytical meth‐
cedure. Indeed, the tests were conducted with reference to and adapting the guidelines
ods: linearity, selectivity, determination of lower limit of quantification (LLOQ), matrix
for bioanalytical method development [14,15]. Precision and accuracy acceptability were
effect, carry‐over, and within‐ and between‐run determination of accuracy and precision.
established at CV < 20% and ±20%, respectively, which can be accepted criteria for mass
spectrometry-based quantification of endogenous small molecules [46]. For calibration
curves (except for LLOQ), the criteria were set at CV < 15% and ± 15% [46].
The following variables were evaluated for the validation of the two analytical meth-
ods: linearity, selectivity, determination of lower limit of quantification (LLOQ), matrix
effect, carry-over, and within- and between-run determination of accuracy and precision. In
addition, stability tests for MS/MS methods were performed with the stability during the
preparation of samples in the biological matrix and post-preparative stability during runs
on auto-sampler, as well as the stability in the solvent at room temperature (RT) and during
storage conditions (−20 ◦ C) of reference standards and deuterated analogues solutions,
and finally, freeze and thaw stability tests were performed in biological matrix.
For the method development, validation (Val), quality control (QC), calibration, and
stability (Stab), samples were analyzed in the same analytical sequence. The Val samples,
corresponding to samples of the neat matrix (methanol), were used to validate the accuracy
and precision of the bioanalytical methods. These variables were evaluated by calculating
the accuracy and precision of QC repeated measures. Calibration samples were used to
construct calibration curves (CCs) from which the concentration of analyte in samples was
determined. Finally, Stab samples were used to evaluate stability data in the matrix.Biomolecules 2023, 13, 383 6 of 24
Recovery tests were not assessed for every sample preparation step since the quan-
tification was performed using the isotope dilution method with the addition of stable
deuterated isotopes as internal standards (ISs) at the beginning of the preparation process,
which allows adjustment for any losses during sample preparation and to achieve accurate
quantification. This method was performed using deuterated analogues of each analyte,
except for the steroid EPIPRAG, which was quantified using the deuterated analogue of
its isomer, PRAG (PRAG-d4). Each deuterated IS was differing from its analogues by a
minimum of 3 mass units to avoid isotopic overlap during MS analysis [47]. The number
and position of the deuterium atoms of the ISs are listed in Table 1. The source (supplier)
and purity of each reference standard are indicated in Table S1.
Table 1. Position of the deuterium atoms of the internal standards (ISs) as deuterated analogues of
the STs and CBs of interest.
IS—STs C Positions
PREG-d4 7,21,21,21
PROG-d9 2,2,4,6,6,17α,21,21,21
17OH-PROG-d8 2,2,4,6,6,21,21,21
ALLO-d4 C 17,21,21,21
EPIALLO-d4 17α,21,21,21
PRAG-d4 17α,21,21,21
3α,5α-THDOC-d4 17,21,21
!DHEA-d5 2,2,3,4,4
TESTO-d3 16,16,17
DHT-d3 16,16,17
IS—CBs Positions
2-AG-d5 1, 1, 2, 3, and 3 positions of the glycerol moiety
AEA-d4 hydroxyethyl 1,1,2,2
OEA-d4 hydroxyethyl-1,1,2,2
PEA-d4 hydroxyethyl-1,1,2,2
THC-d3 3 deuteriums at the C5 position of the pentyl chain
11COOH-THC-d3 3 deuteriums at the C5 position of the pentyl chain
11OH-THC-d3 3 deuteriums at the C5 position of the pentyl chain
2.1. Chromatographic and Mass Spectrometer Conditions
The chromatographic and ionization conditions, which are important clues of the
method development, have been previously described [25,26,43–45,48].
For steroids, GC was operated using a 15 m Rtx-5Sil MS W/Integra Guard capillary
column (Restek, Lisses, France) with a 0.25 mm inside diameter and 0.1 µm film thickness
was employed for STs resolution. Injections were in splitless mode using helium as the
carrier gas at constant flow at 1.2 mL/min, with the interface temperature at 290 ◦ C.
Optimization of the ionization conditions led to the use of the emission current at 30 µA,
the source temperature at 210 ◦ C, the methane at 2 mL/min as the reacting gas, and the
argon as the collision gas. The ramp temperature has been optimized as followed: the
initial GC temperature was 160 ◦ C (1.25-min hold), followed by a temperature program
to 230 ◦ C at 50 ◦ C/min, then to 260 ◦ C at 4 ◦ C/min, then to 290 ◦ C at 50 ◦ C/min, and
finally to 320 ◦ C at 5 ◦ C/min, where it was held for 1 min. Mass spectra analysis of STs
was acquired with a GC-MS/MS-XLS Ultra (ThermoElectron SAS, Villebon-sur-Yvette,
France) operated in negative chemical ionization (NCI). NCI is a widely used ionization
technique for GC-MS typically for analyzing small electrophilic molecules, as steroids, after
derivatization of the analyte with chemicals that add electronegative atoms to the molecules.
NCI is considered a soft ionization technique yielding a mass spectral pattern with less
fragmentation in which the molecular or pseudo-molecular ions are easily identified. NCI
shows a dominant molecular ion peak (M−· ) as we determined for all STs compounds in
full-scan MS experiments over a range of 100 < m/z < 800 (Table 2).Biomolecules 2023, 13, 383 7 of 24
Table 2. Precursor ion, product ion, collision energy (eV), and retention time of each analyte and IS of
STs (scan time 0.1s, dwell time 1 ms, scan width 0.8) and of CBs (scan time 0.1 s; dwell time 2 ms,
scan width 0.01).
STs
Precursor Product Collision Retention
Class Analyte and IS
Ion (m/z) Ion (m/z) Energy (eV) Time (min)
PROGESTAGENS
PREG 405.3 272.4 15 9.8
PREG-d4 409.4 273.5 15 9.8
PROG 684.4 654.6 10 13.5
PROG-d9 693.5 663.7 10 13.4
17OH-PROG 461.2 411.4 20 8.6
17OH-PROG-d8 466.5 415.4 20 8.5
ALLO 407.3 274.2 15 9.0
PREGNANOLONE
ALLO-d4 411.4 275.5 15 9.0
ISOMERS
EPIALLO 407.3 274.5 15 9.9
EPIALLO-d4 411.4 275.5 15 9.9
EPIPRAG 407.4 274.5 15 8.8
PRAG 407.3 274.2 15 9.1
PRAG-d4 411.3 275.2 15 9.1
CORTI
3α,5α-THDOC 493.1 88.9 15 10.1
COID
3α,5α-THDOC-d3 496.2 88.9 15 10.1
DHEA 535.3 215.7 20 8.0
ANDROGENS
DHEA-d5 540.5 216.0 25 8.0
TESTO 535.3 413.7 20 8.7
TESTO-d3 538.3 416.7 20 8.6
DHT 537.3 190.5 25 8.2
DHT-d3 540.5 190.9 25 8.2
CBs
Precursor Product Collision Retention
Class Analyte and IS
Ion (m/z) Ion (m/z) Energy (eV) Time (min)
ENDOCANNABINOIDS
2-AG /1-AG 379.2 287.0 14 5.8/6.2
2-AG-d5 /1-AG-d5 384.2 287.0 16 5.8/6.2
AEA 348.2 287.1 13 5.5
AEA-d4 352.2 287.1 14 5.5
OEA 326.2 62.2 18 7.6
OEA-d4 330.3 66.6 16 7.6
PEA 300.2 62.4 16 7.0
PEA-d4 304.2 66.5 15 7.0
THC 315.2 193.0 22 5.3
METABOLITES
THC-d3 318.2 196.1 23 5.3
THC and
11COOH-THC 345.2 327.1 14 3.4
11COOH-THC-d3 348.2 330.2 14 3.4
11OH-THC 331.2 313.1 12 3.1
11OH-THC-d3 334.2 316.0 14 3.1
For cannabinoids, the chromatographic separation of CBs was achieved using a C18
Discovery column (5 µm, 15 cm × 4.6 mm; Supelco, Saint-Quentin-Fallavier, France) with
a guard column using an isocratic gradient (85% methanol, 15% water, 0.1% formic acid).
For the mobile phase, methanol and acetonitrile combined with water are commonly used.
These solvents were tested, and we found that methanol provided better ionization and
less ion suppression than acetonitrile for the majority of the target analytes. To increase
ionization, the addition of organic modifiers has been reported. Formic acid, acetic acid,
and ammonium acetate were tested in the mobile phase, resulting in higher ion intensity
with formic acid under our conditions. Different methanol gradients were then tested,
and the isocratic mode allowed a better separation for our analytes, which have a veryBiomolecules 2023, 13, 383 8 of 24
close polarity. The optimal HPLC conditions, column temperature, gradient composition,
and pH were selected based on the resolution and intensity of each peak. The resulting
retention times are shown in Table 2 for each compound. Mass spectra analysis of CBs
was acquired with an LC-MS/MS TSQ Quantum Access triple quadrupole instrument
(ThermoElectron SAS, Villebon-sur-Yvette, France) equipped with an APCI (atmospheric
pressure chemical ionization) source and operating in positive ion mode. The source
conditions were 350 ◦ C for the capillary and the vaporizer temperatures, 10 mV for the
discharge current, 35 mTor for the sheath gas pressure, and 10 mTor for auxiliary gas
pressure, with an argon collision gas pressure set up at 1.5mTor. The protonated molecular
ions for all CBs were determined in full-scan MS experiments over a range of 50 < m/z < 500
by triple-quadrupole APCI+. The protonated molecular ion [M + H]+ and the most intense
adduct ion, for each standard, are showed in Table 2. For 2-AG, we obtained two peaks
(as shown in Figure S2) corresponding to 2-AG and its inactive isomeric form 1-AG that
appears upon extraction. For quantification, we summed the concentrations of both isomers
providing meaningful data for biological interpretation, as is commonly performed [49,50].
The tandem mass spectrometer settings of our method development allowed the
selected reaction monitoring (SRM) mode process that was operating to enhance sensitivity.
For both STs and CBs, the ions (precursor and product) corresponding to each analyte and IS
were then identified through analysis of authentic pure reference standards (>95% purity, as
referred in Table S1) dissolved in methanol, to check the specificity (i.e., non-contamination)
of the solution, and determine retention time and MS conditions. Precursor and product
ions of the highest intensity for both STs and CBs, corresponding to the expected chemical
structure following the positive or negative ionization, were chosen as representative of
each analyte and IS included in the MS method. To assure the maximum production yield
of the product ions, the collision energy (CE) was determined for each compound using a
pre-set ramp of values, ranging from 10 to 30 eV. The precursor ion, product ion, collision
energy (eV), and retention time of each analyte and IS included in the methods are listed in
Table 2. Representative examples of the SRM chromatograms for both STs and CBs obtained
from a standard mixture are shown in Supplementary Figures S1 and S2, respectively.
2.2. Sample Preparation
Val, QC, CC, and Stab samples were prepared with working solutions of standard
analytes spiked with ISs, which were obtained by dilution from separate stock solutions.
The concentration of the stock and working solutions are listed in Table S2. Each solution
was prepared on the day of the analysis. Val, CC, and QC samples were prepared in
methanol, and Stab samples were prepared in commercial plasma (human EDTA-3K
plasma pool; PLA022; Dutscher SAS, Bernolsheim, France) and stored at −20 ◦ C, before
the evaluation of stability in the biological matrix.
Three concentration levels were used for Val and QC samples: at low, mid, and
high concentrations corresponding to the calibration curve level CC2 (approximately
2 times LLOQ), CC4 (8 times LLOQ), and CC8 (0.5 times ULOQ), respectively. LLOQ
(low limit of quantification) and ULOQ (upper limit of quantification) samples were the
calibration samples of the lowest and highest concentration in the CC, respectively, that
can be quantified with acceptable (in our case within a 20% CV) accuracy, precision, and
linearity within the curve [15]. In practice, the analysis of LLOQ results in a signal at least
10× the standard deviation of the blank sample [44], and can be also estimated based on
the signal-to-ratio (S/N), with S/N ≥10 LLOQ [14].
For samples in matrices, STs and CBs extraction protocols were previously opti-
mised [20,25,26,43–45,48]. Briefly, STs were extracted after homogenization of plasma
with methanol/H2 O (75/25, v/v) containing their respective deuterated ISs, and purified
by a simple solid-phase (SPE) extraction method using reverse-phase C18 columns. Free
steroid fraction was obtained by eluting the column with methanol. CBs were extracted
by liquid–liquid extraction (LLE) with chloroform after homogenization of plasma with
chloroform/methanol/Tris-HCl 50mM pH 7.5 (2:1:1, v/v) containing their respective ISs,Biomolecules 2023, 13, 383 9 of 24
and then purified by SPE-C18. CBs fractions were obtained by eluting the column with 1:1
(v/v) cyclohexane/ethyl acetate.
Then, for both analyses, lipid extracts were concentrated on a nitrogen stream evapora-
tor. The subsequent deconjugation and derivatization steps were performed to, respectively,
release the free steroids and to increase volatility, heat resistance, and ionizability. The
formation of pentafluorobenzyl oximes for NCI detection was followed by trimethylsilyl
ether formation for adequate sensitivity and selectivity. Then, the derivatized ST samples
and the dried CB samples reconstituted with methanol were transferred into autosampler
vials for mass quantification.
3. Results
3.1. Calibration Curves and Linearity
The calibration curves, consisting of ten points of calibration including the zero sam-
ples, LLOQ and ULOQ (Table 3), were obtained with increasing amounts of reference
standards supplementing with the same amount of ISs according to the isotopic dilution
method [51,52]. The ranges of the calibration curve were chosen to span across antic-
ipated concentrations of the target endogenous analytes in real human samples, with
an approximate average at the mid-level of the curve. This method used deuterated
analogues of analytes as ISs (Table 1). The ratio of the peak areas of each analyte to its
deuterated analogue was used for quantification, except for EPIPRAG, for which the ratio
EPIPRAG/PRAG-d4 was used to calculate its concentration since any deuterated analogue
of EPIPRAG was commercially available and both the chromatographic elution time and
physicochemical properties were similar between EPIPRAG and PRAG. In the zero samples
(CC0), only the known amount of ISs was added with no analyte of interest. Levels in the
calibration curves were expressed as absolute amounts of reference standards. As such, the
volume of the sample during extraction and/or injection can be adjusted for better sensitiv-
ity. For quantification, the ratio of peaks was plotted against a corresponding amount of
the calibration curve, which was then normalized to the volume of each analyzed sample.
Table 3. Calibration curve levels (from CC0 to CC9) expressed as absolute amounts of reference
standards for steroid (STs) (A) and cannabinoid (CBs) (B) assays.
(A) STs
Analyte Unit CC0 CC1 CC2 CC3 CC4 CC5 CC6 CC7 CC8 CC9
PREG pg 0 0.5 1 2 4 8 16 32 160 320
PROG pg 0 25 50 100 200 400 800 1600 8000 16,000
17OH-PROG pg 0 0.025 0.05 0.1 0.2 0.4 0.8 1.6 8 16
ALLO pg 0 0.5 1 2 4 8 16 32 160 320
EPIALLO pg 0 0.5 1 2 4 8 16 32 160 320
EPIPRAG pg 0 0.025 0.05 0.1 0.2 0.4 0.8 1.6 8 16
PRAG pg 0 0.025 0.05 0.1 0.2 0.4 0.8 1.6 8 16
3α,5α-THDOC pg 0 0.5 1 2 4 8 16 32 160 320
TESTO pg 0 0.5 1 2 4 8 16 32 160 320
DHEA pg 0 0.5 1 2 4 8 16 32 160 320
DHT pg 0 0.5 1 2 4 8 16 32 160 320
(B) CBs
Analyte Unit CC0 CC1 CC2 CC3 CC4 CC5 CC6 CC7 CC8 CC9
2-AG pmol 0 0.75 1.5 3 7.5 15 30 75 150 300
AEA pmol 0 0.075 0.15 0.3 0.75 1.5 3 7.5 15 30
OEA pmol 0 0.75 1.5 3 7.5 15 30 75 150 300
PEA pmol 0 0.75 1.5 3 7.5 15 30 75 150 300
THC ng 0 0.75 1.5 3 7.5 15 30 75 150 300
11COOH-THC ng 0 0.75 1.5 3 7.5 15 30 75 150 300
11OH-THC ng 0 0.75 1.5 3 7.5 15 30 75 150 300
pmol to pg conversion factor: pg = pmol × MW. MW (g/mol): 2-AG: 347.5; AEA: 378.5; OEA: 325.5; PEA: 299.5.Biomolecules 2023, 13, 383 10 of 24
A first preliminary test method was performed to choose the most appropriate matrix
by comparison of three calibration curves (in terms of slope, response, and recovery) in
different matrices: methanol, surrogate matrix (PBS containing 6% of BSA), and biological
matrix (human plasma). The surrogate matrix was used as an analyte-free matrix to
mimic the targeted biological matrix. Slope, intercept, r2 difference, and recovery were
compared to the methanol CC, used as a reference. CC points were accepted when the
residual accuracy from the theoretical concentrations was between 75% and 115%, and a
CC was accepted when at least 70% of the points had an accepted accuracy of the residuals.
Methanol CCs, prepared in triplicate, showed a good performance in terms of accuracy
and repeatability (within-day or intra-run precision). In surrogate and biological matrices,
recovery assessment was not always optimal and resulted in some unacceptable accuracy
values, particularly for compounds with high concentrations and/or low sensitivity. Thus,
only 5 out of 11 STs and four out of seven CBs were validated in PBS/BSA, and 7 out of
11 STs and two out of seven CBs were validated in human plasma. In addition, given that
the comparison test between CCs in each matrix and CCs in methanol was found to be
suitable, and that CCs in methanol provided better accuracy than CCs in the matrices, we
next tested the repeatability for linearity by comparing three additional CCs in methanol.
The CC of the 11 STs and seven CBs met the following acceptance criteria: accuracy within
±15% of the theoretical concentration for each point, 70% of the calibration samples above
acceptance criterion, the coefficient of correlation (R2) greater than 0.99, and the slope
significantly different from zero (p > 0.05). Hence, methanol CCs were used in the following
steps of the development of both methods.
3.2. Preparative Stability and Post-Preparative Stability at the Auto-Sampler Temperature
The preparative stability was tested for the preparation steps for the GC-MS/MS
and LC-MS/MS methods using three Stab samples at low and high concentrations (Stab
low and Stab high, respectively). The aim was to assess whether the several steps of the
sample preparation could be performed on successive days or on the same day (control
condition). The mean of the endogenous concentration was calculated and subtracted from
the concentration measured in each Stab sample. The mean of the concentrations observed
at each experimental condition was compared to the control condition by calculating
the% of the difference (i.e., coefficient of variation, CV) (results are shown in Table 4).
Acceptability was set at ±20%. The preparative stability met acceptance criteria at high
concentrations for the experimental conditions B (24 h at −20 ◦ C following extraction) for
all STs, but only for 4 out of 11 STs at low concentrations. At both concentrations, CVs < 20%
were obtained for condition C (24 h at −20 ◦ C following step 1 of derivatization), except for
17OH-PROG. For the CBs assay, the preparative stability met acceptance criteria for almost
all the CBs at the three conditions: delay at −20 ◦ C after purification (condition B), after
extraction (condition C), or after extraction and purification (condition D). CVs < 30% were
observed for OEA at low and high concentrations for conditions B and C, respectively, and
CVs > 30% were found at low concentrations for OEA (condition D) and 11COOH-THC at
the three conditions. According to these data, all steps in the preparation of experimental
biological samples in routine ST and CB measurements should be conducted on the same day.Biomolecules 2023, 13, 383 11 of 24
Table 4. Preparative stability for steroids (STs) (A) and cannabinoids (CBs) (B) expressed as mean%
difference from the control condition for Stab samples (n = 3) at low and high concentration levels
[C] (corresponding to CC2, CC8 concentration levels, respectively, of the calibration curve). The
occurrence of a 24 h time interval at −20 ◦ C between the successive extraction, purification, and
injection steps was tested. In condition B, extraction and purification were performed on the same
day, and injections were delayed by 24 h. In conditions C and D, extraction and purification were
separated by 24 h, and then injection was performed consecutively to purification or postponed for
24 h in conditions C and D, respectively.
A. STs
CONDITION B CONDITION C
Analyte Low [C] High [C] Low [C] High [C]
PREG 32.6% −3.1% 5.8% −3.7%
PROG 75.4% 12.5% 6.7% −3.2%
17OH-PROG 50.4% 11.5% −55.6% −37.5%
ALLO 73.2% −1.2% 7.6% −11.0%
EPIALLO 44.1% −0.4% 1.6% 0.2%
EPIPRAG 36.7% −1.1% 23.4% −0.9%
PRAG 82.5% 4.5% 22.8% −2.7%
3α,5α-THDOC −3.7% 13.7% −15.3% 15.6%
DHEA −6.2% 2.8% −12.2% 2.8%
TESTO 5.2% −8.7% 5.5% −8.5%
DHT 4.3% 3.4% 2.4% 2.6%
B. CBs
CONDITION B CONDITION C CONDITION D
Analyte Low [C] High [C] Low [C] High [C] Low [C] High [C]
2-AG 9.2% 2.4% 15.4% 3.8% 7.6% 3.9%
AEA 12.2% 0.4% 8.9% 1.3% 6.9% 5.0%
OEA −30.8% −14.4% 3.3% −23.8% −45.1% −14.8%
PEA −14.2% −3.1% −12.8% 3.7% −6.2% −9.1%
THC −3.3% −0.5% −3.2% −1.0% −0.1% −1.5%
11COOH-THC 50.1% −13.9% 76.5% −6.2% 128.7% −19.9%
11OH-THC 0.2% 2.3% −0.1% −1.9% 3.5% −3.9%
Values highlighted in light grey are between 20% and 30%. Values highlighted in dark grey are >30%.
The post-preparative stability test consisted of evaluating the processed sample sta-
bility at the auto-sampler temperature at RT or 9 ◦ C according to the GC-MS/MS or
LC-MS/MS methods, respectively. Three Stab samples at two concentration levels (low and
high) were assayed, and the same sample was assayed at T0 and at three periods of time: T1
(12 h), T2 (24 h), and T3 (36 h). The mean of the endogenous concentration was calculated
and subtracted from the concentration measured in each Stab sample. For each period, the
mean concentrations observed (n = 3) in Stab samples at each concentration level (low or
high) was compared to the mean concentration observed at T0 (results are shown in Table 5).
Acceptability was set at ±20%. The corresponding CVs of post-preparative stability were
acceptable or close to acceptance for all CBs and STs at T1, except for 11OH-THC at low
concentration. CVs < 20% were obtained for 10 out of 11 STs (CV > 30% for PROG) at low
concentrations and for all STs at high concentrations at T2, and 9 out of 10 STs (CV > 30%
for PREG and EPIALLO) at high concentrations and for all STs at low concentrations at
T3. In addition, post-preparative stability met acceptance criteria for five out of seven CBs
(20% < CV < 30% for OEA; CV > 30% for 11OH-THC) at low concentrations and for all
CBs at high concentration at T2, and for five out of seven CBs (CV > 50% for OEA and
11OH-THC) at low concentrations and for six out of seven CBs (CV > 50% for OEA) at high
concentration at T3. Overall, these data demonstrate that injection on the auto-sampler
should be carried out within 12 h after extraction for both STs and CBs.Biomolecules 2023, 13, 383 12 of 24
Table 5. Post-preparative stability for steroids (STs) (A) and cannabinoids (CBs) (B) at the auto-
sampler temperature expressed as mean% difference (n = 3) from T0 (T1: 12 h delay; T2: 24 h delay;
T3: 36 h delay) at low and high concentration levels [C] (corresponding to CC2, CC8 concentration
levels, respectively, of the calibration curve).
(A) STs
T1 T2 T3
Analyte Low [C] High [C] Low [C] High [C] Low [C] High [C]
PREG 12.5% 1.6% 0.2% 0.3% 9.5% −31.8%
PROG −20.5% 0.4% −49.6% −4.2% −9.0% 1.5%
17OH-PROG −14.2% −8.7% −5.0% −6.5% −9.7% −4.5%
ALLO −2.5% 4.0% 2.4% 2.5% 2.8% 4.7%
EPIALLO 8.1% −4.4% −5.3% −2.7% 14.7% −34.0%
EPIPRAG −5.7% −1.3% 6.5% 6.5% 0.2% 14.6%
PRAG −22.8% −6.2% −8.5% 0.9% −16.3% 9.1%
3α,5α-THDOC −1.9% −1.2% −2.2% 2.0% −16.3% −24.2%
DHEA 6.5% 3.0% 6.2% 2.7% 2.1% 4.7%
TESTO −3.4% −0.5% −3.8% 1.6% −1.3% −4.9%
DHT 0.0% 0.2% 3.2% 5.5% −4.9% 2.4%
(B) CBs
T1 T2 T3
Analyte Low [C] High [C] Low [C] High [C] Low [C] High [C]
2-AG −9.7% −8.4% −8.5% −5.9% −18.3% −14.6%
AEA −4.3% −2.9% 0.9% 5.2% −9.4% −14.6%
OEA 3.8% −12.1% 26.0% 8.2% −80.5 −82.2%
PEA 5.1% −6.8% 10.2% −3.3% 3.7% −11.3%
THC −6.9% −8.3% −8.4% −7.9% −8.0% −6.7%
11COOH-THC 9.8% −10.8% 23.4% 1.5% 24.0% 6.8%
11OH-THC 63.9% −8.2% 31.9% −10.8% 50.3% −4.5%
Values highlighted in light grey are between 20% and 30%, and in dark grey are >30%.
3.3. Selectivity
Although all deuterated ISs were commercially certified (at least 95% of purity,
Table S1), the deuterium stability was tested and the cross-contamination between com-
pounds and their respective ISs was evaluated, calculating the percentage of the area of
each compound in the ISs analyzed at working concentration. The concentration of each IS
was chosen to obtain peak areas that could be measured with good accuracy and precision,
corresponding to ~10-fold mid-concentration of the calibration curve. No H/D exchange
was found for the ISs, except for 3α,5α-THDOC-d4 which lost one deuterium, resulting
in the analysis of 3α,5α-THDOC-d3. The calculated% of analyte in IS solution was lower
than 0.03% for six out of seven CBs and 2 STs (ALLO-d4 and DHT-d3) out of 11. It was
lower than 0.9% for THC-d3, and the other STs, except for 3α,5α-THDOC-d3, for which
new stock and working solutions were made to meet acceptance criteria. In addition, the
percentage of ISs in the compound was analyzed at ULOQ. The calculated% ISs in the
analyte solutions was between 0.02% and 0.8%, except for the steroid TESTO, for which
new stock and working solutions, then reaching the acceptance criteria, were made. Thus,
in our routine analysis, special attention was paid to selectivity, and new stock and working
solutions were prepared as necessary. Therefore, in each run of human samples, ISs at the
working concentration were analyzed in zero samples (blank samples spiked with ISs), to
check the percentage of the compound (target analyte) in the IS solution.
3.4. Determination of the LLOQ
LLOQ was determined as the smallest amount that could be quantified for each analyte
with acceptable accuracy from the theoretical value (±20%) and precision (CV < 20%). LLOQ
was corresponding to the lowest quantifiable point of the CC (CC1) (Table 3).Biomolecules 2023, 13, 383 13 of 24
3.5. Matrix Effect
The matrix effect was tested by comparing Val samples in the biological matrix and
methanol at three concentration levels (low, mid, and high) with the acceptance criterion
set within ±20%. The results are shown in Table 6. A good percentage of difference was
calculated for almost all the STs and CBs at mid and high concentrations, although the
% difference was above but very close to ±20% for PROG, EPIPRAG, and PRAG at the
high level and for PEA at the mid-level. At low concentrations, only 2 STs (ALLO and
TESTO) out of 11, and four (2-AG, PEA, THC, 11OH-THC) out of seven CBs reach good
acceptability, mainly due to the presence of endogenous STs and CBs in the biological
matrix. This may explain the better validation criteria obtained for CBs in methanol.
Table 6. Matrix effect for steroids (STs) (A) and cannabinoids (CBs) (B) expressed as the% difference
at low, mid, and high concentration levels [C] (corresponding to CC2, CC4, and CC8 concentration
levels, respectively, of the calibration curve).
(A) STs
Analyte Low [C] Mid [C] High [C]
PREG 31.2% 15.6% 9.4%
PROG 109.0% 234.0% 23.1%
17OH-PROG 596.8% −11.2% −11.2%
ALLO 10.9% −10.2% −0.3%
EPIALLO 105.1% 3.3% 13.5%
EPIPRAG 65.8% 50.8% 29.3%
PRAG 106.3% 32.0% 28.9%
3α,5α-THDOC 208.8% 23.2% −4.7%
DHEA −97.4% −5.9% −15.0%
TESTO −3.7% 22.4% 10.1%
DHT 40.5% 9.9% 2.4%
(B) CBs
Analyte Low [C] Mid [C] High [C]
2-AG 10.0% −3.4% 9.6%
AEA 51.6% −3.4% 7.0%
OEA −491.4% −13.9% 7.8%
PEA −7.1% −23.0% 3.8%
THC 19.1% 3.5% 5.2%
11COOH-THC 629.9% 1.9% −11.6%
11OH-THC 4.3% −0.7% 8.5%
Values highlighted in light grey are between 20% and 30%, and in dark grey are >30%.
3.6. Carry-Over
Six blank samples in methanol were analyzed after ULOQ to evaluate carry-over. This
experiment was repeated six times. The percentage of the area contained in the blank was
calculated compared to the LLOQ area, using an acceptance criterion of ±20%. No carry-over
was observed for 8 STs out of the 11 included in the method. For TESTO, ALLO, and EPIALLO,
carry-over in the first blank was observed only in one ULOQ analysis out of six. Carry-over
was found for five out of seven CBs (it was absent for 11COOH-THC and 11OH-THC) in the
first blank sample analysis, while it was absent in the following five blanks.
As a result, we decided in our method to add three methanol blank injections in
the analytical run following the ULOQ sample, corresponding to the highest point of the
CC (CC10), and one methanol blank sample following CC6, CC7, and CC8. These blank
injections were used in all the analytical runs for human sample quantification. In the
biological samples, no carry-over was observed in the washing vial (with pure methanol)
used to clean the syringe before the injection of each sample.Biomolecules 2023, 13, 383 14 of 24
3.7. Within and between Run Accuracy and Precision
Accuracy and precision were determined within and between runs, to assess the re-
peatability and degree of closeness to the theoretical values of the measurements. Accuracy
represents the evaluation of the measurement compared to the true value [12,14,15]. It
was assessed by calculating the deviation of a predicted concentration from its nominal
value. The precision of the analytical system is a measure of the repeatability of instrument
performance determined by repetitive injection of the same sample. Three concentrations
were evaluated for each compound: low, mid, and high concentrations. Three different
analytical sequences were analyzed on three different days (n = 5 per run and per con-
centration for each sequence). The within-run accuracy was calculated with the% error
taking into account the five replicates of each run, and the between-run accuracy was
calculated with the between-run% error taking into account the 15 replicates of the three
runs. The within-run precision was evaluated with the% within-run coefficients of varia-
tion (CV) using the within-group mean square (WMS) value obtained from the ANOVA.
The between-run precision was evaluated with the% between-run coefficients of variation
using the between-group mean square (BMS) and WMS values obtained from the ANOVA.
Accuracy and precision acceptability were established at CV < 20% and ±20%, respec-
tively. Accuracy and precision results for both STs and CBs are shown in Tables 7 and 8,
respectively. Overall, STs showed good accuracy and precision, except at low levels for
17OH-PROG, EPIPRAG, DHEA, TESTO, and DHT that display some CV in the range of
30–50%, and for EPIALLO, PROG, and 3α,5α-THDOC, which had a CV > 50%. In addition,
PROG accuracy was not acceptable at the mid-concentration three times out of four. Values
of both accuracy and precision were acceptable or close to the acceptance threshold for
all the CBs, except 11COOH-THC accuracy at low concentration and both accuracy and
precision for OEA at all levels.
Table 7. Within- and between-run accuracy for steroids (STs) (A) and cannabinoids (CBs) (B) at low,
mid, and high concentration levels [C] (corresponding to CC2, CC4, and CC8 concentration levels,
respectively, of the calibration curve).
(A) STs
Analyte LLOQ [C] Low [C] Mid [C] High [C]
Within—Day1 7.3% 8.1% −0.9% 5.2%
Within—Day2 −9.1% 18.6% −0.2% 4.1%
PREG Within—Day3 5.8% −2.6% −1.6% 5.9%
Between 1.3% 8.0% −0.9% 5.0%
Within—Day1 −35.6% −48.9% −14.3% −16.7%
Within—Day2 −82.8% −81.8% −48.6% −7.7%
PROG
Within—Day3 −82.7% −24.6% −27.2% −14.8%
Between −59.2% −55.9% −34.5% −13.1%
Within—Day1 37.9% 18.5% −17.0% −12.8%
Within—Day2 6.6% 15.0% 5.7% −7.6%
17OH-PROG Within—Day3 14.8% −2.6% −15.2% −9.8%
Between 19.8% 10.3% −8.8% −10.1%
Within—Day1 −2.8% 9.7% −9.7% −0.7%
Within—Day2 −9.7% 3.6% −12.4% −21.7%
ALLO
Within—Day3 −14.3% −5.0% −12.6% −12.7%
Between −8.9% 2.7% −11.6% −11.7%
Within—Day1 −10.6% −5.3% −19.9% −13.6%
EPIALLO Within—Day2 −22.6% −14.9% −16.6% −12.9%
Within—Day3 −15.6% −55.4% −24.8% −13.9%
Between −19.6% −25.2% −20.4% −13.5%Biomolecules 2023, 13, 383 15 of 24
Table 7. Cont.
Within—Day1 −30.8% −22.3% −0.4% −11.5%
Within—Day2 −3.7% −2.6% −7.4% −9.3%
PRAG
Within—Day3 −21.0% −12.8% −8.8% −5.8%
Between −21.8% −12.6% −5.6% −8.9%
Within—Day1 14.3% 0.0% −0.2% 7.3%
Within—Day2 −18.0% −32.3% −21.0% −14.0%
EPIPRAG Within—Day3 −10.9% −6.9% −11.9% −6.5%
Between −4.9% −13.1% −11.0% −4.4%
Within—Day1 63.8% 26.4% 10.1% −3.1%
Within—Day2 80.0% 76.9% 11.2% 1.6%
3α,5α-THDOC
Within—Day3 45.4% 31.2% 10.5% −2.6%
Between 62.1% 37.9% 10.6% −1.3%
Within—Day1 38.0% 37.4% −7.7% −0.5%
Within—Day2 15.6% 13.3% −8.7% −10.7%
DHEA
Within—Day3 20.3% 13.4% −5.4% −8.6%
Between 24.6% 21.4% −7.3% −6.6%
Within—Day1 −48.2% −46.1% 9.9% 18.2%
Within—Day2 −48.7% −41.5% 12.0% 15.3%
TESTO
Within—Day3 −5.7% −17.6% 11.8% 12.1%
Between −25.7% −22.3% 11.3% 15.2%
Within—Day1 −14.6% 0.1% −14.2% −8.4%
Within—Day2 −21.1% −20.4% −23.9% −20.1%
DHT
Within—Day3 −23.6% −9.2% −10.5% −16.6%
Between −23.1% −9.8% −16.2% −15.0%
(B) CBs
Analyte LLOQ Low Mid High
Within—Day1 7.7% 0.9% 3.6% −2.1%
Within—Day2 −6.4% 2.8% −8.6% −3.5%
2-AG
Within—Day3 −2.8% −4.8% −8.8% −6.5%
Between −0.5% −6.4% −4.6% −4.1%
Within—Day1 −4.4% −1.1% 6.8% −3.6%
Within—Day2 −14.5% −3.2% −1.5% −13.7%
AEA
Within—Day3 −5.8% −0.3% 3.3% −10.1%
Between −8.2% −1.5% 2.9% −9.1%
Within—Day1 20.2% 17.2% 0.6% −27.1%
Within—Day2 −52.4% −57.6% −48.0% −56.2%
OEA
Within—Day3 15.1% 44.1% 39.0% 35.5%
Between −34.5% −22.1% −21.9% −20.9%
Within—Day1 15.8% 14.7% 0.2% −2.6%
Within—Day2 11.8% 16.1% −2.0% −0.9%
PEA
Within—Day3 4.8% 7.5% −0.7% −8.4%
Between 10.8% 12.8% −0.8% −0.8%
Within—Day1 22.4% 10.5% 12.8% 11.5%
Within—Day2 28.3% 23.5% 22.5% 17.3%
THC
Within—Day3 16.0% 9.9% 7.5% 0.7%
Between 23.5% 14.6% 15.3% 9.8%
Within—Day1 28.8% 24.8% 24.8% 10.1%
Within—Day2 31.5% 33.2% 23.8% 12.1%
11COOH-THC
Within—Day3 26.9% 20.8% 18.3% 8.5%
Between 28.2 26.7% 22.6% 10.2%
Within—Day1 −3.1% −9.3% −13.3% −19.9%
Within—Day2 11.1% 20.3% 0.8% −13.8%
11OH-THC
Within—Day3 −4.3% −5.7% −13.4% −26.2%
Between 1.2% 1.8% −8.6% −21.3%
Values not highlighted are in the acceptance criteria (±20%). Values highlighted in light gray are between ±30%
and in dark gray are not included in the ±30% limits.Biomolecules 2023, 13, 383 16 of 24
Table 8. Within- and between-run precision for steroids (STs) (A) and cannabinoids (CBs) (B) at
low, mid, and high concentration levels (corresponding to CC2, CC4, and CC8 concentration levels,
respectively, of the calibration curve).
(A) STs
Analyte LLOQ [C] Low [C] Mid [C] High [C]
Within 18.8% 16.1% 10.2% 6.8%
PREG
Between 1.2% 1.9% 10.2% 6.8%
Within 67.1% 69.1% 23.1% 11.4%
PROG
Between 21.6% 2.8% 1.7% 0.0%
Within 42.8% 40.9% 20.4% 9.6%
17OH-PROG
Between 21.6% 40.9% 1.9% 9.6%
Within 22.8% 27.6% 14.7% 4.8%
ALLO
Between 22.8% 27.6% 14.7% 4.8%
Within 29.6% 57.4% 17.8% 7.1%
EPIALLO
Between 3.2% 10.6% 17.8% 7.1%
Within 48.8% 21.0% 12.2% 8.1%
PRAG
Between 5.1% 21.0% 12.2% 8.1%
Within 11.2% 27.8% 17.9% 10.2%
EPIPRAG
Between 9.9% 7.8% 1.8% 0.8%
Within 3.3% 6.7% 6.6% 3.4%
3α,5α-THDOC
Between 1.2% 0.8% 6.6% 0.1%
Within 17.8% 11.1% 6.3% 1.9%
DHEA
Between 5.0% 3.5% 6.3% 0.5%
Within 40.8% 30.4% 23.7% 18.4%
TESTO
Between 40.8% 30.4% 23.7% 18.4%
Within 23.8% 10.8% 22.8% 1.8%
DHT
Between 23.8% 10.8% 22.8% 0.7%
(B) CBs
Analyte LLOQ [C] Low [C] Mid [C] High [C]
Within 10.8% 9.7% 8.7% 2.6%
2-AG
Between 3.2% 9.7% 3.1% 0.3%
Within 19.5% 9.7% 5.6% 4.9%
AEA
Between 19.5% 9.7% 1.8% 2.8%
Within 7.3% 4.4% 9.6% 51.4%
OEA
Between 38.1% 41.6% 29.8% 7.2%
Within 4.0% 7.2% 4.7% 2.6%
PEA
Between −0.8% 1.4% 4.7% 1.4%
Within 4.1% 7.2% 2.2% 2.0%
THC
Between 2.0% 3.7% 3.4% 3.4%
Within 5.0% 7.1% 4.5% 3.5%
11COOH-THC
Between 5.0% 2.0% 4.5% 0.2%
Within 5.4% 1.8% 1.8% 4.2%
11OH-THC
Between 3.3% 7.4% 4.1% 2.4%
Values not highlighted are in the acceptance criteria (CV < 20%). Values highlighted in light gray are between
20% < CV < 30%, and in dark gray are >30%.
3.8. Solution Stability in the Solvent at RT and during Storage at −20 ◦ C
The stability of compounds was checked for both stock solutions (StSs) and working
solutions (WSs) of analytes and ISs. StSs corresponded to the most concentrated standard or
IS solutions, purchased from a specialized commercial supplier, from which stock solutions
and working solutions are made (Table S1). StSs were purchased as powders, with a known
referenced weight, and then dissolved in a solvent or purchased as a liquid solution with a
known referenced concentration. The stability was evaluated for freshly made WSs at room
temperature for 4 h to mimic the time they are on the bench during the preparation of a CCBiomolecules 2023, 13, 383 17 of 24
(usually not more than two hours, but it was considered in excess). For both WSs and StSs,
the stability was calculated after 3 months at −20 ◦ C. This would be the maximum storage
time between each preparation of fresh solutions. Results, calculated as a mean% difference
between a fresh solution and an evaluated solution in terms of mean area ratio (analyte
area/IS area) are shown in Table 9. Acceptability was set at ±20%. Stability was good after
four hours at room temperature for all the compounds, except for EPIPRAG and TESTO,
which had 20% < CV < 30%. Following the 3 months at −20 ◦ C, the mean% difference
values for StSs and WSs met acceptability for almost all the compounds. A 20% < CV <
30% was observed for the StSs of PROG, ALLO, TESTO, AEA and the WSs of 17OH-PROG,
EPIPRAG, 2-AG, AEA, and OEA. In addition, the StS of OEA and WS of PROG had a
CV > 30%. Hence, in our methods for human samples, StSs and WSs were prepared within
a shorter time frame to meet the acceptance criteria.
Table 9. Solution stability for steroids (STs) (A) and cannabinoids (CBs) (B) expressed as mean%
difference (n = 3) from a fresh solution.
(A) STs (B) CBs
T0 T1 T0 T1
Analyte WS Analyte WS
StS WS StS WS
(4 h at RT) (4 h at RT)
PREG 1.0% −15.0% −3.2% THC 4.8% −15.4% −2.0%
PROG 3.8% −28.2% −43.6% 11COOH-THC −5.4% −9.9% −0.2%
17OH-PROG −2.6% 4.3% 20.3% 11OH-THC −4.6% 4.5% 9.6%
ALLO 9.4% −23.8% −5.8% 2-AG −5.0% 5.9% 23.8%
EPIALLO −10.7% −8.5% 2.2% AEA −2.9% −20.2% −20.1%
EPIPRAG −21.6% −6.4% −24.1% OEA 16.3% −30.2% −24.0%
PRAG −11.7% 3.1% −9.9% PEA 0.9% −6.4% 15.5%
3α,5α-THDOC −3.9% −8.4% −8.8%
DHEA −4.8% −7.3% −8.4%
TESTO −27.0% 25.5% 11.2%
DHT −9.6% −2.9% −9.4%
Values not highlighted are in the acceptance criteria (30%.
3.9. Freeze and Thaw Stability
The freeze and thaw stability tests were assessed with three freeze/thaw cycles (T0,
T1, T2, T3) with a 24 h-delay between each of them for four Stab samples at middle and
high concentrations. This test aimed at assessing how many times a biological matrix
sample (plasma) could be successively thawed without interfering with analyses. The
mean percentage of the difference between the analyzed time point and time zero (T0)
was calculated. The results are listed in Table 10. Our results clearly showed that thawing
a sample for the third time was altering the measurement of almost all the compounds,
except for TESTO, DHT, and 11COOH-THC. Results for high concentrations were good
at the second cycle for all the compounds, while at medium concentration some of the
STs presented levels lower than T0. A single freeze/thaw cycle did not compromise the
accuracy of the measurement for any compounds at all concentrations, except for 3α,5α-
THDOC. Therefore, we strongly advise and ensure that the cold chain of samples should
not be interrupted during sample preparation and storage for ST and CB assays.You can also read