Pan-Cancer Analysis of Human Kinome Gene Expression and Promoter DNA Methylation Identifies Dark Kinase Biomarkers in Multiple Cancers
←
→
Page content transcription
If your browser does not render page correctly, please read the page content below

cancers
Article
Pan-Cancer Analysis of Human Kinome Gene Expression and
Promoter DNA Methylation Identifies Dark Kinase
Biomarkers in Multiple Cancers
Siddesh Southekal               , Nitish Kumar Mishra *          and Chittibabu Guda *

                                          Department of Genetics, Cell Biology, and Anatomy, University of Nebraska Medical Center, Omaha,
                                          NE 68198-5805, USA; siddesh.southekal@unmc.edu
                                          * Correspondence: nitish.mishra@unmc.edu (N.K.M.); babu.guda@unmc.edu (C.G.); Tel.: +1-402-559-5954 (C.G.)

                                          Simple Summary: Due to their central role in many biological processes, studies on protein kinases
                                          are an area of active research. In the last few decades, several inhibitors that target kinases have
                                          been approved by U.S. Food and Drug Administration (FDA). However, a large proportion of
                                          kinases remain uncharacterized, with very little information on their functionality. Variations in
                                          genome-wide DNA methylation and gene expression pattern have been extensively studied in many
                                          cancers. However, an extensive kinome-centered pan-cancer methylation and expression analysis
                                          are still lacking. This study aims to identify prognostic and diagnostic biomarkers, focusing on
                                          uncharacterized (dark) kinases to further encourage their research as therapeutic targets.

                                          Abstract: Kinases are a group of intracellular signaling molecules that play critical roles in various
                                biological processes. Even though kinases comprise one of the most well-known therapeutic targets,

                                          many have been understudied and therefore warrant further investigation. DNA methylation
Citation: Southekal, S.; Mishra, N.K.;
                                          is one of the key epigenetic regulators that modulate gene expression. In this study, the human
Guda, C. Pan-Cancer Analysis of
                                          kinome’s DNA methylation and gene expression patterns were analyzed using the level-3 TCGA
Human Kinome Gene Expression and
Promoter DNA Methylation
                                          data for 32 cancers. Unsupervised clustering based on kinome data revealed the grouping of cancers
Identifies Dark Kinase Biomarkers in      based on their organ level and tissue type. We further observed significant differences in overall
Multiple Cancers. Cancers 2021, 13,       kinase methylation levels (hyper- and hypomethylation) between the tumor and adjacent normal
1189. https://doi.org/10.3390/            samples from the same tissue. Methylation expression quantitative trait loci (meQTL) analysis using
cancers13061189                           kinase gene expression with the corresponding methylated probes revealed a highly significant
                                          and mostly negative association (~92%) within 1.5 kb from the transcription start site (TSS). Several
Academic Editor: Jerome Solassol          understudied (dark) kinases (PKMYT1, PNCK, BRSK2, ERN2, STK31, STK32A, and MAPK4) were
                                          also identified with a significant role in patient survival. This study leverages results from multi-
Received: 2 February 2021
                                          omics data to identify potential kinase markers of prognostic and diagnostic importance and further
Accepted: 8 March 2021
                                          our understanding of kinases in cancer.
Published: 10 March 2021

                                          Keywords: pan-cancer; kinome; dark kinase; understudied kinase; CpG methylation; correlation
Publisher’s Note: MDPI stays neutral
                                          analysis; survival analysis; promoter; TCGA
with regard to jurisdictional claims in
published maps and institutional affil-
iations.

                                          1. Introduction
                                               Cancer is a heterogeneous disease that has contributed to approximately 606,520
Copyright: © 2021 by the authors.
                                          projected deaths in the United States alone in 2020 [1]. Unfortunately, it is also a disease
Licensee MDPI, Basel, Switzerland.
                                          that is extremely challenging to treat due to the heterogeneous nature of the tumors and
This article is an open access article
                                          the lack of a variety of drugs that are effective against different tumor subtypes. Oncogene
distributed under the terms and           activation and the inactivation of tumor suppressors, in which protein kinases play a
conditions of the Creative Commons        large role, are the major drivers contributing to cancer development [2]. The activity
Attribution (CC BY) license (https://     profile of kinases has been identified to be very distinct in tissue groups, namely, healthy,
creativecommons.org/licenses/by/          immunological and hematological, solid cancers, and mixed tissues [3]. Similarly, high
4.0/).                                    tissue specificity of kinase gene expression has been shown in normal tissue datasets from

Cancers 2021, 13, 1189. https://doi.org/10.3390/cancers13061189                                            https://www.mdpi.com/journal/cancers
Cancers 2021, 13, 1189                                                                                            2 of 17

                         GTEx [4]. Therefore, it is imperative to dissect cancer-associated kinase genes in tumor
                         subtype and identify effective therapeutic targets.
                               The human protein kinases (known collectively as the kinome) represent an essential
                         and diverse family of enzymes often dysregulated in cancer. There are around 518 known
                         kinase genes in the human genome, and 478 of these belong to the classical protein kinase
                         family, and 40 are atypical protein kinases [5]. Approximately 10% of them belong to the
                         pseudokinase family, which lack catalytic activity and are distributed across all kinase
                         families [6]. Although the human kinome is encoded by only 2% of the total coding genes,
                         these proteins phosphorylate about 30% of the cellular proteins critical for regulation
                         of various biological processes such as proliferation, cell cycle progression, apoptosis,
                         motility, growth, and differentiation. Kinases are essential mediators of intracellular signal-
                         transduction pathways and mediate many critical events such as cell fate determination
                         and cell cycle control, making the study of kinome profiles very relevant in understanding
                         cancer initiation and progression. Besides, dysregulation of kinase activity by events such
                         as altered expression, copy number amplification, aberrant phosphorylation, somatic mu-
                         tation, chromosomal translocation, and epigenetic regulation are also frequently oncogenic
                         or tumor-suppressive and can be critical for disease progression and metastasis. Due to
                         an accessible binding pocket and identified dysregulation in many diseases, including
                         cancer, kinases are one of the most explored classes of therapeutic cancer targets. However,
                         among the FDA-approved kinase inhibitors, many drugs inhibit off-target kinases with
                         varying potency. These unselective interactions and inhibition of other non-kinase targets
                         emphasize the importance of better target identification [7]. In recent years, there has been
                         a significant improvement in understanding the role of epigenetic factors in cancer. This
                         knowledge can be used to combine epigenetic therapies and other agents in combination
                         therapies [8]. Recent systematic studies of the kinome drug-target interaction profiles
                         have shown drug discovery research mainly focused on tyrosine (Tyr) kinase family [9].
                         In contrast, a large fraction of the kinome target space remains unexplored. This also
                         includes the pseudokinase families, which are usually overlooked despite their links to
                         many cancers, which can be attributed to the lack of small molecule inhibitors and assays
                         to evaluate their mechanisms of action [6,10]. As of 2019, only 8% of FDA-approved small
                         molecule inhibitors target kinases, most (70%) of which belong to the Tyr kinase family [11].
                         While significant kinase research has been focused on Tyr and Ser/Thr kinases, those
                         belonging to other families have often been understudied, with very little information
                         available on their role in cellular processes and their use as druggable targets. Based on an
                         initial study by the National Institutes of Health (NIH), 134 protein kinases are classified
                         as ‘under-studied’ or ‘dark kinases’ based on Jenson PubMed and RO1/PubTator score.
                         Most of these dark kinases belong to the ‘other’, CMGC, Ca2+ /calmodulin-dependent
                         protein kinase (CaMK) groups [11,12]. Data resources such as the dark kinase knowledgebase
                         (DKK), supported through NIH’s Illuminating the Druggable Genome (IDG) program, col-
                         lates both experimental and bioinformatic data to encourage the study of understudied
                         kinases [13,14]. Among the 162 dark kinases listed in DKK, the focus proteins include Pro-
                         tein Kinase, Membrane Associated Tyrosine/Threonine 1 (PKMYT1), Tousled-like kinase 2
                         (TLK2), BR serine/threonine kinase 2 (BRSK2), cyclin-dependent kinase 12 (CDK12), and
                         cyclin-dependent kinase 13 (CDK13) kinases. Recent structural studies have also focused
                         on Tyr pseudokinases such as ROR1 to understand their mechanism and target them
                         pharmacologically [15]. Other high-throughput screening methods to identify functional
                         analogs to pseudokinase, Kinase suppressor of Ras 1 (KSR1) (involved in EGFR-Ras-MAP
                         kinase pathway) have been recently published [16].
                               Methylation of CpG sites is an epigenetic process which play a crucial role in gene
                         expression regulation. Often methylated CpG sites are observed at high frequency in
                         specific genomic regions called CpG islands. Several genome-wide methylome analyses
                         and correlation analyses in cancer have revealed aberrant methylation profiles [17]. Ear-
                         lier methylation studies in kinases have focused on a few selected kinase genes or gene
                         families in specific cancer types. For instance, Kuang et al. conducted a comprehensive
Cancers 2021, 13, 1189                                                                                          3 of 17

                         genome-wide analysis of the Eph/ephrin receptor tyrosine kinase family and identified 15
                         hypermethylated genes in acute lymphoblastic leukemia [18]. Similarly, other experimental
                         studies have focused on the expression and promoter methylation of SRC, LYN and CKB
                         kinases in gastric and CHK2 kinase in non-small cell lung cancers, respectively [19,20].
                         Although a large scale bioinformatic study has been performed on the comparison of
                         expression levels of 459 kinase genes in 5681 normal and tumor tissues [3], there are no
                         comprehensive pan-cancer correlative studies between gene expression and methylation
                         data of kinome using TCGA data, to-date.
                              This study analyzed the global human kinome expression and corresponding pro-
                         moter DNA methylation profiles across 32 TCGA cancer types to study the altered kinome
                         expression profiles and correlate with corresponding promoter methylation status. Us-
                         ing this information, we identified potential kinase biomarkers with clinical relevance.
                         Based on Cox-regression analysis and log-rank test, we further highlight the role of com-
                         monly upregulated dark kinases, PKMYT1, Pregnancy Up-Regulated Nonubiquitous CaM
                         Kinase (PNCK), BRSK2, Endoplasmic Reticulum To Nucleus Signaling 2 (ERN2), and
                         Serine/Threonine Kinase 31 (STK31) in survival, which are potential therapeutic targets
                         and hence worth exploring [21]. We also demonstrate the ability of kinome expression
                         and methylation profiles to distinguish between 30 cancer types based on unsupervised
                         clustering analysis, further emphasizing the similarity of kinome activity within the organ
                         systems and the tissue and histological levels.

                         2. Materials and Methods
                         2.1. Data Retrieval
                              The initial list of 504 human kinase genes was downloaded from UniprotKB [22].
                         From there, we used a set of 496 kinase genes whose data are available in the harmonized
                         TCGA data from the GDC (Genomic Data Commons). The omitted genes include GRK2,
                         GRK3, MAP3K20, MAP3K21, PAK5, PRAG1, COQ8A, COQ8B, whose data are not present
                         across all the datatypes. TCGAbiolinks [23], a Bioconductor tool, was used to download the
                         level-3 DNA methylation (Illumina HumanMethylation450 BeadArray), FPKM-UQ gene
                         expression (Illumina HiSeq RNASeq V2) of 496 kinases, and clinical data of corresponding
                         tumor samples. DNA methylation data of 7245 probes in the promoter region (+/− 1.5 Kb
                         from the TSS) of the kinome gene set were retained. The curated annotation of the kinase
                         family was downloaded from UniProtKB. Duplicated samples were removed from further
                         analyses. The kinome gene set also consisted of a subset of 148 dark kinases out of the 162
                         understudied kinases listed in DKK. The list of kinase genes included in this study are
                         given in Supplementary Table S1. The complete list of TCGA cancer types abbreviations can
                         be found at https://gdc.cancer.gov/resources-tcga-users/tcga-code-tables/tcga-study-
                         abbreviations accessed on 2 February 2021.

                         2.2. Gene Expression Data
                              We downloaded fragments per kilobase of transcript per million mapped reads up-
                         per quartile (FPKM-UQ) data of 496 kinases. We then removed all genes with missing
                         expression values (for at least 25% of the samples) and genes that had CPM (count per
                         million) numbers less than one (for at least 25% of the samples). Differential gene expres-
                         sion (DGE) analysis was performed using the Bioconductor tool, limma following log2
                         normalisation [24]. Benjamini-Hochberg (BH) adjusted p-value cut-off of 0.005, and an
                         absolute log2 fold change of 1 was used to obtain the list of differentially expressed genes.

                         2.3. Methylation Data
                               The intensities of the methylated and unmethylated alleles at the analyzed CpG
                         sites were measured using the Beta-value (β), which ranges between 0 and 1. CpGs with
                         missing β values in >25% tumor and normal samples for each cancer were excluded
                         from further analysis. K-nearest neighbor-based Imputation method was used to fill the
                         missing β values using the imputeKNN module of the R tool, impute [25]. Correction
Cancers 2021, 13, 1189                                                                                           4 of 17

                         of type bias was done using the beta mixed-integer quantile normalization (BMIQ) [26]
                         using the R package, ChAMP [27]. CpG probes mapped against X, Y, and mitochondrial
                         chromosomes were excluded from analyses to eliminate gender bias. We also removed
                         the CpG probes that overlapped with repeat masker and SNPs from dbSNP v151 with
                         minor allele frequency (MAF) >1% [28] to help remove the sequence polymorphisms that
                         can affect DNA methylation readouts in the Infinium arrays. We retained β values of
                         7245 kinase-specific unique CpG probes within ±1500 bp from the TSS site for differential
                         methylation analysis in the final annotation file. We obtained differentially methylated
                         CpG probes with FDR 0.05 and mean β value difference of at least 0.2 (∆β ≥ 0.2).

                         2.4. t-SNE Plots
                              Dimensionality reduction using the t-SNE method was carried out for the expression
                         data of 496 kinases and corresponding 7245 BMIQ normalized β values of CpG probes
                         at the promoter region, both individually and combined. The combined final dataset
                         consisted of 7783 samples from 30 cancer types with kinase expression and methylation
                         data after removing the missing data. Lymphoid Neoplasm Diffuse Large B-cell Lymphoma
                         (DLBC) was omitted in the analysis due to lack of methylation data. Testicular Germ Cell
                         Tumors (TGCT) was omitted as it failed in BMIQ normalization as several samples doesn’t
                         follow beta distribution. Tumor histological subtype information was downloaded from
                         the GDC data portal. The expression data were normalized between 0 and 1 to remove bias
                         in the analysis. t-SNE was performed using the R package, Rtsne, to get the data points’
                         coordinates, which were colored as per the cancer types. 2D and 3D t-SNE plots were
                         generated using R packages, ggplot2 and plotly, respectively, and were colored as per the
                         TCGA tumor and tissue subtypes.

                         2.5. Correlation Analysis
                              Correlation analysis between DNA methylation and corresponding gene expression
                         was performed using meQTL based on non-zero Pearson correlation for samples with
                         both methylation and expression data using R tool, eMap. The association was considered
                         significant at Bonferroni corrected p-value < 0.05. No association was found to be significant
                         for ovarian cancer at this cut-off, and a raw p-value < 0.01 was used. R package ggplot2 was
                         used to generate bubble plots for genes, which were significant in > 30% of the cancers
                         analyzed for each of the kinase family.

                         2.6. Survival Analysis
                              Survival analysis was carried out using R tools, survival, and survMiner in the back-
                         ground, for promoter CpGs (±1500 bp from TSS) and the gene expression data. Patients
                         were segregated into high and low expression groups based on the expression median
                         value for each cancer. The β-value cut-off of ≥ 0.6 (high) and ≤ 0.4 (low) was used for
                         the analysis. Cox-regression analysis was performed, and a p-value ≤ 0.05 was used as
                         the cut-off to select significant genes and CpG probes. The results were integrated with
                         DE and DM analyses and meQTL analysis to generate the final table. Kaplan-Meier (KM)
                         survival plots were generated by using in-house R code [29]. Logistic regression analysis
                         was performed using R linear model (lm) function to categorize tumor and normal samples
                         using the gene expression and methylation data. The classifier performance was measured
                         by calculating the area under the curve (AUC). The receiver operating characteristic (ROC)
                         plots were generated using the ROCR R package [30].

                         3. Results
                             Our analyses were carried out using a set of 496 human kinases that contained DNA
                         methylation, gene expression, and clinical data for all tumor samples analyzed. This
                         kinome set was subjected to unsupervised clustering, differential gene expression and
                         methylation analyses, correlative analysis of gene expression and methylation, and survival
                         analysis, as described below.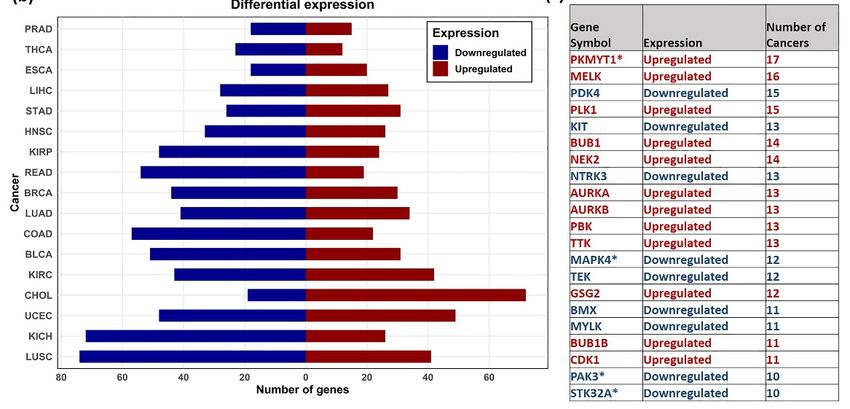
methylation analyses, correlative analysis of gene expression and methylation, and sur-
vival analysis, as described below.
3.1. Unsupervised Clustering of TCGA and GTEx Samples Based on Kinome Profiles
Cancers 2021, 13, 1189 5 of 17
Distinguish Cancer Types
We performed t-distributed stochastic neighbor embedding (t-SNE) method to inves-
tigate the pan-cancer gene expression
3.1. Unsupervised andofpromoter
Clustering TCGA and DNA methylation
GTEx Samples Based onpatterns in kinase
Kinome Profiles Distinguish
genes across 30 TCGA cancers. The t-SNE algorithm is a nonlinear dimensionality reduc-
Cancer Types
tion technique that is well-suited
We performed for embedding
t-distributed high-dimensional
stochastic data for (t-SNE)
neighbor embedding visualization
method to in-
in a low-dimensionalvestigate the The
space. pan-cancer
t-SNEgeneclustersexpression and promoter
represent spatiallyDNAnearbymethylation patterns in
objects and,
kinase genes across 30 TCGA cancers. The t-SNE algorithm
therefore, in this case, represent sample similarity. The t-SNE pattern obtained from gene is a nonlinear dimensionality
reduction technique that is well-suited for embedding high-dimensional data for visual-
expression and promoter methylation β values of tumor samples (Supplementary Figure
ization in a low-dimensional space. The t-SNE clusters represent spatially nearby objects
S1a,b), individually,
and,and when in
therefore, combined (Figure 1a–c)
this case, represent sampleshowed grouping
similarity. The t-SNEof pattern
cancersobtained
with- from
out prior knowledge geneof the sample
expression origin and
and promoter co-clustering
methylation of tumors
β values of tumor within
samplesan organ
(Supplementary
system indicating similarity in expression and methylation pattern of kinase genes. This,
Figure S1a,b), individually, and when combined (Figure 1a–c) showed grouping of cancers
without prior knowledge of the sample origin and
however, was not true when using a random set of ~500 protein-coding genes (Supple-co-clustering of tumors within an organ
system indicating similarity in expression and methylation pattern of kinase genes. This,
mentary Figure S1c), indicating that kinases, despite representing only 2% of the total hu-
however, was not true when using a random set of ~500 protein-coding genes (Supple-
man genes, are sufficient to distinguish different cancer types. Organ-based solid cancers
mentary Figure S1c), indicating that kinases, despite representing only 2% of the total
were observed to be in close
human genes, proximity; i.e.,tocore
are sufficient gastrointestinal
distinguish cancers—esophageal
different cancer types. Organ-based car-
solid can-
cinoma (ESCA), stomach
cers were adenocarcinoma
observed to be in close (STAD), colon
proximity; i.e.,adenocarcinoma
core gastrointestinal(COAD), rec-
cancers—esophageal
tum adenocarcinoma (READ);
carcinoma cancers
(ESCA), of the
stomach central nervous
adenocarcinoma system—glioblastoma
(STAD), colon adenocarcinoma mul- (COAD),
rectum adenocarcinoma (READ); cancers of
tiforme (GBM) and brain lower-grade glioma (LGG); thoracic—lung adenocarcinomathe central nervous system—glioblastoma
(LUAD) and lungmultiforme
squamous(GBM) and brain lower-grade glioma (LGG); thoracic—lung adenocarcinoma
cell carcinoma (LUSC); kidney cancers—kidney renal clear
(LUAD) and lung squamous cell carcinoma (LUSC); kidney cancers—kidney renal clear
cell carcinoma (KIRC), kidney(KIRC),
cell carcinoma chromophobe (KICH), kidney
kidney chromophobe (KICH), renal
kidneypapillary cell cell
renal papillary carci-
carcinoma
noma (KIRP); and(KIRP);
this clustering pattern was preserved even after the integration
and this clustering pattern was preserved even after the integration of expression of ex-
pression and methylation data types
and methylation (Figure
data types 1a–c).
(Figure 1a–c).
Figure 1. Distribution
Figure of the TCGA
1. Distribution cancer
of the TCGA samples
cancerin samples
2D t-SNE in
plot.
2D(a) x vs. yplot.
t-SNE (b) x(a)
vs.xz vs.
(c) yyvs.
(b)zxcoordinates
vs. z (c) y for
vs.6270
z
(combined kinase gene expression and promoter CpGs β values) features and 7783 TCGA tumor
coordinates for 6270 (combined kinase gene expression and promoter CpGs β values) features and samples belonging to 30
cancer types.
7783 The mapped
TCGA tumor data pointsbelonging
samples are colored to
as per the cancer
30 cancer types.
types. (d–f)
The 2D t-SNE
mapped plotpoints
data showing separation
are coloredofasTCGA
Esophageal, Lung Carcinoma and Cervical Cancer into Adeno and Squamous histological tissue types based on combined
kinase gene expression and methylation data of 930 samples which includes 71 esophageal adenocarcinoma, 80 esophageal
squamous cell carcinoma, 414 lung adenocarcinomas, 365 lung squamous cell carcinoma, 246 cervical squamous cell
carcinoma and 30 endocervical adenocarcinoma.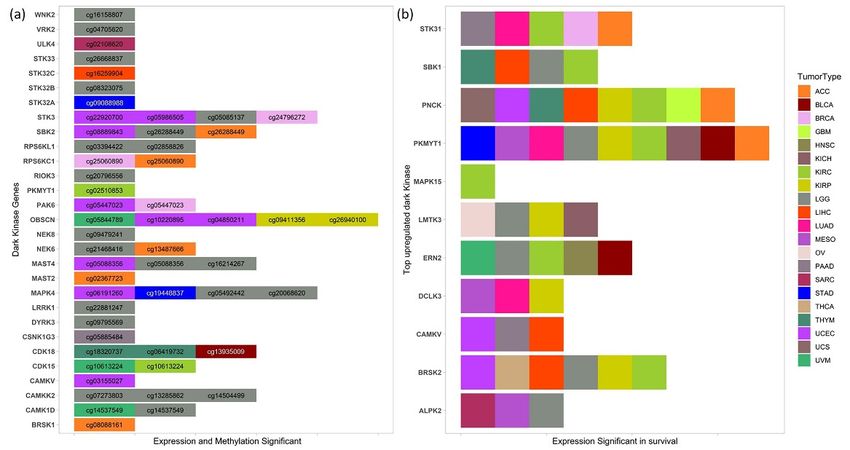
Cancers 2021, 13, 1189                                                                                            6 of 17

                               A closer, in-depth investigation of the global sample distribution revealed separation of
                         lung, cervical, and esophageal carcinomas into adenoma and squamous type (Figure 1d–f).
                         It is necessary to note that the kinome expression and methylation pattern in esophageal
                         and lung cancers are very similar, as reflected by their co-clustering in the global t-SNE
                         plot.
                               We wanted to explore further if this was true even for normal sample datasets. We,
                         therefore, analyzed the kinome expression data of 6199 tissue samples from healthy individ-
                         uals obtained from the Genotype-Tissue Expression (GTEx) project [31], which also revealed
                         easily distinguishable clusters based on the sample origin (Supplementary Figure S1d).
                         Two sub-clusters of the esophagus were observed. One belonging to the esophagus—
                         mucosa, and the other consisted of a mix of esophagus gastroesophageal junction and
                         esophagus muscularis. Two sub-clusters of skin were also observed—one consisting of
                         a mix of sun-exposed (lower leg) and not sun-exposed (suprapubic) and the other from
                         skin cells—transformed fibroblasts. Closer inspection of TCGA datasets also revealed sub-
                         clustering of tumor and adjacent normal samples indicating perturbation of kinase genes
                         in tumor samples with respect to normal tissue. For example, as shown in Supplementary
                         Figure S2a–d, the normal and tumor tissue form easily distinct subclusters in different
                         cancers showing alteration in the expression and methylation profile during transition
                         from normal to tumor samples.

                         3.2. Differential Gene Expression Analysis
                               Differential gene expression (DGE) analysis was performed using the R package,
                         limma [24]. The analysis was performed for 17 TCGA cancers (BLCA, BRCA, CHOL, COAD,
                         ESCA, HNSC, KIRC, KIRP, KICH, LIHC, LUAD, LUSC, PRAD, READ, STAD, THCA, and
                         UCEC) that have ≥10 adjacent normal samples. Trimmed mean of M-values (TMM)
                         normalization was performed to consider the library size variations among samples [32].
                         The kinase genes were considered differentially expressed at a false discovery rate (FDR)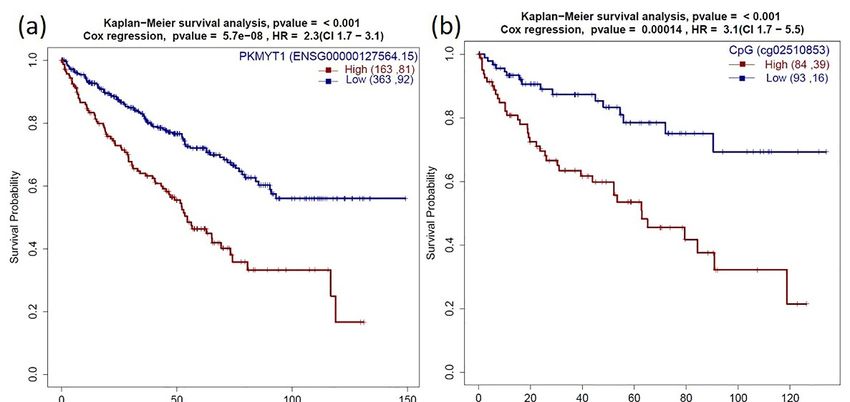
rs 2021, 13, Cancers
1189 2021, 13, 1189 7 of 17 7 of 17
Figure 2. Distribution
Figure 2. of the differentially
Distribution expressed genes.
of the differentially (a) Sunburst
expressed genes.plot
(a) showing
Sunburstthe top
plot DE kinase
showing thegenes in ≥ 4 TCGA
top DE
cancer types.kinase genes inare
Dark kinases ≥ 4highlighted
TCGA cancer types. Dark
in maroon kinases are
(b) Number highlighted in
of Upregulated maroon
(red) (b) Number of (blue) kinase
and downregulated
Upregulated
genes observed in analyzed(red) and downregulated
cancers. (c) Table showing(blue) kinase
the list genes observed
of common DE genes inobtained
analyzedincancers. (c) Table
≥ 10 cancers, the direction
showing the list of common DE genes obtained in ≥ 10 cancers, the direction (upregulated—red,
(upregulated—red, downregulated—blue) and in number of cancers observed. Dark kinases are marked with * symbol.
downregulated—blue) and in number of cancers observed. Dark kinases are marked with * sym-
bol. 3.3. Differential Methylation Analysis
CpG Probes with mean β value difference of at least 0.2 (∆β ≥ 0.2) at BH adjusted
3.3. Differentialp-value
Methylation
< 0.05Analysis
between tumor and adjacent normal samples were considered differentially
CpG Probes with mean
methylated β value
in this study.difference of methylation
Differential at least 0.2 (Δβ
(DM)≥ 0.2) at BHwas
analysis adjusted p- for 15 can-
performed
value < 0.05 between
cers (BLCA,tumor and CHOL,
BRCA, adjacentCOAD,
normalESCA,
samples were
HNSC, considered
KIRC, differentially
KIRP, LIHC, LUAD, LUSC, PAAD,
methylated inPRAD,
this study.
THCA, Differential
UCEC), which had ≥10
methylation (DM) analysis
adjacent wassamples
normal performed withformethylation
15 data
cancers (BLCA, BRCA, CHOL, COAD, ESCA, HNSC, KIRC, KIRP, LIHC, LUAD, LUSC,
available.
PAAD, PRAD, THCA, The distribution
UCEC), which of the
hadhyper and hypomethylated
≥10 adjacent normal samples probeswith obtained within 1.5 Kb from
methylation
data available.the transcription start site (TSS) and the corresponding average gene expression profiles
were plotted
The distribution using
of the hyperthe box
and plot for the analyzed
hypomethylated cancers
probes (Figurewithin
obtained 3a). A significant
1.5 Kb difference
in the methylation
from the transcription leveland
start site (TSS) between the hyper andaverage
the corresponding hypomethylated probespro-
gene expression was observed in
certain
files were plotted cancers,
using including
the box BLCA,
plot for CHOL, COAD,
the analyzed cancersESCA,
(FigureHNSC,
3a). A KIRC, KIRP, LIHC, LUAD,
significant
PRAD,
difference in the THCA, and
methylation levelUCEC.
betweenLowerthe average
hyper andexpression of the hypermethylated
hypomethylated probes was probes in
multiple cancers, including significant difference in
observed in certain cancers, including BLCA, CHOL, COAD, ESCA, HNSC, KIRC, KIRP, CHOL, COAD, LUAD, PAAD and
UCEC as compared to the average expression levels
LIHC, LUAD, PRAD, THCA, and UCEC. Lower average expression of the hypermethyl- of the hypomethylated probes, was
ated probes inobserved. However,
multiple cancers, consistent
including inverse correlation
significant difference inwas
CHOL,not reflected in some cancers. An
COAD, LUAD,
PAAD and UCEC overview of the distribution
as compared of differentially
to the average expressionmethylated
levels of (DM) probes is shown in Figure 3b.
the hypomethylated
Overall, more
probes, was observed. hypermethylated
However, CpG probes
consistent inverse were found
correlation was not in reflected
PRAD (89%),
in someKIRP (77%), and
BRCA (75%), and more hypomethylated probes were
cancers. An overview of the distribution of differentially methylated (DM) probes is observed in LIHC (74.5%), BLCA
(72.8%), and THCA (70.2%) cohorts.
shown in Figure 3b. Overall, more hypermethylated CpG probes were found in PRAD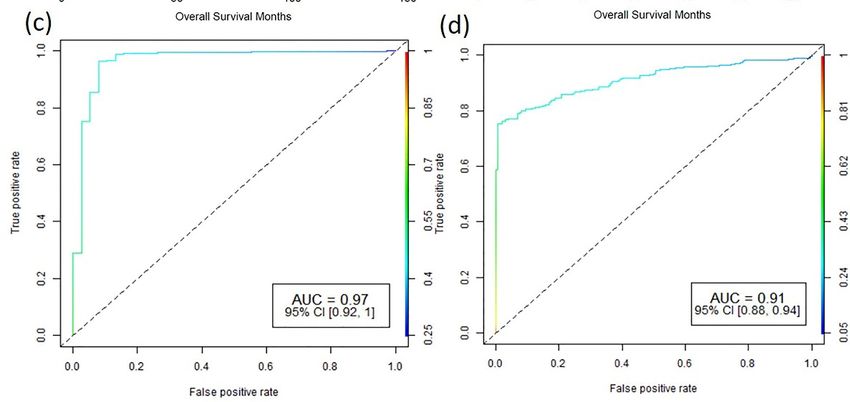
Cancers 2021, 13, 1189                                                                                                                         8 of 17

Cancers 2021, 13, 1189                                                                                                                           8 of 17
                                     (89%), KIRP (77%), and BRCA (75%), and more hypomethylated probes were observed in
                                     LIHC (74.5%), BLCA (72.8%), and THCA (70.2%) cohorts.

      Figure 3. Distribution of DM CpGs across cancers. (a) Box      Box plots showing distribution of hyper (Red) and hypomethylated
      (blue) probes    and  the corresponding     average   gene   expression
      (blue) probes and the corresponding average gene expression (light         (light red
                                                                                        red and
                                                                                             and light
                                                                                                  light blue)
                                                                                                        blue) in
                                                                                                              in different
                                                                                                                  different cancers.
                                                                                                                            cancers. The    gene
                                                                                                                                      The gene
      expression   values  were   normalized   between    0 and  1. T-test was   used  to show  the  significance level between
      expression values were normalized between 0 and 1. T-test was used to show the significance level between the methylation   the  methyla-
      tion levels
      levels      of the
             of the       hyper
                      hyper  andand    hypo
                                    hypo     methylated
                                          methylated       probes
                                                         probes  andandbetween
                                                                         betweenthe thecorresponding
                                                                                        corresponding gene
                                                                                                         gene expression
                                                                                                              expression level
                                                                                                                           level(ns:
                                                                                                                                 (ns:p p> 0.05, *:
                                                                                                                                          > 0.05,
      p
Cancers 2021, 13, 1189 9 of 17
2021, 13, 1189 9 of 17
DM probes
common DM probes observed
observed in ≥ 10 ≥ 10 cancers
in cancers are listed
are listed in Figure
in Figure 3c. The
3c. The complete
complete list of DM probes
list of
obtained is given in Supplementary Table
DM probes obtained is given in Supplementary Table S3. S3.
3.4. Correlative Analysis of DNA Methylation and Gene Expression
3.4. Correlative Analysis of DNA Methylation and Gene Expression
We used methylation expression Quantitative Trait Loci (meQTL), a correlative analy-
We used methylation expression Quantitative Trait Loci (meQTL), a correlative anal-
sis, to measure DNA methylation’s influence on gene expression. Pan-cancer analysis of
ysis, to measuremethylation
DNA methylation’s influence
levels of CpG sites on gene100
within expression. Pan-cancer gene’s
kb of corresponding analysis of was calculated
TSS
methylation levels of CpG sites within 100 kb of corresponding gene’s TSS was calculated
by linear regression model using eMap1 function in R tool eMAP V-1.2. The association was
by linear regression modelsignificant
considered using eMap1 function in
at Bonferroni R tool eMAP
corrected p-valueV-1.2. The
< 0.05. In association
the case of ovarian cancer,
was consideredno significant at Bonferroni corrected p-value < 0.05. In the
association was found to be significant at this cut-off. However, case of ovarian
180 probe-gene pairs
cancer, no association was found to be significant at this cut-off.
were found to be significant at a raw p-value < 0.01. However, 180 probe-gene
pairs were found to Kinase
be significant at a raw p-value
gene expression can be 30% of analyzed
in red and
cancers are plotted. positive correlations are shown in blue. Genes with significant correlation values ob-
tained in > 30% of analyzed cancers are plotted.
An overview of the top 50 dark kinase genes showing a significant correlation among
An overviewgeneof expression
the top 50 dark
andkinase
DNA genes showing
methylation a significant
across cancerscorrelation
is plotted among
in Figure 4b. The ex-
gene expressionpression
and DNA methylation
of dark acrosswas
kinase genes cancers
alsoisfound
plotted
to in
beFigure 4b. The expres-
most negatively correlated with the
sion of dark kinase genes was
methylation in also
the found to beregion.
promoter most negatively
Among the correlated with the meth-
most significant correlations ranked
by Bonferroni
ylation in the promoter region.corrected
Among the p-value,
most the CpG probes,
significant cg16124934
correlations ranked(RPS6KL1),
by Bon- cg03345668
(MKNK1),
ferroni corrected cg02133234
p-value, the CpG probes,(NRBP2), cg04755561
cg16124934 (PKMYT1),
(RPS6KL1), cg06532379
cg03345668 (ALPK3), cg27153759
(MKNK1),
(STK32B),
cg02133234 (NRBP2), cg13487666
cg04755561 (NEK6) were
(PKMYT1), most frequently
cg06532379 occurring. The
(ALPK3), cg27153759 cancers BRCA, STAD,
(STK32B),
BLCA,
cg13487666 (NEK6) HNSC,
were mostand UCEC, showed
frequently highly
occurring. Thesignificant negative
cancers BRCA, correlations
STAD, BLCA, for most of the
HNSC, and UCEC, dark showed
kinases,highly
as shown in the bubble
significant plot
negative (Figure 4b).
correlations forThe listofofthe
most significant
dark association
within +/ − 1500 from TSS region from the meQTL analysis is
kinases, as shown in the bubble plot (Figure 4b). The list of significant association within given in Supplementary
+/−1500 from TSSTable S4. from the meQTL analysis is given in Supplementary Table S4.
region
3.5. Survival Analysis1189 10 of 17
Cancers 2021, 13, 1189 10 of 17
Survival analysis was performed using Cox-regression analysis and log-rank test by
dividing the patients into high and low expression groups based on the median in each
cancer. Several of the commonly upregulated dark kinases (Figure 2) were also significant
in survival with a 3.5. Survival
p-value Analysis
< 0.05. Among these, the genes PKMYT1, PNCK, BRSK2, ERN2,
Survival analysis
and STK31 were significant in survival wasinperformed
five or more using Cox-regression
cancers (Figureanalysis
5b). and log-rank test by
dividing the patients into high and low expression groups based on the median in each
Higher expression of PKMYT1 resulted in lower overall survival in ACC, BLCA,
cancer. Several of the commonly upregulated dark kinases (Figure 2) were also significant
KICH, KIRC, KIRP, LGG, and
in survival withLUAD,
a p-valueand theAmong
< 0.05. reverse trend
these, was observed
the genes in STAD
PKMYT1, PNCK, co- ERN2,
BRSK2,
horts. In KIRC patients,
and STK31 survival analysisinof
were significant corresponding
survival in five or morepromoter methylation
cancers (Figure 5b). also
identified hypermethylation of CpG probe,
Higher expression of PKMYT1cg02510853
resultedsignificant in lower
in lower overall overall
survival sur- BLCA,
in ACC,
KICH,inKIRC,
vival (p-value < 0.001) KIRCKIRP, LGG,(Figures
patients and LUAD, and the
5a and reverse
Figure trend was observed
6). Association studiesinus-STAD co-
ing meQTL analysis showed a positive correlation between PKMYT1 gene expression and also
horts. In KIRC patients, survival analysis of corresponding promoter methylation
identified hypermethylation of CpG probe, cg02510853 significant in lower overall survival
methylation level of cg02510853 probe (b1 value: 1.374, Adjusted p-value: 0.007), which is
(p-value < 0.001) in KIRC patients (Figures 5a and 6). Association studies using meQTL
also reflected in the KM plots.
analysis showed AUC of 0.97
a positive and 0.91between
correlation of the PKMYT1
PKMYT1 gene expression
expressionand
andmeth-
methylation
ylation of cg02510853,
level ofrespectively,
cg02510853 probesuggests its 1.374,
(b1 value: use as a potential
Adjusted p-value:diagnostic marker
0.007), which is also in
reflected
KIRC patients. in the KM plots. AUC of 0.97 and 0.91 of the PKMYT1 expression and methylation of
cg02510853,
Another commonly respectively,
upregulated suggests
dark kinaseits use
gene,as awhose
potential diagnosticlevels
expression markerwere
in KIRCalsopatients.
Another commonly upregulated dark kinase gene, whose
significant in overall survival is the PNCK gene. Higher expression of PNCK gene resulted expression levels were also
significant in overall survival is the PNCK gene. Higher expression of PNCK gene resulted
in lower overall survival in ACC, GBM, KIRC, KIRP, LIHC, THYM, UCEC, UCS cancer
in lower overall survival in ACC, GBM, KIRC, KIRP, LIHC, THYM, UCEC, UCS cancer
types (Figure 5b). types
However,
(Figureno corresponding
5b). probes for the
However, no corresponding same
probes forgene were
the same found
gene wereto be to be
found
significant for thesignificant
cut-offs used incut-offs
for the our analysis.
used in our analysis.
Figure 5. Dark5.kinase
Figure Darkgenes and
kinase methylation
genes in survival (a)inList
and methylation of dark (a)
survival kinases
List whose expression,
of dark kinases and methylation
whose of CpG
expression,
probes
and methylation of CpG probes found to be significant in survival (p-value < 0.05) in various can-DGE
found to be significant in survival (p-value < 0.05) in various cancers. (b) Top upregulated dark kinases from
analysis
cers.whose high upregulated
(b) Top and low expression
darkgroups
kinasesalso haveDGE
from a significant difference
analysis in the and
whose high overall
low survival (p-value
expression < 0.05) in
groups
several cancers.
also have a significant difference in the overall survival (p-value < 0.05) in several cancers.
We also investigated the role of several commonly downregulated dark kinases in
We also investigated the role
patient survival. ofofseveral
One commonly
them included downregulated
the STK32A gene whichdark kinases
was found in down-
to be
patient survival. One of them included the STK32A gene which was found to be down-
regulated in 10 cancers. In STAD, the overexpression of STK32A gene (p = 0.001) and the
regulated in 10 cancers. In STAD,ofthe
hypomethylation theoverexpression
corresponding CpG of STK32A gene (p =(p0.001)
probes cg09088988 and
= 0.013) wasthe
found to
be significant in lower overall survival, suggesting its use as
hypomethylation of the corresponding CpG probes cg09088988 (p = 0.013) was found toa prognostic and diagnostic
marker in STAD patients. However, the ROC plots do not indicate its robust use as a
be significant in lower overall survival, suggesting its use as a prognostic and diagnostic
diagnostic methylation marker (Supplementary Figure S3). The expression of STK32A was
marker in STAD patients. However, the ROC plots do not indicate its robust use as a di-
significantly associated with survival in ACC, CESC, LUAD, and PCPG cohorts.
agnostic methylation marker (Supplementary Figure S3). The expression of STK32A was
significantly associated with survival in ACC, CESC, LUAD, and PCPG cohorts.
Similarly, overexpression of MAPK4 and hypermethylation of cg19448837 was found
to be significant (p < 0.005) in lower overall survival in STAD patients (Supplementary
Figure S4). We also found high and low expression groups of MAPK4 have a significantCancers 2021, 13, 1189 11 of 17
Similarly, overexpression of MAPK4 and hypermethylation of cg19448837 was found
2021, 13, 1189 11 of 17
to be significant (p < 0.005) in lower overall survival in STAD patients (Supplementary
Figure S4). We also found high and low expression groups of MAPK4 have a significant dif-
ference in the overall survival with a p-value < 0.05 in LUAD, LUSC, PAAD, THCA, UCEC,
UCEC, and UVMand UVMpatients. Multiple
patients. MAPK4
Multiple MAPK4 CpGCpGprobes, namely
probes, cg05492442
namely and
cg05492442 and cg20068620,
cg20068620, were
weresignificant
significantinin
LGG patients
LGG (Figure
patients 5a).
(Figure 5a).
Figure
Figure 6. Role 6. Role of PKMYT1
of PKMYT1 in prognosis
in prognosis and diagnosis
and diagnosis (a,b) Survival
(a,b) Survival plots of plots
PKMYT1of PKMYT1
high vs.high
lowvs. lowexpression
gene
and promotergene expression
DNA and promoter
methylation DNA methylation
sites (cg02510853) which aresites (cg02510853)
associated which
with KIRC are associated
patient with p-value for KM
survival with
KIRC
plot (log-rank patient
test) survival
and Cox with p-value
proportional formodel.
hazard KM plot (log-rank
(c,d) test) andROC
Corresponding Cox proportional hazard
plot of gene expression and promoter
model. (c,d) Corresponding ROC plot of gene expression and promoter methylation for the gener-
methylation for the generalized linear model.
alized linear model.
Both expression and methylation, high vs. low groups, were significant for several
Both expression and methylation,
dark kinases, high vs.Cytoskeletal
notably Obscurin, low groups,Calmodulin
were significant for several
And Titin-Interacting RhoGEF
dark kinases, notably Obscurin, Cytoskeletal Calmodulin And Titin-Interacting RhoGEF
(OBSCN), Serine/Threonine Kinase 3 (STK3) and MAPK4 kinases, which are displayed
(OBSCN), Serine/Threonine Kinase
in Figure 5a. We 3 (STK3)
found andprobes
five CpG MAPK4 kinases,towhich
mapped OBSCN aregene
displayed in
significant in survival
Figure 5a. We infound five CpG probes mapped to OBSCN gene significant in
KIRP, UCEC and UVM cancers. OBSCN gene has been reported to interact survival in with many
KIRP, UCEC and UVM cancers. genes
cancer-associated OBSCN gene hasinbeen
involved reported
breast to interact
tumorigenesis with
[39]. many
The survival analysis
cancer-associated genes
results involved
based in breastand
on expression tumorigenesis
methylation [39]. The survival
are given analysis re-
in Supplementary Tables S5 and S6
sults based on respectively.
expression and methylation are given in Supplementary Tables S5 and S6
respectively.
4. Discussion
4. Discussion Classification of tumors based on high throughput data has been achieved using
datasets
Classification such asbased
of tumors gene on
expression, CpG island
high throughput methylator
data phenotypeusing
has been achieved (CIMP)
da-status alone, or
by integrating
tasets such as gene expression, it CpG
with other
islandhigh-throughput data types
methylator phenotype using
(CIMP) various
status approaches
alone, or [40–42].
by integrating it with other high-throughput data types using various approaches [40–42].
A similar grouping of cancers has also been achieved using transcription factors’ gene
expression data [43]. Few computational studies have reported tissue-specific expression
of kinases that are not significantly enriched in any central or peripheral tissue types [4].Cancers 2021, 13, 1189 12 of 17
A similar grouping of cancers has also been achieved using transcription factors’ gene
expression data [43]. Few computational studies have reported tissue-specific expression
of kinases that are not significantly enriched in any central or peripheral tissue types [4].
Therefore, we asked if a similar grouping of cancer types can be achieved by an unsuper-
vised method using only the differences in the transcriptional and methylation activity of
the kinome gene set. However, unlike most of these studies that use only one type of omics
data or use the genome-wide gene set, in this study, we demonstrated that organ-system,
tumor, and subtype level classification could be achieved and preserved after the integra-
tion of expression and corresponding promoter methylation data for nearly 8000 tumor
samples across 32 cancer types (Figure 1a–c). The same clustering pattern was observed
in normal tissues (GTEx), which suggests that the kinome expression and methylation
profiles are unique to the tissue type irrespective of the disease condition. As a control
dataset, we wanted to evaluate if the observed grouping of samples based on organ system,
cancer types, or histological subtypes is not an intrinsic property of tumors. Replicating
the unsupervised clustering analysis using 500 randomly selected protein-coding genes
did not yield similar results, indicating that the observed grouping can only be attributed
to the expression and methylation pattern of kinase genes (Supplementary Figure S1c).
A closer look at the t-SNE plots also showed distinct histological tumor subtypes
such as adenocarcinoma and squamous cell neoplasms of lung, esophagus, and cervical
cancer (Figure 1d,e). This is consistent with the results obtained using genome-wide data
by Lin et al. [44], indicating histology-driven differences in expression, methylation, and
pathways and upstream regulators may be consistent across anatomical boundaries and
are also true for the kinome gene set.
To further identify the commonality and differences in kinase genes’ expression and
methylation pattern in various cancers, we performed DGE and DM analysis of kinase
genes and corresponding probes in the promoter region. We further highlighted the
results of relatively poorly understood or dark kinase genes to provide potential starting
points that can be explored as a potential target. To identify the clinical relevance, we also
performed meQTL and survival analyses followed by classification using linear regression
models to identify prognostic and diagnostic relevance.
The DGE analysis showed the genes PKMYT1, and MELK upregulated in 17 and
16 cancers, respectively (Figure 2). MELK is a member of AMPK/Snf1 family of ser-
ine/threonine kinases, and the MELK protein expression is highly specific to proliferating
cancer stem cells [45]. Studies have shown that high expression of this serine/threonine
kinase is associated with poor patient prognosis. MELK disruption is found to inhibit
tumor growth and trigger cell cycle arrest in breast cancer cells [46]. Given the preferential
upregulation of MELK in various cancer types, small molecule inhibitors of MELK have
been developed and are currently in Phase I clinical trials for metastatic breast cancer [47].
From our expression-based survival analysis results, MELK was found to have a significant
role in survival in 10 different cancers, including ACC, KICH, KIRC, KIRP, LGG, LIHC,
MESO, PAAD, THYM, and UVM. MELK inhibitor, OTS167, is reported to suppress tumor
growth in breast, lung, prostate, and pancreatic cancer cell lines [48]. However, due to its
extremely unselective nature, studies have contradicted its use for the clinical validation
of MELK, suggesting that its biological activity may not be attributed to MELK inhibition
alone [9].
PKMYT1, a dark kinase, is a member of Wee family of tyrosine/threonine kinases
and shares high functional similarity with WEE1 [49]. PKMTY1 is a key regulator of
the cell cycle complex and plays an important role in tumor progression [50,51]. The
CpG probe, cg04755561 (mapped to PKMYT1), was found to be significantly negatively
correlated with the gene expression from the meQTL analysis in 13 cancers. However, we
did not find its role in survival in our study. Survival analysis also showed overexpression
of PKMYT1 leads to lower overall survival in ACC, BLCA, KICH, KIRC, KIRP, LGG,
and LUAD cancer types (Figure 5b). Other computational studies have also identified
PKMYT1 as a prognostic marker in kidney cancer cohorts [11]. Besides, we identifiedCancers 2021, 13, 1189 13 of 17
that hypermethylation of the CpG probe, cg02510853 leads to lower overall survival in
KIRC patients (Figures 5a and 6). Interestingly, PKYMT1 is a potentially druggable kinase
that has been implicated in the survival of GBM-like stem cells, indicating that it could be
explored as an actionable target [51,52] in other cancers.
Other less understudied commonly upregulated kinases that were frequently found
to be significant in survival (≥5 cancers) included the BRSK2, ERN2, PNCK, and STK31
kinases (Figure 5b). BRSK2, a member of the AMPK-related family of kinases, has been
shown to negatively regulate nuclear factor erythroid 2-related factor (NRF2) based on
the gain of function kinome screen [53]. It has also been shown to positively correlate
with PDAC metastasis, promoting neoplastic cells’ invasiveness in nutrient-deprived con-
ditions [54]. BRSK2 overexpression can be linked to poor survival in LIHC, KIRC, KIRP,
LGG, THCA and UCEC cancer types (Figure 5b) from our survival analysis. Therefore,
BRSK2 is a promising prognostic marker that can be further explored. PNCK knock-
down has been reported to regulate PI3K/AKT/mTOR signaling pathway and suppress
growth and induce apoptosis of nasopharyngeal carcinoma cells in vitro and in vivo [55].
Co-overexpression of HER-2 and PNCK has also been known to enhanced tumor cell
proliferation and Trastuzumab resistance [56].
ERN2, a serine/threonine kinase, was overexpressed in KIRP, STAD, THCA, and
UCEC and downregulated in PRAD. We identified overexpression of ERN2 and other
kinases including NIMA-related kinase 2 (NEK2), serine/threonine/tyrosine kinase 1
(STYK1), and polo-like kinase 1 (PLK1) in a subset of 146 pancreatic ductal adenocarcinoma
(PDAC) patients after removing endocrine, invasive adenocarcinoma, undifferentiated,
or mixed pancreatic cancers from TCGA-PAAD samples [57]. Overexpression of ERN2
has earlier been reported 60–70% of colorectal samples [58]. Recently, ERN2 was found
differentially expressed in different mediastinal lymph node metastasis (MLNM) in lung
adenocarcinoma [59]. However, our analysis suggests that ERN2 can be explored as a
potential target in multiple cancer types despite limited literature support.
The DM analysis shows significant differences in the kinase methylation levels be-
tween tumors and adjacent normal samples in BLCA, CHOL, COAD, ESCA, HNSC, KIRC,
KIRP, and LIHC LUAD, PRAD, THCA, and UCEC were observed. However, the expected
inverse methylation-expression relationship was not reflected in some cancers when we
plotted the corresponding gene expression values (Figure 3a). This is probably because of
other genetic and epigenetic factors that regulate the expression pattern and might not be
a direct consequence of changes in the DNA methylation status alone. However, further
in-depth correlation analysis showed that the inverse relationship was found to be more
enriched within 1.5 kb from the TSS. The peak indicates a more significant correlation with
a lower p-value in the plot (Figure 4a). Finally, this pan-cancer analysis uncovered the
potential value of many novel kinases, including several dark kinases as novel prognostic
and diagnostic markers owing to their association with survival. The findings of this study
could be coupled with the sequencing of a patient’s genome to enhance cancer detection,
tumor prognosis, and prediction to treatment and response. Hence, this study paves the
way for further investigation and experimental validation of novel kinase targets for their
potential therapeutic use in multiple cancers.
5. Conclusions
Many kinases are associated with cancer initiation and progression. However, only
a small proportion are currently being targeted due to a lack of characterization of their
biochemical and biological functions. Therefore, it is important to prioritize and identify
newer kinase targets. In this study, we showed kinase-based clustering of the tumor
and normal samples based on their organ system and tissue histology, which revealed
commonality and uniqueness of expression and methylation profiles among different
cancer types. We also demonstrate that the gene expression and DNA methylation profiles
of the kinome alone, independently, or combined are sufficient to achieve the above
grouping. While this pan-cancer study reiterated the importance of known kinase targets,Cancers 2021, 13, 1189 14 of 17
we also demonstrated that several novel dark kinases due to their strong association to
survival could serve as prognostic and diagnostic biomarkers across multiple cancers. In
conclusion, our study paved the way for the therapeutic characterization of many poorly
understood dark kinase genes (PKMYT1, PNCK, BRSK2, ERN2, STK31, STK32A, MAPK4)
that need to be investigated further.
Supplementary Materials: The following are available online at https://www.mdpi.com/2072-669
4/13/6/1189/s1, The data presented in this study are available in supplementary material. Figure S1:
t-SNE plots using multi-omics data. Figure S2: t-SNE plots showing distribution of tumor and normal
samples based on expression and methylation data. Figure S3: STK32A as prognostic and diagnostic
marker in STAD. Figure S4: MAPK4 as prognostic and diagnostic marker in STAD. Table S1: List of
kinase and dark kinases included in the study; dark kinases from DKK are highlighted. Table S2:
Differentially expressed kinase genes for cancers analyzed. Table S3: Differentially methylated kinase
probes in promoter region for cancers analyzed. Table S4: List of significant association within +/−
1500 from TSS from meQTL analysis. Table S5: Significant survival associated kinase genes based on
high and low expression groups at p-value < 0.05. Table S6: Significant survival associated kinase
CpG probes based on high and low methylation groups at p-value < 0.05.
Author Contributions: Conceptualization, S.S., N.K.M. and C.G.; methodology, S.S. and N.K.M.;
formal analysis, S.S.; investigation, S.S. and N.K.M.; data curation, S.S.; writing—original draft
preparation, S.S.; writing—review and editing, N.K.M. and C.G.; visualization, S.S., N.K.M. and C.G.;
supervision, N.K.M. and C.G.; project administration, C.G.; funding acquisition, C.G. All authors
have read and agreed to the published version of the manuscript.
Funding: This work has been supported by startup funds to CG from the University of Nebraska
Medical Center; National Institutes of Health grants (P20GM103427, P30CA036727, P01AG029531) to
CG; and Graduate Student Fellowship to SS from UNMC Graduate Studies Office.
Institutional Review Board Statement: Not applicable.
Informed Consent Statement: Not applicable.
Data Availability Statement: Publicly available datasets were analyzed in this study. The TCGA
level-3 data is available at https://portal.gdc.cancer.gov/projects/ (accessed on 1 March 2020). GTEx
data are available at https://www.gtexportal.org/home/datasets (accessed on 1 March 2020).
Acknowledgments: The authors would like to express their gratitude to the Bioinformatics and Sys-
tems Biology Core at UNMC for providing the computational infrastructure, the Holland Computing
Center (HCC) for offering access to supercomputers and Neetha Nanoth Vellichirammal and Chaitra
Rao for proof reading.
Conflicts of Interest: The authors declare no conflict of interest. The funders had no role in the design
of the study; in the collection, analyses, or interpretation of data; in the writing of the manuscript, or
in the decision to publish the results.
References
1. Siegel, R.L.; Miller, K.D.; Jemal, A. Cancer statistics, 2020. CA Cancer J. Clin. 2020, 70, 7–30. [CrossRef] [PubMed]
2. Blume-Jensen, P.; Hunter, T. Oncogenic kinase signalling. Nature 2001, 411, 355–365. [CrossRef]
3. Kilpinen, S.; Ojala, K.; Kallioniemi, O. Analysis of kinase gene expression patterns across 5681 human tissue samples reveals
functional genomic taxonomy of the kinome. PLoS ONE 2010, 5, e15068. [CrossRef] [PubMed]
4. Yang, R.Y.; Quan, J.; Sodaei, R.; Aguet, F.; Segrè, A.V.; Allen, J.A.; Lanz, T.A.; Reinhart, V.; Crawford, M.; Hasson, S.; et al.
A systematic survey of human tissue-specific gene expression and splicing reveals new opportunities for therapeutic target
identification and evaluation. bioRxiv 2018. [CrossRef]
5. Manning, G.; Whyte, D.B.; Martinez, R.; Hunter, T.; Sudarsanam, S. The protein kinase complement of the human genome. Science
2002, 298, 1912–1934. [CrossRef] [PubMed]
6. Wilson, L.J.; Linley, A.; Hammond, D.E.; Hood, F.E.; Coulson, J.M.; MacEwan, D.J.; Ross, S.J.; Slupsky, J.R.; Smith, P.D.; Eyers, P.A.;
et al. New Perspectives, Opportunities, and Challenges in Exploring the Human Protein Kinome. Cancer Res. 2018, 78, 15–29.
[CrossRef]
7. Hantschel, O. Unexpected off-targets and paradoxical pathway activation by kinase inhibitors. ACS Chem. Biol. 2015, 10, 234–245.
[CrossRef] [PubMed]
8. Feng, S.; De Carvalho, D.D. Clinical advances in targeting epigenetics for cancer therapy. FEBS J. 2021. [CrossRef]Cancers 2021, 13, 1189 15 of 17
9. Klaeger, S.; Heinzlmeir, S.; Wilhelm, M.; Polzer, H.; Vick, B.; Koenig, P.A.; Reinecke, M.; Ruprecht, B.; Petzoldt, S.; Meng, C.; et al.
The target landscape of clinical kinase drugs. Science 2017, 358. [CrossRef]
10. Shrestha, S.; Byrne, D.P.; Harris, J.A.; Kannan, N.; Eyers, P.A. Cataloguing the dead: Breathing new life into pseudokinase research.
FEBS J. 2020, 287, 4150–4169. [CrossRef]
11. Essegian, D.; Khurana, R.; Stathias, V.; Schurer, S.C. The Clinical Kinase Index: A Method to Prioritize Understudied Kinases as
Drug Targets for the Treatment of Cancer. Cell Rep. Med. 2020, 1, 100128. [CrossRef] [PubMed]
12. Huang, L.C.; Ross, K.E.; Baffi, T.R.; Drabkin, H.; Kochut, K.J.; Ruan, Z.; D0 Eustachio, P.; McSkimming, D.; Arighi, C.; Chen, C.;
et al. Integrative annotation and knowledge discovery of kinase post-translational modifications and cancer-associated mutations
through federated protein ontologies and resources. Sci. Rep. 2018, 8, 6518. [CrossRef]
13. Finan, C.; Gaulton, A.; Kruger, F.A.; Lumbers, R.T.; Shah, T.; Engmann, J.; Galver, L.; Kelley, R.; Karlsson, A.; Santos, R.; et al. The
druggable genome and support for target identification and validation in drug development. Sci. Transl. Med. 2017, 9. [CrossRef]
14. Berginski, M.E.; Moret, N.; Liu, C.; Goldfarb, D.; Sorger, P.K.; Gomez, S.M. The Dark Kinase Knowledgebase: An online
compendium of knowledge and experimental results of understudied kinases. Nucleic Acids Res. 2020. [CrossRef] [PubMed]
15. Sheetz, J.B.; Mathea, S.; Karvonen, H.; Malhotra, K.; Chatterjee, D.; Niininen, W.; Perttila, R.; Preuss, F.; Suresh, K.; Stayrook, S.E.;
et al. Structural Insights into Pseudokinase Domains of Receptor Tyrosine Kinases. Mol. Cell 2020, 79, 390–405.e7. [CrossRef]
16. Rao, C.; Huisman, D.H.; Vieira, H.M.; Frodyma, D.E.; Neilsen, B.K.; Chakraborty, B.; Hight, S.K.; White, M.A.; Fisher, K.W.; Lewis,
R.E. A Gene Expression High-Throughput Screen (GE-HTS) for Coordinated Detection of Functionally Similar Effectors in Cancer.
Cancers 2020, 12, 3143. [CrossRef]
17. Spainhour, J.C.; Lim, H.S.; Yi, S.V.; Qiu, P. Correlation Patterns Between DNA Methylation and Gene Expression in The Cancer
Genome Atlas. Cancer Inform. 2019, 18. [CrossRef] [PubMed]
18. Kuang, S.Q.; Bai, H.; Fang, Z.H.; Lopez, G.; Yang, H.; Tong, W.; Wang, Z.Z.; Garcia-Manero, G. Aberrant DNA methylation and
epigenetic inactivation of Eph receptor tyrosine kinases and ephrin ligands in acute lymphoblastic leukemia. Blood 2010, 115,
2412–2419. [CrossRef] [PubMed]
19. Mello, A.A.; Leal, M.F.; Rey, J.A.; Pinto, G.R.; Lamarao, L.M.; Montenegro, R.C.; Alves, A.P.; Assumpcao, P.P.; Borges Bdo, N.;
Smith, M.C.; et al. Deregulated Expression of SRC, LYN and CKB Kinases by DNA Methylation and Its Potential Role in Gastric
Cancer Invasiveness and Metastasis. PLoS ONE 2015, 10, e0140492. [CrossRef]
20. Zhang, P.; Wang, J.; Gao, W.; Yuan, B.Z.; Rogers, J.; Reed, E. CHK2 kinase expression is down-regulated due to promoter
methylation in non-small cell lung cancer. Mol. Cancer 2004, 3, 14. [CrossRef]
21. Moret, N.; Liu, C.; Gyori, B.M.; Bachman, J.A.; Steppi, A.; Taujale, R.; Huang, L.-C.; Hug, C.; Berginski, M.; Gomez, S.; et al.
Exploring the understudied human kinome for research and therapeutic opportunities. bioRxiv 2020. [CrossRef]
22. UniProt, C. UniProt: A worldwide hub of protein knowledge. Nucleic Acids Res. 2019, 47, D506–D515. [CrossRef]
23. Colaprico, A.; Silva, T.C.; Olsen, C.; Garofano, L.; Cava, C.; Garolini, D.; Sabedot, T.S.; Malta, T.M.; Pagnotta, S.M.; Castiglioni,
I.; et al. TCGAbiolinks: An R/Bioconductor package for integrative analysis of TCGA data. Nucleic Acids Res. 2016, 44, e71.
[CrossRef] [PubMed]
24. Ritchie, M.E.; Phipson, B.; Wu, D.; Hu, Y.; Law, C.W.; Shi, W.; Smyth, G.K. limma powers differential expression analyses for
RNA-sequencing and microarray studies. Nucleic Acids Res. 2015, 43, e47. [CrossRef] [PubMed]
25. Troyanskaya, O.; Cantor, M.; Sherlock, G.; Brown, P.; Hastie, T.; Tibshirani, R.; Botstein, D.; Altman, R.B. Missing value estimation
methods for DNA microarrays. Bioinformatics 2001, 17, 520–525. [CrossRef]
26. Teschendorff, A.E.; Marabita, F.; Lechner, M.; Bartlett, T.; Tegner, J.; Gomez-Cabrero, D.; Beck, S. A beta-mixture quantile
normalization method for correcting probe design bias in Illumina Infinium 450 k DNA methylation data. Bioinformatics 2013, 29,
189–196. [CrossRef] [PubMed]
27. Morris, T.J.; Butcher, L.M.; Feber, A.; Teschendorff, A.E.; Chakravarthy, A.R.; Wojdacz, T.K.; Beck, S. ChAMP: 450 k Chip Analysis
Methylation Pipeline. Bioinformatics 2014, 30, 428–430. [CrossRef]
28. Zhou, W.; Laird, P.W.; Shen, H. Comprehensive characterization, annotation and innovative use of Infinium DNA methylation
BeadChip probes. Nucleic Acids Res. 2017, 45, e22. [CrossRef]
29. Mishra, N.K.; Niu, M.; Southekal, S.; Bajpai, P.; Elkholy, A.; Manne, U.; Guda, C. Identification of Prognostic Markers in
Cholangiocarcinoma Using Altered DNA Methylation and Gene Expression Profiles. Front. Genet. 2020, 11, 522125. [CrossRef]
30. Sing, T.; Sander, O.; Beerenwinkel, N.; Lengauer, T. ROCR: Visualizing classifier performance in R. Bioinformatics 2005, 21,
3940–3941. [CrossRef] [PubMed]
31. International Cancer Genome Consortium; Hudson, T.J.; Anderson, W.; Artez, A.; Barker, A.D.; Bell, C.; Bernabe, R.R.; Bhan,
M.K.; Calvo, F.; Eerola, I.; et al. International network of cancer genome projects. Nature 2010, 464, 993–998. [CrossRef]
32. Robinson, M.D.; Oshlack, A. A scaling normalization method for differential expression analysis of RNA-seq data. Genome Biol.
2010, 11, R25. [CrossRef] [PubMed]
33. Gray, D.; Jubb, A.M.; Hogue, D.; Dowd, P.; Kljavin, N.; Yi, S.; Bai, W.; Frantz, G.; Zhang, Z.; Koeppen, H.; et al. Maternal
embryonic leucine zipper kinase/murine protein serine-threonine kinase 38 is a promising therapeutic target for multiple cancers.
Cancer Res. 2005, 65, 9751–9761. [CrossRef] [PubMed]You can also read