Assessment of observed changes and responses in natural and managed systems
←
→
Page content transcription
If your browser does not render page correctly, please read the page content below
1
Assessment of observed changes and responses
in natural and managed systems

Coordinating Lead Authors:
Cynthia Rosenzweig (USA), Gino Casassa (Chile)

Lead Authors:
David J. Karoly (USA/Australia), Anton Imeson (The Netherlands), Chunzhen Liu (China), Annette Menzel (Germany),
Samuel Rawlins (Trinidad and Tobago), Terry L. Root (USA), Bernard Seguin (France), Piotr Tryjanowski (Poland)

Contributing Authors:
Tarekegn Abeku (Ethiopia), Isabelle Côté (Canada), Mark Dyurgerov (USA), Martin Edwards (UK), Kristie L. Ebi (USA),
Nicole Estrella (Germany), Donald L. Forbes (Canada), Bernard Francou (France), Andrew Githeko (Kenya), Vivien Gornitz (USA),
Wilfried Haeberli (Switzerland), John Hay (New Zealand), Anne Henshaw (USA), Terrence Hughes (Australia), Ana Iglesias (Spain),
Georg Kaser (Austria), R. Sari Kovats (UK), Joseph Lam (China), Diana Liverman (UK), Dena P. MacMynowski (USA),
Patricia Morellato (Brazil), Jeff T. Price (USA), Robert Muir-Wood (UK), Peter Neofotis (USA), Catherine O’Reilly (USA),
Xavier Rodo (Spain), Tim Sparks (UK), Thomas Spencer (UK), David Viner (UK), Marta Vicarelli (Italy), Ellen Wiegandt (Switzerland),
Qigang Wu (China), Ma Zhuguo (China)

Review Editors:
Lucka Kajfež-Bogataj (Slovenia), Jan Pretel (Czech Republic), Andrew Watkinson (UK)

This chapter should be cited as:
Rosenzweig, C., G. Casassa, D.J. Karoly, A. Imeson, C. Liu, A. Menzel, S. Rawlins, T.L. Root, B. Seguin, P. Tryjanowski, 2007: Assess-
ment of observed changes and responses in natural and managed systems. Climate Change 2007: Impacts, Adaptation and Vulnerability.
Contribution of Working Group II to the Fourth Assessment Report of the Intergovernmental Panel on Climate Change, M.L. Parry,
O.F. Canziani, J.P. Palutikof, P.J. van der Linden and C.E. Hanson, Eds., Cambridge University Press, Cambridge, UK, 79-131.
Assessment of observed changes and responses in natural and managed systems                                                                                            Chapter 1

Table of Contents

     Executive summary .......................................................81                Box 1.2 Wine and recent warming ....................................105

     1.1     Introduction ..........................................................82
                                                                                                1.3.7 Human health .........................................................107
                                                                                                1.3.8 Disasters and hazards............................................109
        1.1.1 Scope and goals of the chapter ...............................82
                                                                                                1.3.9 Socio-economic indicators ....................................111

                                                                                             1.4     Larger-scale aggregation and attribution
        1.1.2 Summary of observed changes in the TAR ..............83

     1.2     Methods of detection and attribution of                                                 to anthropogenic climate change ...................112
             observed changes .................................................83
                                                                                                1.4.1     Larger-scale aggregation ......................................112
        1.2.1 Climate and non-climate drivers of change .............83
                                                                                                1.4.2 Joint attribution ......................................................112
        1.2.2 Methods and confidence .........................................85

     1.3     Observed changes in natural and managed
                                                                                                Box 1.3 Phenological responses to climate in Europe:

             systems related to regional climate changes ...85
                                                                                                       the COST725 project.............................................113

                                                                                             1.5     Learning from observed responses:
                                                                                                     vulnerability, adaptation and research
                                                                                                     needs .....................................................................117
        1.3.1 Cryosphere ...............................................................85

                                                                                             References......................................................................117
        Box 1.1 Retreat of Chacaltaya and its effects: case
               study of a small disappearing glacier in Bolivia ......87
        1.3.2 Hydrology and water resources ...............................90
        1.3.3 Coastal processes and zones ..................................92

                                                                                             Supplementary material for this chapter is available
                                                                                             on the CD-ROM accompanying this report.
        1.3.4 Marine and freshwater biological systems...............94
        1.3.5 Terrestrial biological systems ...................................98
        1.3.6 Agriculture and forestry ..........................................104

80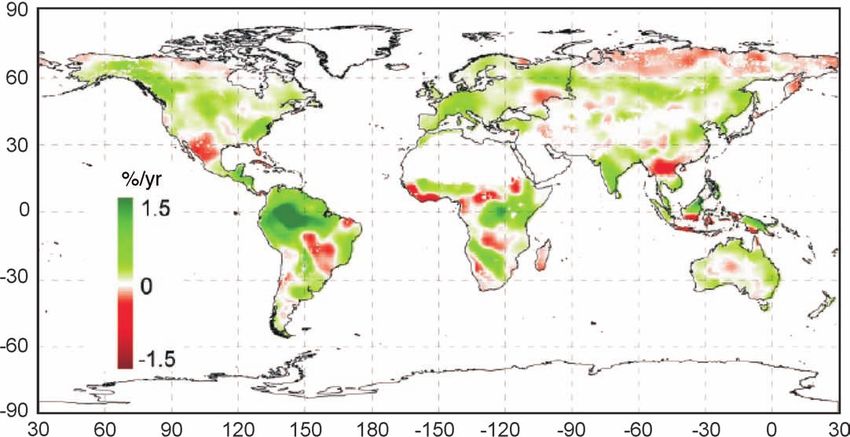
Chapter 1 Assessment of observed changes and responses in natural and managed systems
mangroves, and increased damage from coastal flooding in
many areas, although human modification of coasts, such as
Executive summary
increased construction in vulnerable zones, plays an important
Physical and biological systems on all continents and in role too (medium confidence). [1.3.3.2]
The uptake of anthropogenic carbon since 1750 has led to the
most oceans are already being affected by recent climate
ocean becoming more acidic, with an average decrease in pH of
changes, particularly regional temperature increases (very
0.1 units. However, the effects of recent ocean acidification on
high confidence) [1.3]. Climatic effects on human systems,
the marine biosphere are as yet undocumented. [1.3.4]
although more difficult to discern due to adaptation and
non-climatic drivers, are emerging (medium confidence)
[1.3]. Global-scale assessment of observed changes shows
that it is likely that anthropogenic warming over the last More evidence from a wider range of species and
three decades has had a discernible influence on many communities in terrestrial ecosystems and substantial new
Attribution of observed regional changes in natural and managed
physical and biological systems [1.4]. evidence in marine and freshwater systems show that
systems to anthropogenic climate change is complicated by the
recent warming is strongly affecting natural biological
effects of natural climate variability and non-climate drivers The overwhelming majority of studies of regional climate effects
systems (very high confidence). [1.3.5, 1.3.4]
(e.g., land-use change) [1.2]. Nevertheless, there have been on terrestrial species reveal consistent responses to warming
several joint attribution studies that have linked responses in trends, including poleward and elevational range shifts of flora
some physical and biological systems directly to anthropogenic and fauna. Responses of terrestrial species to warming across
climate change using climate, process and statistical models the Northern Hemisphere are well documented by changes in
[1.4.2]. Furthermore, the consistency of observed significant the timing of growth stages (i.e., phenological changes),
changes in physical and biological systems and observed especially the earlier onset of spring events, migration, and
significant warming across the globe very likely cannot be lengthening of the growing season. Changes in abundance of
explained entirely by natural variability or other confounding certain species, including limited evidence of a few local
non-climate factors [1.4.2]. On the basis of this evidence, disappearances, and changes in community composition over
combined with the likely substantial anthropogenic warming the last few decades have been attributed to climate change (very
over the past 50 years averaged over each continent except high confidence). [1.3.5]
Antarctica (as described in the Working Group I Fourth
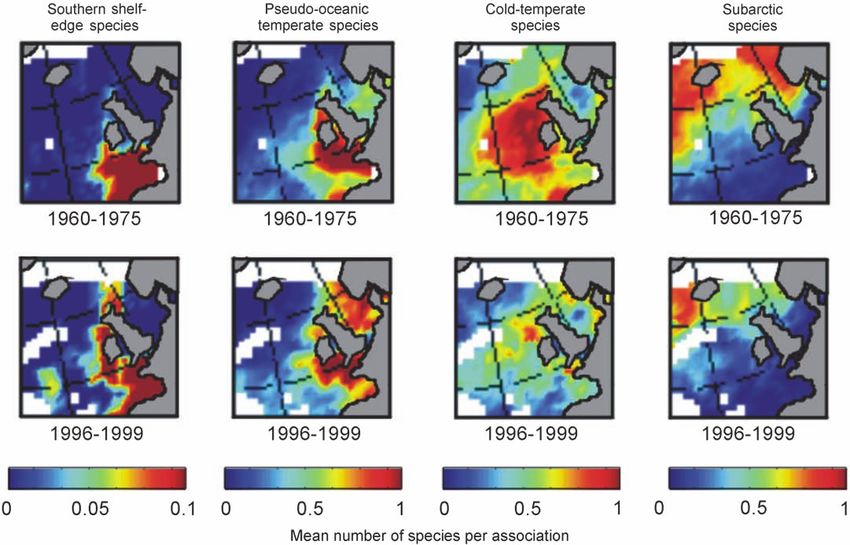
Assessment Summary for Policymakers), it is likely that there is Many observed changes in phenology and distribution of
a discernible influence of anthropogenic warming on many marine species have been associated with rising water
physical and biological systems. temperatures, as well as other climate-driven changes in
salinity, oxygen levels, and circulation. For example, plankton
has moved poleward by 10° latitude over a period of four
decades in the North Atlantic. While there is increasing
Climate change is strongly affecting many aspects of
evidence for climate change impacts on coral reefs, separating
systems related to snow, ice and frozen ground (including
the impacts of climate-related stresses from other stresses (e.g.,
permafrost) [1.3.1]; emerging evidence shows changes in
over-fishing and pollution) is difficult. Warming of lakes and
hydrological systems, water resources [1.3.2], coastal zones
Effects due to changes in snow, ice and frozen ground rivers is affecting abundance and productivity, community
[1.3.3] and oceans (high confidence) [1.3.4].
(including permafrost) include ground instability in permafrost composition, phenology, distribution and migration of
regions, a shorter travel season for vehicles over frozen roads in freshwater species (high confidence). [1.3.4]
the Arctic, enlargement and increase of glacial lakes in
mountain regions and destabilisation of moraines damming
these lakes, changes in Arctic and Antarctic Peninsula flora and
Although responses to recent climate changes in human
fauna including the sea-ice biomes and predators higher in the
systems are difficult to identify due to multiple non-climate
food chain, limitations on mountain sports in lower-elevation
driving forces and the presence of adaptation, effects have
alpine areas, and changes in indigenous livelihoods in the Arctic
been detected in forestry and a few agricultural systems
(high confidence). [1.3.1]
[1.3.6]. Changes in several aspects of the human health
system have been related to recent warming [1.3.7].
The spring peak discharge is occurring earlier in rivers affected
Adaptation to recent warming is beginning to be
by snow melt, and there is evidence for enhanced glacial melt. In comparison with other factors, recent warming has been of
systematically documented (medium confidence) [1.3.9].
Lakes and rivers around the world are warming, with effects on limited consequence in agriculture and forestry. A significant
thermal structure and water quality (high confidence). [1.3.2] advance in phenology, however, has been observed for
agriculture and forestry in large parts of the Northern
The effects of sea-level rise, enhanced wave heights, and Hemisphere, with limited responses in crop management. The
intensification of storms are found in some coastal regions – lengthening of the growing season has contributed to an
including those not modified by humans, e.g., polar areas and observed increase in forest productivity in many regions, while
barrier beaches – mainly through coastal erosion [1.3.3.1]. Sea- warmer and drier conditions are partly responsible for reduced
level rise is contributing to losses of coastal wetlands and forest productivity, increased forest fires and pests in North
81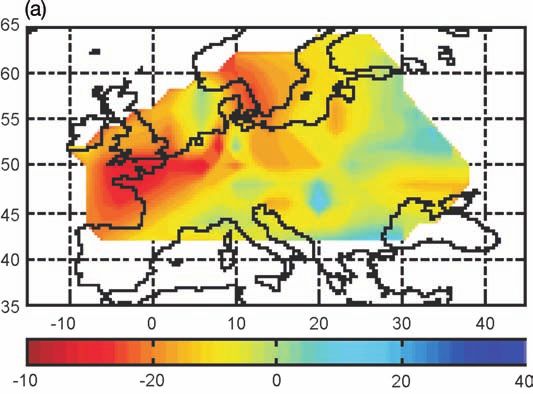
Assessment of observed changes and responses in natural and managed systems                                                        Chapter 1

America and the Mediterranean Basin. Both agriculture and                human health. The chapter assesses whether responses to recent
forestry have shown vulnerability to recent trends in heatwaves,         warming are present in a broad range of systems and across
droughts and floods (medium confidence). [1.3.6]                         varied geographical regions.

While there have been few studies of observed health effects
related to recent warming, an increase in high temperature
                                                                         1.1.1    Scope and goals of the chapter

extremes has been associated with excess mortality in Europe,               The aim of this chapter is to assess studies of observed
which has prompted adaptation measures. There is emerging                changes in natural and managed systems related to recent
evidence of changes in the distribution of some human disease            regional climate change, particularly temperature rise in recent
vectors in parts of Europe. Earlier onset and increases in the           decades, and to assess the aggregate changes in regard to
seasonal production of allergenic pollen have occurred in mid-           potential influence by anthropogenic increase in greenhouse gas
and high latitudes in the Northern Hemisphere (medium                    concentrations. Temperature rise is selected as the major climate
confidence). [1.3.7]                                                     variable because it has a strong and widespread documented
                                                                         signal in recent decades, demonstrates an anthropogenic signal,
Changes in socio-economic activities and modes of human                  and has an important influence on many physical and biological
response to climate change, including warming, are just                  processes. Effects of changes in other climate variables related
beginning to be systematically documented. In regions of snow,           to temperature rise, such as sea-level rise and changes in runoff
ice and frozen ground, responses by indigenous groups relate to          due to earlier snow melt, are also considered.
changes in the migration patterns, health, and range of animals             The chapter first reviews data sources and methods of
and plants on which they depend for their livelihood and cultural        detection of observed changes, investigating the roles of climate
identity. Responses vary by community and are dictated by                (including climate extremes and large-scale natural climate
particular histories, perceptions of change and range, and the           variability systems) and non-climate drivers of change (Section
viability of options available to groups (medium confidence).            1.2). Evidence of no change, i.e., regions with documented
[1.3.9]                                                                  warming trends but with little or no documentation of change in
                                                                         natural and managed systems, is analysed as well.
                                                                            In Section 1.3, evidence is assessed regarding recent observed
                                                                         changes in natural and managed systems related to regional
While there is now significant evidence of observed changes

                                                                         climate changes: cryosphere (snow, ice and frozen ground –
in natural systems in every continent, including Antarctica,

                                                                         including permafrost), hydrology and water resources, coastal
as well as from most oceans, the majority of studies come

                                                                         processes and zones, marine and freshwater biological systems,
from mid- and high latitudes in the Northern Hemisphere.

                                                                         terrestrial biological systems, agriculture and forestry, human
Documentation of observed changes in tropical regions and

                                                                         health, and disasters and hazards. Evidence regarding other
the Southern Hemisphere is sparse. [1.5]

                                                                         socio-economic effects, including energy use and tourism, is also
                                                                         assessed. The term ‘response’ is used to denote processes by
                                                                         which natural and managed systems react to the stimuli of
                                                                         changing climate conditions.
                      1.1 Introduction

   The IPCC Working Group II Third Assessment Report (WGII                  In Section 1.4, studies are surveyed that use techniques of
TAR) found evidence that recent regional climate changes,                larger-scale aggregation (i.e., synthesising studies across
particularly temperature increases, have already affected many           systems and regions), including meta-analyses and studies that
physical and biological systems, and also preliminary evidence           relate observed changes in natural and managed systems to
for effects in human systems (IPCC, 2001a). This chapter                 anthropogenic climate change. From the studies assessed in
focuses on studies since the TAR that analyse significant                individual systems in Section 1.3, a subset is selected that fits
changes in physical, biological and human systems related to             criteria in regard to length of study and statistically significant
observed regional climate change. The studies are assessed with          changes in a system related to recent changes in temperature or
regard to current functional understanding of responses to               related climate variables, in order to assess the potential
climate change and to factors that may confound such                     influence of anthropogenic climate forcing on observed changes
relationships, such as land-use change, urbanisation and                 in natural and managed systems.
pollution. The chapter considers larger-scale aggregation of                We consider what observed changes are contributing to the
observed changes (across systems and geographical regions) and           study of adaptation and vulnerability (where there are relevant
whether the observed changes may be related to anthropogenic             studies), and address data needs in Section 1.5. There is a notable
climate forcing. Cases where there is evidence of climate change         lack of geographical balance in the data and literature on
without evidence of accompanying changes in natural and                  observed changes in natural and managed systems, with a
managed systems are evaluated for insight into time-lag effects,         marked scarcity in many regions. The Supplementary Material1
resilience and vulnerability. Managed systems are defined as             (SM) contains additional literature citations and explanatory data
systems with substantial human inputs, such as agriculture and           relevant to the chapter.

1
    Contained on the CD-ROM which accompanies this volume.
82
Chapter 1                                                       Assessment of observed changes and responses in natural and managed systems

1.1.2       Summary of observed changes in the Third                    1.2 Methods of detection and attribution
            Assessment Report                                               of observed changes
   The Working Group I (WGI) TAR described an increasing
body of observations that gave a collective picture of a warming         In the TAR (Mitchell et al., 2001), detection of climate
world and other changes in the climate system (IPCC, 2001b).         change is the process of demonstrating that an observed change
The WGII TAR documented methods of detecting observed                is significantly different (in a statistical sense) from what can be
changes in natural and managed systems, characterised the            explained by natural variability. The detection of a change,
processes involved, and summarised the studies across multiple       however, does not necessarily imply that its causes are
systems (see Sections 2.2, 5.2.1 and 19.1) (IPCC, 2001a). In the     understood. Similarly, attribution of climate change to
TAR, about 60 studies considered about 500 data series in            anthropogenic causes involves statistical analysis and the
physical or biological systems.                                      assessment of multiple lines of evidence to demonstrate, within
                                                                     a pre-specified margin of error, that the observed changes are
Changes in physical systems:                                         (1) unlikely to be due entirely to natural internal climate
 • Sea ice: Arctic sea-ice extent had declined by about 10 to        variability; (2) consistent with estimated or modelled responses
   15% since the 1950s. No significant trends in Antarctic sea-      to the given combination of anthropogenic and natural forcing;
   ice extent were apparent.                                         and (3) not consistent with alternative, physically plausible
 • Glaciers and permafrost: mountain glaciers were receding          explanations of recent climate change.
   on all continents, and Northern Hemisphere permafrost was             Extending detection and attribution analysis to observed
   thawing.                                                          changes in natural and managed systems is more complex.
 • Snow cover: extent of snow cover in the Northern                  Detection and attribution of observed changes and responses in
   Hemisphere had decreased by about 10% since the late              systems to anthropogenic forcing is usually a two-stage process
   1960s and 1970s.                                                  (IPCC, 2003). First, the observed changes in a system must be
 • Snow melt and runoff: snowmelt and runoff had occurred            demonstrated to be associated with an observed regional climate
   increasingly earlier in Europe and western North America          change within a specified degree of confidence. Second, a
   since the late 1940s.                                             measurable portion of the observed regional climate change, or
 • Lake and river ice: annual duration of lake- and river-ice        the associated observed change in the system, must be attributed
   cover in Northern Hemisphere mid- and high latitudes had          to anthropogenic causes with a similar degree of confidence.
   been reduced by about 2 weeks and become more variable.               Joint attribution involves both attribution of observed changes
                                                                     to regional climate change and attribution of a measurable
Changes in biological systems:                                       proportion of either regional climate change or the associated
 • Range: plant and animal ranges had shifted poleward and           observed changes in the system to anthropogenic causes, beyond
   higher in elevation.                                              natural variability. This process involves statistically linking
 • Abundance: within the ranges of some plants and animals,          climate change simulations from climate models with the
   population sizes had changed, increasing in some areas and        observed responses in the natural or managed system. Confidence
   declining in others.                                              in joint attribution statements must be lower than the confidence
 • Phenology: timing of many life-cycle events, such as              in either of the individual attribution steps alone, due to the
   blooming, migration and insect emergence, had shifted             combination of two separate statistical assessments.
   earlier in the spring and often later in the autumn.
 • Differential change: species changed at different speeds and
   in different directions, causing a decoupling of species
                                                                     1.2.1     Climate and non-climate drivers of change

   interactions (e.g., predator-prey relationships).                    Both climate and non-climate drivers affect systems, making
                                                                     analysis of the role of climate in observed changes challenging.
Preliminary evidence for changes in human systems:                   Non-climate drivers such as urbanisation and pollution can
 • Damages due to droughts and floods: changes in some socio-        influence systems directly and indirectly through their effects
   economic systems had been related to persistent low rainfall      on climate variables such as albedo and soil-moisture regimes.
   in the Sahelian region of Africa and to increased precipitation   Socio-economic processes, including land-use change (e.g.,
   extremes in North America. Most of the increase in damages        forestry to agriculture; agriculture to urban area) and land-cover
   is due to increased wealth and exposure. However, part of         modification (e.g., ecosystem degradation or restoration) also
   the increase in losses was attributed to climate change, in       affect multiple systems.
   particular to more frequent and intense extreme weather
   events in some regions.                                           1.2.1.1 Climate drivers of change
                                                                        Climate is a key factor determining different characteristics
                                                                     and distributions of natural and managed systems, including the
                                                                     cryosphere, hydrology and water resources, marine and
                                                                     freshwater biological systems, terrestrial biological systems,
                                                                     agriculture and forestry. For example, temperature is known to
                                                                     strongly influence the distribution and abundance patterns of
                                                                                                                                        83
Assessment of observed changes and responses in natural and managed systems                                                                   Chapter 1

both plants and animals, due to the physiological constraints of               may be needed in order to separate the response to climate
each species (Parmesan and Yohe, 2003; Thomas et al., 2004).                   oscillations from that due to longer-term climate change.
Dramatic changes in the distribution of plants and animals
during the ice ages illustrate how climate influences the                      1.2.1.2 Non-climate drivers of change
distribution of species. Equivalent effects can be observed in                    Non-climate drivers, such as land use, land degradation,
other systems, such as the cryosphere. Hence, changes in                       urbanisation and pollution, affect systems directly and indirectly
temperature due to climate change are expected to be one of the                through their effects on climate (Table 1.1). These drivers can
important drivers of change in natural and managed systems.                    operate either independently or in association with one another
   Many aspects of climate influence various characteristics and               (Lepers et al., 2004). Complex feedbacks and interactions occur
distributions of physical and biological systems, including                    on all scales from local to global.
temperature and precipitation, and their variability on all time-                 The socio-economic processes that drive land-use change
scales from days to the seasonal cycle to interannual variations.              include population growth, economic development, trade and
While changes in many different aspects of climate may at least                migration; these processes can be observed and measured at
partially drive changes in the systems, we focus on the role of                global, regional and local scales (Goklany, 1996). Satellite
temperature changes. This is because physical and biological                   observations demonstrate that land-use change, including that
responses to changing temperatures are often better understood                 associated with the current rapid economic development in Asia
than responses to other climate parameters, and the                            and Latin America, is proceeding at an unprecedented rate
anthropogenic signal is easier to detect for temperature than for              (Rindfuss et al., 2004). Besides influencing albedo and
other parameters. Precipitation has much larger spatial and                    evaporation, land-use changes hamper range-shift responses of
temporal variability than temperature, and it is therefore more                species to climate change, leading to an extra loss of biodiversity
difficult to identify the impact it has on changes in many                     (Opdam and Wascher, 2004). Additionally, land-use changes
systems. Mean temperature (including daily maximum and                         have been linked to changes in air quality and pollution that
minimum temperature) and the seasonal cycle in temperature                     affect the greenhouse process itself (Pielke et al., 2002; Kalnay
over relatively large spatial areas show the clearest signals of               and Cai, 2003). Land-use and land-cover change can also
change in the observed climate (IPCC, 2001b).                                  strongly magnify the effects of extreme climate events, e.g., heat
   Large-scale climate variations, such as the Pacific Decadal                 mortality, injuries/fatalities from storms, and ecologically
Oscillation (PDO), El Niño-Southern Oscillation (ENSO) and                     mediated infectious diseases (Patz et al., 2005). Intensification
North Atlantic Oscillation (NAO), are occurring at the same time               of land use, as well as the extent of land-use change, is also
as the global climate is changing. Consequently, many natural                  affecting the functioning of ecosystems, and hence emissions of
and managed systems are being affected by both climate change                  greenhouse gases from soils, such as CO2 and methane.
and climate variability. Hence, studies of observed changes in                    There are also a large number of socio-economic factors that
regions influenced by an oscillation may be able to attribute                  can influence, obscure or enhance the observed impacts of
these changes to regional climate variations, but decades of data              climate change and that must be taken into account when

Table 1.1. Direct and indirect effects of non-climate drivers.

Non-climate driver Examples                                 Direct effects on systems                     Indirect effects on climate
Geological             Volcanic activity, earthquakes,      Lava flow, mudflows (lahars), ash fall,       Cooling from stratospheric aerosols,
processes              tsunamis (e.g., Adams et al.,        shock waves, coastal erosion, enhanced        change in albedo
                       2003)                                surface and basal melting of glaciers,
                                                            rockfall and ice avalanches
Land-use change        Conversion of forest to              Declines in wildlife habitat, biodiversity    Change in albedo, lower evapotranspiration,
                       agriculture (e.g., Lepers et al.,    loss, increased soil erosion, nitrification   altered water and heat balances (e.g.,
                       2004)                                                                              Bennett and Adams, 2004)
                       Urbanisation and transportation      Ecosystem fragmentation, deterioration of Change in albedo, urban heat island, local
                       (e.g., Kalnay and Cai, 2003)         air quality, increased runoff and water   precipitation reduction, downwind
                                                            pollution (e.g., Turalioglu et al., 2005) precipitation increase, lower evaporation
                                                                                                      (e.g., Weissflog et al., 2004)
                       Afforestation (e.g., Rudel et al.,   Restoration or establishment of tree cover Change in albedo, altered water and energy
                       2005)                                (e.g., Gao et al., 2002)                   balances, potential carbon sequestration
Land-cover             Ecosystem degradation                Reduction in ecosystem services,              Changes in microclimate (e.g., Su et al.,
modification           (desertification)                    reduction in biomass, biodiversity loss       2004)
                                                            (e.g., Nyssen et al., 2004)
Invasive species       Tamarisk (USA), Alaska lupin         Reduction of biodiversity, salinisation (e.g., Change in water balance (e.g., Ladenburger
                       (Iceland)                            Lee et al., 2006)                              et al., 2006)
Pollution              Tropospheric ozone, toxic waste,     Reduction in breeding success and             Direct and indirect aerosol effects on
                       oil spills, exhaust, pesticides      biodiversity, species mortality, health       temperature, albedo and precipitation
                       increased soot emissions (e.g.,      impairment, enhanced melting of snow
                       Pagliosa and Barbosa, 2006)          and ice (e.g., Lee et al., 2006)

84
Chapter 1 Assessment of observed changes and responses in natural and managed systems
seeking a climate signal or explaining observations of impacts significant change is found and less likely to be successful when
and even adaptations. For example, the noted effects of sea-level no changes are found, with the result that the ‘no change’ cases
rise and extreme events are much greater when they occur in are underrepresented in the published literature. However, in
regions with large populations, inadequate infrastructure, or high contrast to single-species in single-location studies, multiple
property prices (Pielke et al., 2003). The observed impacts of species in a single location and single or multiple species in
climate change on agriculture are largely determined by the larger-scale studies are less likely to focus only on species
ability of producers to access or afford irrigation, alternate crop showing change. The latter studies often include sub-regions
varieties, markets, insurance, fertilisers and agricultural with no-change; for example, no change in the number of frost
extension, or to abandon agriculture for alternate livelihoods days in the south-eastern USA (Feng and Hu, 2004), little or no
(Eakin, 2000). Demography (e.g., the elderly and the very change in spring onset in continental eastern Europe (Ahas et
young), poverty (e.g., malnutrition and poor living conditions), al., 2002; Schleip et al., 2006), or sub-groups of species with no
preventive technologies (e.g., pest control and immunisation), change (Butler, 2003; Strode, 2003).
and healthcare institutions influence the impacts of climate An accurate percentage of sites exhibiting ‘no change’ can be
change on humans. assessed reliably by large-scale network studies (see, e.g.,
Section 1.4.1; Menzel et al., 2006b) for the locations defined by
the network. For investigations of a suite of processes or species
at numerous locations, the reported ratio of how many species
1.2.2 Methods and confidence
Where long data series exist, the detection of trends or are changing over the total number of species rests on the
changes in system properties that are beyond natural variability assumptions that all species in the defined area have been
has most commonly been made with regression, correlation and examined and that species showing no change do not have a
time-series analyses. When data exist from two (or more) higher likelihood of being overlooked. Both multi-species
discontinuous time periods, two-sample tests have frequently network data and studies on groups of species may be used to
been employed. Testing is also done for abrupt changes and investigate the resilience of systems and possible time-lag
discontinuities in a data series. Regression and correlation effects. These are important processes in the analysis of evidence
methods are frequently used in the detection of a relationship of of no change.
the observed trend with climate variables. Methods also involve
studies of process-level understanding of the observed change in
relation to a given regional climate change, and the examination
of alternative explanations of the observed change, such as land-
1.3 Observed changes in natural and
use change. The analysis sometimes involves comparisons of
managed systems related to
observations to climate-driven model simulations.
In many biological field studies, species within an area are
regional climate changes
not fully surveyed, nor is species selection typically based on The following sections assess studies that have been published
systematic or random sampling. The selection of species is since the TAR of observed changes and their effects related to the
typically based on a determination of which species might cryosphere, hydrology and water resources, coastal processes and
provide information (e.g., on change with warming) in order to zones, freshwater and marine biological systems, terrestrial
answer a particular question. The study areas, however, are often biological systems, agriculture and forestry, human health, and
chosen at random from a particular suite of locations defined by disasters and hazards related to regional warming. More detailed
the presence of the species being studied. This type of species descriptions of these effects are provided in subsequent chapters
selection does not provide a well-balanced means for analysing of the WGII Fourth Assessment Report (AR4).
species showing no change. Exceptions are studies that rely on In some cases, studies published before the TAR have been
network data, meaning that species information is collected included, either because they were not cited in the TAR or
continuously on a large number of species over decades from because they have been considered to contain relevant
the same areas; for example, change in spring green-up2 of a information. The sections describe regional climate and non-
number of plants recorded in phenological botanical gardens climate driving forces for the systems, assess the evidence
across a continent (Menzel and Fabian, 1999). Analysis of regarding observed changes in key processes, and highlight
change and no-change within network data provides a check on issues regarding the absence of observed changes and conflicting
the accuracy of the use of the indicator for global warming and evidence. An assessment of how the observed changes
the ability to check for ‘false positives’, i.e., changes observed contribute to understanding of adaptation and vulnerability is
where no significant temperature change is measured. The latter found in Sections 1.3.9 and 1.5.
can help to elucidate the role of non-climate drivers in the
observed changes.
The analysis of evidence of no change is also related to the
1.3.1 Cryosphere
question of publication or assessment bias. Studies are more The cryosphere reacts sensitively to present and past climate
likely to be successfully submitted and published when a changes. The main components of the cryosphere are mountain
2
Spring green-up is a measure of the transition from winter dormancy to active spring growth.
85Assessment of observed changes and responses in natural and managed systems Chapter 1
glaciers and ice caps, floating ice shelves and continental ice robust evidence that it is, in general, a response to reduction of
sheets, seasonal snow cover on land, frozen ground, sea ice and snow and ice masses due to enhanced warming.
lake and river ice. In Chapter 4 of WGI, the changes in the
cryosphere since the TAR are described in detail, including the Mountain glaciers and ice caps, ice sheets and ice shelves
description of climate and non-climate forcing factors and Effects of changes in mountain glaciers and ice caps have been
mechanisms (Lemke et al., 2007). Chapter 6 of WGI describes documented in runoff, changing hazard conditions (Haeberli and
glacier changes in the geological past, including Holocene Burn, 2002) and ocean freshening (Bindoff et al., 2007). There is
glacier variability (Jansen et al., 2007, Box 6.3). Here we also emerging evidence of present crustal uplift in response to
describe the observed effects on the environment and on human recent glacier melting in Alaska (Larsen et al., 2005). The
activities due to these recent cryospheric changes. enhanced melting of glaciers leads at first to increased river runoff
There is abundant evidence that the vast majority of the and discharge peaks and an increased melt season (Boon et al.,
cryospheric components are undergoing generalised shrinkage in 2003; Hock, 2005; Hock et al., 2005; Juen et al., 2007), while in
response to warming, with a few cases of growth which have the longer time-frame (decadal to century scale), glacier wasting
been mainly linked to increased snowfall. The observed should be amplified by positive feedback mechanisms and glacier
recession of glaciers (Box 1.1) during the last century is larger runoff is expected to decrease (Jansson et al., 2003). Evidence for
than at any time over at least the last 5,000 years, is outside of increased runoff in recent decades due to enhanced glacier melt
the range of normal climate variability, and is probably induced has already been detected in the tropical Andes and in the Alps. As
by anthropogenic warming (Jansen et al., 2007). In the Arctic glaciers disappear, the records preserved in the firn3 and ice layers
and the Antarctic, ice shelves several thousand years old have are destroyed and disappear due to percolation of melt water and
started to collapse due to warming (Lemke et al., 2007). In many mixing of chemical species and stable isotopes (Table 1.2).
cases the cryospheric shrinkage shows an increased trend in The formation of large lakes is occurring as glaciers retreat
recent decades, consistent with the enhanced observed warming. from prominent Little Ice Age (LIA) moraines in several steep
Cryospheric changes are described by Lemke et al. (2007), mountain ranges, including the Himalayas (Yamada, 1998; Mool
including the contribution of the cryosphere to sea-level rise. et al., 2001; Richardsonand Reynolds, 2000), the Andes (Ames
Sea-level rise is treated in Section 1.3.3, in the regional chapters et al., 1989; Kaser and Osmaston, 2002) and the Alps (Haeberli
of WGII, and in WGI, Chapters 4 and 5 (Bindoff et al., 2007; et al., 2001; Huggel et al., 2004; Kaab et al., 2005) (Table 1.2).
Lemke et al., 2007). Thawing of buried ice also threatens to destabilise the LIA
moraines (e.g., Kaser and Osmaston, 2002). These lakes thus
1.3.1.1 Observed effects due to changes in the cryosphere have a high potential for glacial lake outburst floods (GLOFs).
Effects of changes in the cryosphere have been documented Governmental institutions in the respective countries have
in relation to virtually all of the cryospheric components, with undertaken extensive safety work, and several of the lakes are
Table 1.2. Selected observed effects due to changes in the cryosphere produced by warming.
Environmental factor Observed changes Time period Location Selected references
Glacial lake size Increase from 0.23 km2 to 1.65 km2 1957-1997 Lake Tsho Rolpa, Nepal Agrawala et al., 2005
Himalayas
Glacial lake outburst floods Frequency increase from 0.38 events/year 1934-1998 Himalayas of Nepal, Bhutan Richardson and
(GLOFs) in 1950s to 0.54 events/year in 1990s and Tibet Reynolds, 2000
Obliteration of firn/ice core Percolation, loss of palaeoclimate record 1976-2000 Quelccaya ice cap, Peru Thompson et al.,
record 2003
Reduction in mountain ice Loss of ice climbs 1900-2000 Andes, Alps, Africa Schwörer, 1997;
Bowen, 2002
Travel days of vehicles for oil Decrease from 220 to 130 days 1971-2003 Alaskan tundra ACIA, 2005
exploration on frozen roads
Decreased snow in ski areas Decrease in number of ski areas from 1975-2002 New Hampshire, north- Hamilton, 2003b
at low altitudes 58 to 17 eastern USA
50% (15%) decrease in snow depth at an 1975-1999 Swiss Alps Laternser and
elevation of 440 m (2,220 m) Schneebeli, 2003
50% decrease of 1 Dec–30 April snow 1960-2005 Massifs de Chartreuse, Col Francou and Vincent,
depth at 1,320 m elevation de Porte, French Pre-Alps, 2006
Increase in elevation of starting point of ski 1950-1987 Central Andes, Chile Casassa et al., 2003
lifts from 1,400 to 2,935 m
Increased rockfall after the Active layer deepening from 30% to 100% June-August Swiss Alps Noetzli et al., 2003;
2003 summer heatwave of the depth measured before the heatwave 2003 Gruber et al., 2004;
Schär et al., 2004
3
Firn: ice that is at an intermediate stage between snow and glacial ice.
86Chapter 1 Assessment of observed changes and responses in natural and managed systems
Box 1.1. Retreat of Chacaltaya and its effects:
case study of a small disappearing glacier in Bolivia
The observed general glacier retreat in the warming tropical Andes has increased significantly in recent decades (Francou et al.,
2005). Small-sized glaciers are particularly vulnerable in warmer climates, with many of them having already disappeared in
several parts of the world during the last century. The Chacaltaya Glacier in Bolivia (16°S) is a typical example of a disappearing
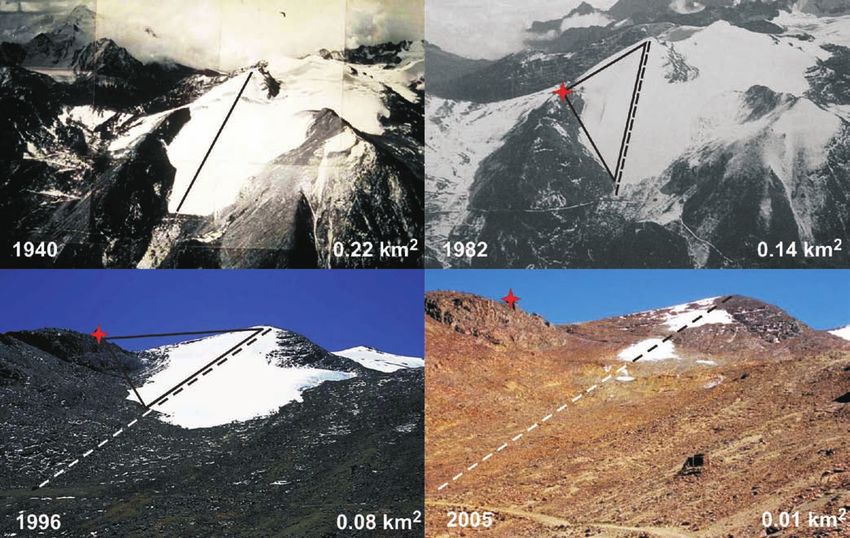
small glacier, whose area in 1940 was 0.22 km2, and which has currently reduced (in 2005) to less than 0.01 km2 (Figure 1.1)
(Ramirez et al., 2001; Francou et al., 2003; Berger et al., 2005), with current estimates showing that it may disappear completely
before 2010. In the period 1992 to 2005, the glacier suffered a loss of 90% of its surface area, and 97% of its volume of ice (Berger
et al., 2005). Although, in the tropics, glacier mass balance responds sensitively to changes in precipitation and humidity (see
Lemke et al., 2007, Section 4.5.3), the fast glacier shrinkage of Chacaltaya is consistent with an ascent of the 0°C isotherm of
about 50 m/decade in the tropical Andes since the 1980s (Vuille et al., 2003), resulting in a corresponding rise in the equilibrium
line of glaciers in the region (Coudrain et al., 2005).
Ice melt from Chacaltaya Glacier, located in Choqueyapu Basin, provides part of the water resources for the nearby city of La Paz,
allowing the release of water stored as ice throughout the long, dry winter season (April-September). Many basins in the tropical
Andes have experienced an increase in runoff in recent decades, while precipitation has remained almost constant or has shown a
tendency to decrease (Coudrain et al., 2005). This short-term increase in runoff is interpreted as the consequence of glacier retreat,
but in the long term there will be a reduction in water supply as the glaciers shrink beyond a critical limit (Jansson et al., 2003).
Chacaltaya Glacier, with a mean altitude of 5,260 m above sea level, was the highest skiing station in the world until a very few
years ago. After the accelerated shrinkage of the glacier during the 1990s, enhanced by the warm 1997/98 El Niño, Bolivia lost
its only ski area (Figure 1.1), directly affecting the development of snow sports and recreation in this part of the Andes, where
glaciers are an important part of the cultural heritage.
Figure 1.1. Areal extent of Chacaltaya Glacier, Bolivia, from 1940 to 2005. By 2005, the glacier had separated into three distinct small bodies.
The position of the ski hut, which did not exist in 1940, is indicated with a red cross. The ski lift, which had a length of about 800 m in 1940
and about 600 m in 1996, was normally installed during the summer months (precipitation season in the tropics) and covered a major portion
of the glacier, as indicated with a continuous line. The original location of the ski lift in 1940 is indicated with a segmented line in subsequent
epochs. After 2004, skiing was no longer possible. Photo credits: Francou and Vincent (2006) and Jordan (1991).
87Assessment of observed changes and responses in natural and managed systems Chapter 1
now either solidly dammed or drained, but continued vigilance The observed permafrost warming and degradation, together
is needed since many tens of potentially dangerous glacial lakes with an increasing depth of the active layer, should result in
still exist in the Himalayas (Yamada, 1998) and the Andes mechanical weakening of the ground, and ground subsidence
(Ames, 1998), together with several more in other mountain and formation of thermokarst will have a weakening effect on
ranges of the world. The temporary increase in glacier melt can existing infrastructure such as buildings, roads, airfields and
also produce enhanced GLOFs, as has been reported in Chile pipelines (Couture et al., 2000; Nelson, 2003), but there is no
(Peña and Escobar, 1985), although these have not been linked solid evidence for this yet. There is evidence for a decrease in
with any long-term climate trends. potential travel days of vehicles over frozen roads in Alaska
Enhanced colonisation of plants and animals in deglaciated (Table 1.2). Permafrost melting has produced increased coastal
terrain is a direct effect of glacier and snow retreat (e.g., Jones erosion in the Arctic (e.g., Beaulieu and Allard, 2003); this is
and Henry, 2003). Although changes due to other causes such detailed in Section 1.3.3.
as introduction by human activities, increased UV radiation, Thawing and deepening of the active layer in high-mountain
contaminants and habitat loss might be important (e.g., Frenot et areas can produce slope instability and rock falls (Watson and
al., 2005), ‘greening’ has been reported in relation to warming in Haeberli, 2004), which in turn can trigger outburst floods
the Arctic and also in the Antarctic Peninsula. Tundra areas in the (Casassa and Marangunic, 1993; Carey, 2005), but there is no
northern circumpolar high latitudes derived from a 22-year evidence for trends. A reported case linked to warming is the
satellite record show greening trends, while forest areas show exceptional rock-fall activity in the Alps during the 2003
declines in photosynthetic activity (Bunn and Goetz, 2006). Ice- summer heatwave (Table 1.2).
water microbial habitats have contracted in the Canadian High
Arctic (Vincent et al., 2001). Sea ice
Glacier retreat causes striking changes in the landscape, which Nutritional stresses related to longer ice-free seasons in the
has affected living conditions and local tourism in many mountain Beaufort Sea may be inducing declining survival rates, smaller
regions around the world (Watson and Haeberli, 2004; Mölg et size, and cannibalism among polar bears (Amstrup et al., 2006;
al., 2005). Warming produces an enhanced spring-summer Regehr et al., 2006). Polar bears are entirely dependent on sea
melting of glaciers, particularly in areas of ablation, with a ice as a platform to access the marine mammals that provide
corresponding loss of seasonal snow cover that results in an their nutritional needs (Amstrup, 2003). Reduced sea ice in the
increased exposure of surface crevasses, which can in turn affect, Arctic will probably result in increased navigation, partial
for example, snow runway operations, as has been reported in the evidence of which has already been found (Eagles, 2004), and
Antarctic Peninsula (Rivera et al., 2005). The retreat, enhanced possibly also a rise in offshore oil operations, with positive
flow and collapse of glaciers, ice streams and ice shelves can lead effects such as enhanced trade, and negative ones such as
to increased production of iceberg calving, which can in turn affect increased pollution (Chapter 15; ACIA, 2005), but there are no
sea navigation, although no evidence for this exists as yet. quantitative data to support this.
Increased navigability in the Arctic should also raise issues of
Snow cover water sovereignty versus international access for shipping
Spring peak river flows have been occurring 1-2 weeks earlier through the North-west and North-east Passages. Previously
during the last 65 years in North America and northern Eurasia. uncharted islands and seamounts have been discovered due to a
There is also evidence for an increase in winter base flow in reduction in sea ice cover (Mohr and Forsberg, 2002), which can
northern Eurasia and North America. These changes in river be relevant for territorial and ocean claims.
runoff are described in detail in Section 1.3.2 and Table 1.3.
There is also a measured trend towards less snow at low Ocean freshening, circulation and ecosystems
altitudes, which is affecting skiing areas (Table 1.2). There is evidence for freshening in the North Atlantic and in
the Ross Sea, which is probably linked to glacier melt (Bindoff
Frozen ground et al., 2007). There is no significant evidence of changes in the
Degradation of seasonally frozen ground and permafrost, and Meridional Overturning Circulation at high latitudes in the
an increase in active-layer thickness, should result in an North Atlantic Ocean or in the Southern Ocean, although
increased importance of surface water (McNamara et al., 1999), important changes in interannual to decadal scales have been
with an initial but temporary phase of lake expansion due to observed in the North Atlantic (Bindoff et al., 2007). Ocean
melting, followed by their disappearance due to draining within ecosystem impacts such as a reduction of krill biomass and an
the permafrost, as has been detected in Alaska (Yoshikawa and increase in salps in Antarctica, decline of marine algae in the
Hinzman, 2003) and in Siberia (Smith et al., 2005). Arctic due to their replacement by freshwater species, and
Permafrost and frozen ground degradation are resulting in an impacts on Arctic mammals, are described in Section 1.3.4.2.
increased areal extent of wetlands in the Arctic, with an
associated ‘greening’, i.e., plant colonisation (see above). Lake and river ice
Wetland changes also affect the fauna. Permafrost degradation Seasonal and multi-annual variations in lake and river ice are
and wetland increase might produce an increased release of relevant in terms of freshwater hydrology and for human
carbon in the form of methane to the atmosphere in the future activities such as winter transportation, bridge and pipeline
(e.g., Lawrence and Slater, 2005; Zimov et al., 2006), but this crossings, but no quantitative evidence of observed effects exists
has not been documented. yet. Shortening of the freezing period of lake and river ice by an
88Chapter 1 Assessment of observed changes and responses in natural and managed systems
Table 1.3. Observed changes in runoff/streamflow, lake levels and floods/droughts.
Environmental Observed changes Time period Location Selected references
factor
Runoff/ Annual increase of 5%, winter 1935-1999 Arctic Drainage Basin: Lammers et al., 2001; Serreze et al., 2002;
streamflow increase of 25 to 90%, increase in Ob, Lena, Yenisey, Yang et al., 2002
winter base flow due to increased Mackenzie
melt and thawing permafrost
1 to 2 week earlier peak streamflow 1936-2000 Western North Cayan et al., 2001; Beltaos, 2002; Stone et al.,
due to earlier warming-driven snow America, New England, 2002; Yang et al., 2002; Hodgkins et al., 2003;
melt Canada, northern Ye and Ellison, 2003; Dery and Wood, 2005;
Eurasia McCabe and Clark, 2005; Regonda et al., 2005
Runoff 23% increase in glacial melt 2001-4 vs. 1998-9 Yanamarey Glacier Mark et al., 2005
increase in catchment
glacial basins 143% increase 1953-1997 Llanganuco catchment Pouyaud et al., 2005
in Cordillera
Blanca, Peru 169% increase 2000-2004 Artesonraju catchment Pouyaud et al., 2005
Floods Increasing catastrophic floods of Last years Russian Arctic rivers Smith, 2000; Buzin et al., 2004; Frolov et al.,
frequency (0.5 to 1%) due to earlier 2005
break-up of river-ice and heavy rain
Droughts 29% decrease in annual maximum 1847-1996 Southern Canada Zhang et al., 2001
daily streamflow due to temperature
rise and increased evaporation with
no change in precipitation
Due to dry and unusually warm 1998-2004 Western USA Andreadis et al., 2005; Pagano and Garen,
summers related to warming of 2005
western tropical Pacific and Indian
Oceans in recent years
Water 0.1 to 1.5°C increase in lakes 40 years Europe, North America, Livingstone and Dokulil, 2001; Ozaki et al.,
temperature Asia (100 stations) 2003; Arhonditsis et al., 2004; Dabrowski et
al., 2004; Hari et al., 2006
0.2 to 0.7°C increase (deep water) in 100 years East Africa (6 stations) Hecky et al., 1994; O’Reilly et al., 2003; Lorke
lakes et al., 2004; Vollmer et al., 2005
Water Decreased nutrients from increased 100 years North America, Europe, Hambright et al., 1994; Adrian et al., 1995;
chemistry stratification or longer growing Eastern Europe, East Straile et al., 2003; Shimaraev and
period in lakes and rivers Africa (8 stations) Domysheva, 2004; O’Reilly, 2007
Increased catchment weathering or 10-20 years North America, Europe Bodaly et al., 1993; Sommaruga-Wograth et al.,
internal processing in lakes and (88 stations) 1997; Rogora et al., 2003; Vesely et al., 2003;
rivers. Worrall et al., 2003; Karst-Riddoch et al., 2005
average of 12 days during the last 150 years (Lemke et al., 2007) that their effects in the environment and in human activities are
results in a corresponding reduction in skating activities in the already detectable. This agrees with the results presented in
Northern Hemisphere. In Europe there is some evidence for a Chapter 9 of WGI (Hegerl et al., 2007), which concludes that
reduction in ice-jam floods due to reduced freshwater freezing the observed reductions in Arctic sea ice extent, decreasing trend
during the last century (Svensson et al., 2006). Enhanced melt in global snow cover, and widespread retreat and melting of
conditions could also result in significant ice jamming due to glaciers are inconsistent with simulated internal variability, and
increased break-up events, which can, in turn, result in severe consistent with the simulated response to anthropogenic gases.
flooding (Prowse and Beltaos, 2002), although there is a lack of The observed effects of cryosphere reduction include
scientific evidence that this is already happening. modification of river regimes due to enhanced glacial melt,
Changes in lake thermal structure and quality/quantity of snowmelt advance and enhanced winter base flow; formation of
under-ice habitation in lakes have been reported, as well as thermokarst terrain and disappearance of surface lakes in
changes in suspended particles and chemical composition (see thawing permafrost; decrease in potential travel days of vehicles
Section 1.3.2). Earlier ice-out dates can have relevant effects on over frozen roads in the Arctic; enhanced potential for glacier
lake and river ecology, while changes in river-ice dynamics may hazards and slope instability due to mechanical weakening
also have ecological effects (see Section 1.3.4). driven by ice and permafrost melting; regional ocean freshening;
sea-level rise due to glacier and ice sheet shrinkage; biotic
1.3.1.2 Summary of cryosphere colonisation and faunal changes in deglaciated terrain; changes
There is abundant and significant evidence that most of the in freshwater and marine ecosystems affected by lake-ice and
cryospheric components in polar regions and in mountains are sea-ice reduction; changes in livelihoods; reduced tourism
undergoing generalised shrinkage in response to warming, and activities related to skiing, ice climbing and scenic activities in
89Assessment of observed changes and responses in natural and managed systems Chapter 1
cryospheric areas affected by degradation; and increased ease water demand, resulting in consequences for water availability
of ship transportation in the Arctic. (see Chapter 3). See Table SM1.1a for additional changes in
runoff/streamflow.
Groundwater
1.3.2 Hydrology and water resources
This section focuses on the relationship of runoff, lake levels, Groundwater in shallow aquifers is part of the hydrological
groundwater, floods and droughts, and water quality, with cycle and is affected by climate variability and change through
observed climate variability, climate trends, and land-use and recharge processes (Chen et al., 2002), as well as by human
land-cover changes reported since the TAR. The time period interventions in many locations (Petheram et al., 2001). In the
under consideration is primarily 1975 to 2005, with many Upper Carbonate Aquifer near Winnipeg, Canada, shallow well
studies extending to earlier decades. Observed changes in hydrographs show no obvious trends, but exhibit variations of 3
precipitation and aspects of surface hydrology are described in to 4 years correlated with changes in annual temperature and
more detail by Trenberth et al. (2007), Section 3.3. precipitation (Ferguson and George, 2003).
1.3.2.1 Changes in surface and groundwater systems Lakes
Since the TAR there have been many studies related to trends At present, no globally consistent trend in lake levels has been
in river flows during the 20th century at scales ranging from found. While some lake levels have risen in Mongolia and China
catchment to global. Some of these studies have detected (Xinjiang) in response to increased snow and ice melt, other lake
significant trends in some indicators of river flow, and some levels in China (Qinghai), Australia, Africa (Zimbabwe, Zambia
have demonstrated statistically significant links with trends in and Malawi), North America (North Dakota) and Europe
temperature or precipitation; but no globally homogeneous trend (central Italy) have declined due to the combined effects of
has been reported. Many studies, however, have found no trends, drought, warming and human activities. Within permafrost areas
or have been unable to separate the effects of variations in in the Arctic, recent warming has resulted in the temporary
temperature and precipitation from the effects of human formation of lakes due to the onset of melting, which then drain
interventions in the catchment, such as land-use change and rapidly due to permafrost degradation (e.g., Smith et al., 2005).
reservoir construction. Variation in river flows from year to year A similar effect has been reported for a lake formed over an
is also very strongly influenced in some regions by large-scale Arctic ice shelf (i.e., an epishelf lake), which disappeared when
atmospheric circulation patterns associated with ENSO, NAO the ice shelf collapsed (Mueller et al., 2003). Permafrost and
and other variability systems that operate at within-decadal and epishelf lakes are treated in detail by Le Treut et al. (2007).
multi-decadal time-scales. Observed trends in lake levels are listed in Table SM1.1b.
At the global scale, there is evidence of a broadly coherent
pattern of change in annual runoff, with some regions 1.3.2.2 Floods and droughts
experiencing an increase at higher latitudes and a decrease in Documented trends in floods show no evidence for a globally
parts of West Africa, southern Europe and southern Latin widespread change. Although Milly et al. (2002) identified an
America (Milly et al., 2005). Labat et al. (2004) claimed a 4% apparent increase in the frequency of ‘large’ floods (return
increase in global total runoff per 1°C rise in temperature during period >100 years) across much of the globe from the analysis
the 20th century, with regional variation around this trend, but of data from large river basins, subsequent studies have provided
this has been challenged (Legates et al., 2005) due to the effects less widespread evidence. Kundzewicz et al. (2005) found
of non-climatic drivers on runoff and bias due to the small increases (in 27 cases) and decreases (in 31 cases) and no trend
number of data points. Gedney et al., (2006) gave the first in the remaining 137 cases of the 195 catchments examined
tentative evidence that CO2 forcing leads to increases in runoff worldwide. Table 1.3 shows results of selected changes in
due to the ecophysiological controls of CO2, although other runoff/streamflow, lake levels and floods/droughts. Other
evidence for such a relationship is difficult to find. The examples of changes in floods and droughts may be found in
methodology used to search for trends can also influence results, Table SM1.2.
since omitting the effects of cross-correlation between river Globally, very dry areas (Palmer Drought Severity Index,
catchments can lead to an overestimation of the number of PDSI ≤ −3.0) have more than doubled since the 1970s due to a
catchments showing significant trends (Douglas et al., 2000). combination of ENSO events and surface warming, while very
Runoff studies that show no trends are listed in the Chapter 1 wet areas (PDSI ≥ +3.0) declined by about 5%, with
Supplementary Material (SM). precipitation as the major contributing factor during the early
1980s and temperature more important thereafter (Dai et al.,
Runoff in snow basins 2004). The areas of increasing wetness include the Northern
There is abundant evidence for an earlier occurrence of spring Hemisphere high latitudes and equatorial regions. However, the
peak river flows and an increase in winter base flow in basins use of PDSI is limited by its lack of effectiveness in tropical
with important seasonal snow cover in North America and regions. Table 1.3 shows the trend in droughts in some regions.
northern Eurasia, in agreement with local and regional climate Documented trends in severe droughts and heavy rains
warming in these areas (Table 1.3). The early spring shift in (Trenberth et al., 2007, Section 3.8.2) show that hydrological
runoff leads to a shift in peak river runoff away from summer conditions are becoming more intense in some regions,
and autumn, which are normally the seasons with the highest consistent with other findings (Huntington, 2006).
90You can also read