ATP Excites Interneurons and Astrocytes to Increase Synaptic Inhibition in Neuronal Networks
←
→
Page content transcription
If your browser does not render page correctly, please read the page content below
8606 • The Journal of Neuroscience, September 29, 2004 • 24(39):8606 – 8620

Cellular/Molecular

ATP Excites Interneurons and Astrocytes to Increase
Synaptic Inhibition in Neuronal Networks
David N. Bowser and Baljit S. Khakh
Medical Research Council Laboratory of Molecular Biology, Cambridge CB2 2QH, United Kingdom

We investigated the role of extracellular ATP at astrocytes and inhibitory GABAergic interneurons in the stratum radiatum area of the
mouse hippocampus. We show that exogenously applied ATP increased astrocyte intracellular Ca 2⫹ levels and depolarized all calbindin-
and calretinin-positive interneurons in the stratum radiatum region of mouse hippocampus, leading to action potential firing and
enhanced synaptic inhibition onto the postsynaptic targets of interneurons. Electrophysiological, pharmacological, and immunostaining
studies suggested that the effect of ATP on interneurons was mediated by P2Y1 receptors, and that the depolarization of interneurons was
caused by the concomitant reduction and activation of potassium and nonselective cationic conductances, respectively. Electrical stim-
ulation of the Schaffer collaterals and perforant path, as well as local stimulation within the stratum radiatum, evoked increases in
intracellular Ca 2⫹ in astrocytes. Facilitation of GABAergic IPSCs onto interneurons also occurred during electrical stimulation. Both the
stimulation-evoked increases in astrocyte Ca 2⫹ levels and facilitation of GABAergic IPSCs were sensitive to antagonists of P2Y1 receptors
and mimicked by exogenous P2Y1 receptor agonists, suggesting that endogenously released ATP can activate P2Y receptors on both
astrocytes and interneurons. Overall, our data are consistent with the hypothesis that ATP released from neurons and astrocytes acts on
P2Y1 receptors to excite interneurons, resulting in increased synaptic inhibition within intact hippocampal circuits.
Key words: purinergic; interneuron; astrocyte; inhibition; IPSP; hippocampus; P2Y; P2X

Introduction                                                                                                           don, 2001). In this report, we present evidence to suggest that
Increasing evidence suggests that astrocytes actively participate in                                                   endogenously released ATP can affect the function of nearby as-
synaptic and neuronal function as well as fulfill their classical                                                      trocytes and interneurons within the stratum radiatum (s.r.) and
supportive roles in the brain (Fields and Stevens, 2000; Haydon,                                                       stratum lacunosum-moleculare (s.l-m.) regions of the mouse
2001; Fields and Stevens-Graham, 2002; Newman, 2003a). Astro-                                                          hippocampus.
cytes release gliotransmitters into the extracellular space that may                                                       A role for extracellular ATP as a signaling molecule in the
then activate receptors on nearby neurons (Araque et al., 2001).                                                       nervous system was first proposed over 30 years ago (Burnstock,
ATP functions as an extracellular signaling molecule (Zimmer-                                                          1972). Extracellular ATP acts on two families of receptors, P2X
mann, 1994; Burnstock, 2004), and recent work suggests that                                                            and P2Y receptors. P2X receptors are ATP-gated nonselective
ATP is also a gliotransmitter. Once released from a point source,                                                      cation channels that are found throughout the body (Khakh,
ATP may trigger a wave of astrocyte excitation that can travel                                                         2001), whereas P2Y receptors are seven transmembrane domain
hundreds of micrometers (Guthrie et al., 1999; Haydon, 2001;                                                           receptors that couple to G-proteins (Lazarowski et al., 2003) and
Newman, 2001a,b, 2003a). Recently, glial ATP has been shown to                                                         in some cases directly to channels (O’Grady et al., 1996; Lee et al.,
decrease the excitability of neurons in the retina (Newman,                                                            2003). P2Y receptors comprise a family of at least eight members;
2003b) and mediate presynaptic modulation in cultured hip-                                                             they couple to Gq and Gi proteins and thus activate phospho-
pocampal neurons (Koizumi et al., 2003; Zhang et al., 2003). An                                                        lipase C and inhibit adenylyl cyclase (Lazarowski et al., 2003). In
important unresolved issue, however, is whether endogenously                                                           relation to other transmitter receptor families, the functions of
released glial ATP actually regulates the excitability of brain neu-                                                   P2Y and P2X receptors in the brain are not well understood, and
rons in networks with functionally preserved connectivity (Hay-                                                        one important goal is to decipher how ATP affects brain neurons
                                                                                                                       through the interplay of P2X and P2Y receptor signaling.
                                                                                                                           Inhibitory GABAergic interneurons have small range projec-
Received March 30, 2004; revised Aug. 17, 2004; accepted Aug. 18, 2004.                                                tions within the hippocampus and constitute a diverse group of
   This work was supported by the Medical Research Council (UK), European Molecular Biology Organization (EMBO)
                                                                                                                       neurons (McBain and Fisahn, 2001). S.r. interneurons in the CA1
Young Investigator Program, Human Frontier Science Program, and an EMBO Long Term Fellowship to D.N.B. We are
indebted to Drs. Elizabeth Maywood and Michael Hastings for advice on immunostaining and for use of the cryostat.      region of the hippocampus receive inhibitory innervations from
We thank Drs. Stephen Williams and Terrance Egan for comments during early stages of this study, Dr. Brad Amos for     other local interneurons and form GABAergic synapses onto out-
help with setting up the confocal microscope, and Dr. Bazbek Davletov for the gift of botulinum toxin. We also thank   put pyramidal neurons to mediate feedforward IPSPs. By receiv-
the mechanical workshop staff for all their help.                                                                      ing excitatory input from CA3 neurons and evoking inhibition of
   Correspondence should be addressed to Baljit S. Khakh, Medical Research Council Laboratory of Molecular Biol-
ogy, Hills Road, Cambridge CB2 2QH, UK. E-mail: bsk@mrc-lmb.cam.ac.uk.
                                                                                                                       interneurons and output CA1 pyramidal neurons, s.r. interneu-
   DOI:10.1523/JNEUROSCI.2660-04.2004                                                                                  rons profoundly affect network activity within circuits (McBain
Copyright © 2004 Society for Neuroscience 0270-6474/04/248606-15$15.00/0                                               and Fisahn, 2001). Astrocytes are abundant in the hippocampus;
Bowser and Khakh • ATP Excites Interneurons J. Neurosci., September 29, 2004 • 24(39):8606 – 8620 • 8607
their processes profusely interleave between synapses in the s.r. UK) MRC-600 laser scanning confocal scan head with attached solid
(Ventura and Harris, 1999). However, the possibility that astro- state 5 mW 488 nm laser light source (Laser 2000). Emitted green fluo-
cytes may regulate interneuron excitability has remained unex- rescence was colleted through a 515 long-pass filter. Bio-Rad CoMOS
plored. In the present study, we provide evidence for a novel software was used for image acquisition.
Immunofluorescent labeling in fixed sections. Young (P13–P18) C57
ATP-mediated excitatory response in interneurons, which draws
mice were perfused through the heart under deep anesthesia in accor-
on neurons and astrocytes, leading to increased synaptic inhibi-
dance with home office and local procedures. The perfusate comprised
tion in interneuron networks. 20 ml of 0.1 M PBS, followed by 50 ml of 4% paraformaldehyde in 0.1 M
PBS (herein called fixative). Blocks of hippocampus, 1 mm thick, were
Materials and Methods placed in fixative and left overnight at 4°C and then cryopreserved in 20%
Preparation of brain slices and electrophysiological recording. The methods sucrose (0.1 M PBS) overnight before cryosectioning (Leica CM3050S
used have been described previously (Khakh et al., 2003). Briefly, young cryostat; Leica, Milton Keynes, UK). Free-floating 30 m sections of
[postnatal day 13 (P13) to P18] C57 mice were killed in accordance with hippocampus were then extensively washed in PBS, and nonspecific pro-
home office and local procedures. Coronal slices of hippocampus (200 or tein binding was blocked by a subsequent incubation in 3% normal goat
300 m) were cut (model 1000 Plus; Vibratome, St. Louis, MO) and serum (NGS) for 2 hr. Sections were then incubated in the following
submerged at room temperature in artificial CSF (aCSF) comprising the primary antibodies: rabbit anti-parvalbumin polyclonal antibody
following (in mM): 126 NaCl, 2.5 KCl, 1.3 MgCl2, 10 D-glucose, 2.4 CaCl2, (1:2000, 23°C, 2 hr; Abcam, Cambridge UK), rabbit anti-calbindin poly-
1.24 NaH2PO4, and 26 NaHCO3 saturated with 95% O2 and 5% CO2. clonal antibody (1:1000, 23°C, 2 hr; Chemicon, Hampshire, UK), rabbit
Experiments were performed at room temperature or 34°C as indicated. anti-P2Y1 polyclonal antibody (1:200, 4°C overnight; Abcam), mouse
Experiments were performed with potassium gluconate or chloride- anti-calretinin monoclonal antibody (1:50, 23°C, 12 hr; Abcam), and
based internal solution comprising the following (in mM): 120 mouse anti-glial fibrillary acidic protein (GFAP) monoclonal antibody
K-gluconate (or Cl ⫺), 10 KCl, 1 MgCl2, 0.03 CaCl2, 0.1 EGTA, 1 ATP, 0.2 (1:1000, 23°C, 2 hr; Abcam). All antibodies were prepared in 1% NGS
GTP, 10 HEPES, 4 glucose, pH 7.25. The resistance of the pipettes was and 0.3% Triton X-100 in 0.1 M PBS. After extensive washes in 0.1 M PBS,
⬃4 –9 M⍀. Cells were visualized with infrared optics (900 nm; Olympus, sections were exposed to an appropriate secondary (anti-rabbit or anti-
Southall, UK) on an upright microscope (BX51; Olympus). Puffs of ATP mouse IgG) antibody conjugated to either Alexa-488 or Alexa-647 (Mo-
were applied under visual control using a Picospritzer II (General Valve, lecular Probes) for 30 min at 23°C. Sections were then placed onto elec-
Fairfield, NJ). In our previous work, we applied agonists directly to the trostatically charged slides and mounted underneath coverslips with
bath (Khakh et al., 2003) over tens of seconds, but in the present study, Vectashield (Vector Laboratories, Peterborough, UK). Sections were im-
we used a fast bath application system (RV-8; Warner Instruments, aged with a Bio-Rad Radiance confocal microscope equipped with a 488
Hamden, CT), ensuring that oxygenated solutions were applied to the nm emitting argon laser and a 637 nm emitting red diode enabling si-
brain slice chamber within 500 msec for complete bath change in ⬃1.5 multaneous acquisition of double fluorescently labeled sections.
sec. Synaptic currents were recorded in the presence of 6-cyano-7- Classification of interneurons. In a specific set of experiments, 0.5%
nitroquinoxaline-2,3-dione (CNQX; 10 M) to block AMPA/kainate re- biocytin was included in the intracellular solution during whole-cell re-
ceptors. ATP-induced inward currents were recorded in CNQX (10 M), cording from interneurons in 200 m coronal sections of hippocampus.
AP-5 (10 M), bicuculline (10 M), and tetrodotoxin (TTX; 1 M). The In some cases, interneurons were actively filled with biocytin by current
adenosine receptor antagonist cyclopentyl-1,3-dipropylxanthine injection for up to 20 min (⫹200 pA for 1 sec at 0.5 Hz). After recording
(DPCPX; 10 –100 M) was always present in the bathing medium and and biocytin filling, interneurons were “depatched” by applying small
ruled out P1 receptor involvement. The concentrations of agonists and amounts of positive pressure while slowly withdrawing the pipette to
antagonists used are higher than those used in biochemical studies of P2Y minimize cell damage and leaking of biocytin. Sections were then re-
receptors because of breakdown and/or penetration barriers that are turned to oxygenated buffer for 1–2 hr to enable diffusion of biocytin to
inherent with brain slice recording (North, 2002). Inward currents were distant processes and then placed in fixative at 4°C overnight. The next
recorded at ⫺60 mV using pCLAMP 9 software, Multiclamp 900A am- day, sections were processed for immunoreactivity for the calcium-
plifier, and Digidata 1322A (Axon Instruments, Foster City, CA). binding proteins calbindin or calretinin or for the astrocyte marker
Paired recordings. The whole-cell patch-clamp configuration (⫺60 GFAP as described above for 30 m fixed sections. After thorough
mV) was attained for postsynaptic interneurons and pyramidal neurons washes in 0.1 M PBS, sections were incubated in a solution containing
with a KCl-based pipette solution containing 1 M N-ethyl bromide streptavidin-conjugated to Alexa-488 (dilution, 1:1000; Molecular
quaternary salt of lidocaine to block action currents. Presynaptic inter- Probes) as well as appropriate fluorescent secondary antibodies for visu-
neurons were then patched with a K-gluconate-based pipette solution alization of calbindin, calretinin, or GFAP immunoreactivity as de-
and held in current-clamp bridge mode. Depolarizing current (100 – 400 scribed above. Sections were placed on electrostatically charged slides
pA, 2– 4 msec) was injected in the presynaptic neuron to evoke action and mounted underneath coverslips with Vectashield (Vector Laborato-
potentials and to determine whether it was connected to the putative ries). Sections were imaged with a Bio-Rad Radiance confocal micro-
postsynaptic neuron. If there was no postsynaptic current after 50 trials, scope (see above). In many cases, we collected several image series going
the pair was deemed unconnected, the presynaptic neuron pipette was deep into the slice (Z-stacks) using a 100⫻ oil immersion lens (Nikon,
withdrawn, and another presynaptic neuron was sought. This procedure Tokyo, Japan). These images were later used to determine the shape and
was repeated until connected pairs were found. Consistent with previous dendritic orientation of the biocytin-filled interneuron using Bio-Rad
work, s.r. interneuron–interneuron connectivity was found in 14 of 67 software, NIH ImageJ, and CorelDraw12 (Corel, Maidenhead, UK).
pairs (20.8%), and s.r. interneuron–CA1 pyramidal neuron connectivity Chemicals. All chemicals used were from Tocris Cookson (Bristol, UK)
was found in 11 of 132 pairs (8.3%) (Bertrand and Lacaille, 2001). or Sigma (Poole, UK). Fluorescent dyes were from Molecular Probes.
Confocal imaging of astrocyte activity. Brain slices were loaded at room The chemicals are pyridoxal-phosphate-6-azophenyl-2⬘,4⬘-disulfonic
temperature in the dark with 5 M Fluo-4-AM (Molecular Probes, In- acid (PPADS), CNQX, L-(⫹)-2-amino-5-phosphonopentanoic acid (L-
vitrogen, Paisley, UK) in aCSF for 60 min and then transferred to dye- AP-5), 2-methylthio-ATP (2MeSATP), 2-methylthio-ADP (2MeSADP),
free aCSF for at least 30 min before experimentation to allow for cleavage adenosine 5⬘-o-(2-thiodiphosphate) (ADPS), RS-3,5-dihydroxyphenyl-
of the AM ester group (Porter and McCarthy, 1996). Live astrocytes were glycine (DHPG), and 2-methyl-6-(phenylethynyl)pyridine hydro-
predominantly loaded with the fluorescent dye with these conditions. chloride (MPEP).
This was confirmed by simultaneous acquisition of infrared differential Analysis. Synaptic currents were analyzed using MiniAnalysis program
interference contrast optics (IR-DIC) images of astrocytes in the same 5.6.22 (Synaptosoft, Decatur, GA), Strathclyde Electrophysiology Soft-
area. In some cases, individual interneurons were loaded through the ware (John Dempster, University of Strathclyde, Glasgow, Scotland,
patch pipette with Alexa-488 (50 M) or biocytin (0.5%) to approximate UK), pCLAMP9 (Axon Instruments), Origin 6.1 (OriginLab,
neuron shape. Cells and slices were imaged using a Bio-Rad (Ringstead, Northampton, MA), and Graphpad Instat 3.06 for Windows (GraphPad8608 • J. Neurosci., September 29, 2004 • 24(39):8606 – 8620 Bowser and Khakh • ATP Excites Interneurons
Software, San Diego, CA). Postsynaptic unitary IPSC (uIPSC) latency
was defined as the time between the maximum slope of the presynaptic
action potential rising phase and the initiation of the uIPSC (defined as a
5% deviation from baseline). Confocal and epifluorescence imaging data
were analyzed using Image J, custom written macros for the MRC-600
and CorelDraw12. Data in the text and graphs are shown as mean ⫾ SEM
from n determinations as indicated. Two tailed t tests were used for most
statistical analyses with significance declared at p ⬍ 0.05. The Kolmog-
orov–Smirnov two-sample test was used to compare cumulative proba-
bility curves of sIPSC amplitudes and mIPSC interevent intervals with
significance declared at p ⬍ 0.05.
Results
Unless otherwise stated, all of the experiments reported in this
study are in the presence of the adenosine receptor antagonist
DPCPX (10 M), ruling out adenosine receptor involvement. We
start by reporting the effects of exogenous ATP on single inter-
neurons, astrocytes, and inhibitory transmission. We go on to
study the effects of endogenous ATP on astrocyte signaling and
synaptic inhibition in interneurons.
ATP evokes slow inward currents and depolarizations of
stratum radiatum interneurons
S.r. interneurons were discriminated from CA1 pyramidal neu-
rons with the aid of IR-DIC on the basis of anatomical location,
characteristic somatic shape, and ability to fire high-frequency
action potentials (see next section for interneuron classification).
ATP, or the more stable analog ATP␥S, failed to evoke inward
currents when puffed briefly to voltage-clamped s.r. interneuron
somata (Khakh et al., 2003) (100 M; 10 –500 msec; 2.6 ⫾ 1.7 pA Figure 1. Slow ATP␥S evoked excitation of interneurons. A, Stratum radiatum interneurons
were held in voltage clamp (⫺60 mV), and ATP␥S (100 M) and glutamate (10 M) were
change in holding current at ⫺60 mV; n ⫽ 12) (Fig. 1 A). How-
puffed for 500 msec to the neuron cell body. These recordings were made in aCSF not containing
ever, rapid bath application of ATP␥S (see Materials and Meth- CNQX. B, Bath application of the same concentrations of ATP␥S and glutamate in the presence
ods) evoked peak inward currents of ⫺36.0 ⫾ 6.7 pA (20 – 80% of CNQX (10 M). C, Normalized ATP␥S and glutamate evoked peak currents shown in B. Note
rise time; 25.7 ⫾ 5.2 sec; n ⫽ 24) (Fig. 1 B). These slow ATP␥S- the differences in rise and decay times. D, S.r. interneurons depolarized and generated action
evoked currents showed little desensitization for agonist applica- potentials during bath application of 100 M ATP␥S. E, The action potentials were blocked by 1
tions of 180 sec, and slow–incomplete recovery such that the M TTX revealing the underlying ATP␥S-evoked depolarization. F, Example traces from an s.r.
residual current remaining 5 min after washout was 36.6 ⫾ 3.1% interneuron held in current clamp with 50 pA of depolarizing current injection before (top trace)
of that at the peak (n ⫽ 24) (Fig. 1C). In contrast to the results and in the presence of ATP␥S (bottom trace). The graph on the right shows the number of action
with ATP␥S, glutamate readily evoked reversible inward currents potentials generated during each depolarizing current step under control conditions and in the
whether it was puffed briefly onto the soma to activate AMPA presence of 100 M ATP␥S.
channels (Fig. 1 B) or applied to the bath when ionotropic gluta-
mate receptors were blocked (Fig. 1C) (⫺271.4 ⫾ 44.1 pA for that responded to glutamate with an increase in action potential
puff application, n ⫽ 12; ⫺103.8 ⫾ 31.6 pA for bath application, firing (14.7 ⫾ 3.8 Hz) responded likewise to ATP␥S (62.9 ⫾ 9.9
n ⫽ 8). These experiments suggest that, although glutamate acti- Hz; n ⫽ 9). Collectively, these experiments indicate that although
vates receptors on interneuron somata, ATP may activate recep- the slow response to ATP␥S is modest under voltage-clamp con-
tors accessible only when agonist was applied more globally and ditions (Fig. 1 B), it is of sufficient size to excite interneurons.
rapidly to the slice. Alternatively, or in addition, ATP␥S may
activate receptors on nearby astrocytes to cause the release of ATP ATP excites calbindin- and calretinin-positive stratum
or other substances (Newman, 2003a) that then act on the inter- radiatum interneurons
neurons to evoke the slow inward current (Fig. 1C). We address All interneurons in s.r.–s.l-m. responded to ATP with responses
these possibilities below. similar to those described above (266 interneurons from 180
In current-clamp recordings, ATP␥S caused a significant mice over a 1 year period) (Fig. 1). We next sought to further
(⫹10.7 ⫾ 0.4 mV) depolarization of interneurons from resting classify these interneurons within the framework proposed on
levels (⫺65.2 ⫾ 1.5 mV; n ⫽ 10) (Fig. 1 D). In 8 of 10 neurons, the the basis of morphological, biochemical, and electrophysiologi-
depolarization was sufficient to cause interneurons to fire action cal properties (Parra et al., 1998). We started by performing an
potentials (Fig. 1 D). The size of the ATP␥S-evoked depolariza- initial survey of calcium-binding protein expression (parvalbu-
tion was of similar magnitude when action potentials were min, calretinin, or calbindin) in 30 m sections of juvenile mouse
blocked (⫹10.4 ⫾ 0.6 mV in the presence of TTX; n ⫽ 7; p ⬎ hippocampus (Fig. 2 A). Consistent with recent mouse studies
0.05) (Fig. 1 E). In the other two (of 10) cases, where the depolar- (Matyas et al., 2004), interneurons within s.r.–s.l-m. were pre-
ization was small (⬍5 mV), ATP␥S increased the excitability of dominantly calbindin and calretinin immunoreactive, whereas
interneurons such that the interneurons fired more action poten- parvalbumin immunoreactivity was limited to stratum oriens
tials at lower levels of depolarizing current (Fig. 1 F). We also (s.o.) and s.r. areas close to the pyramidal cell layer (Fig. 2 A). We
performed extracellular cell-attached recordings from interneu- consider it unlikely that the electrophysiological responses de-
rons at the more physiological temperature of 34°C. All neurons scribed in this study (Fig. 1) are from parvalbumin-expressingBowser and Khakh • ATP Excites Interneurons J. Neurosci., September 29, 2004 • 24(39):8606 – 8620 • 8609
able at www.jneurosci.org) or calretinin (supplemental material,
available at www.jneurosci.org). For our most complete data set,
68% of interneurons with ATP-evoked currents were positive for
calbindin, whereas 32% were negative (supplemental material,
available at www.jneurosci.org). Moreover, in another set of ex-
periments, we attempted to relate ATP-evoked currents and cal-
retinin immunoreactivity. We found that 41% of interneurons
with ATP-evoked currents were positive for calretinin, whereas
59% were negative (supplemental material, available at www.
jneurosci.org). Thus, of the interneurons that are depolarized by
ATP, ⬃60 –70% are calbindin positive and ⬃30 – 40% are calreti-
nin positive. Within these classes, defined by expression of the
calcium-binding proteins calbindin and calretinin, ATP-evoked
currents occurred in all neurons regardless of soma location, den-
dritic orientation, firing pattern, resting membrane potential, or
action potential half width (supplemental material, available at
www.jneurosci.org) (Fig. 2). The basic properties of interneurons
reported in this study are consistent with past work (Parra et al.,
1998; Matyas et al., 2004).
The slow ATP-evoked response increases synaptic inhibition
If interneurons fire more readily in response to ATP (Fig. 1 F),
then does this have an impact on their postsynaptic targets within
the hippocampal circuit? To address this, we determined whether
ATP␥S could increase GABAergic synaptic events onto s.r.–s.l-m.
interneurons and CA1 pyramidal neurons. Interneurons were
voltage clamped with a KCl-based intracellular solution (ECl ⫽
⫺1.3 mV) to allow the detection of inward GABAA receptor-
mediated IPSCs at ⫺60 mV (Fig. 3A). In 21 of 26 neurons, appli-
cation of ATP␥S (100 M) evoked an inward current (⫺28.9 ⫾
4.2 pA) and an increase in both the frequency (2.7 ⫾ 0.5 to 9.6 ⫾
2.0 Hz) and amplitude of spontaneous IPSCs (sIPSCs; in all cases,
the amplitude distributions shifted to larger peaks) (Fig. 3B). The
sIPSCs evoked by ATP␥S were blocked by bicuculline and TTX
(data not shown). These experiments suggest that when s.r.–
s.l-m. interneurons are excited by ATP␥S, they fire action poten-
tials and release GABA onto their postsynaptic targets, thus in-
creasing inhibition within the network. To further explore this
possibility, we recorded from connected pairs of s.r.–s.l-m. inter-
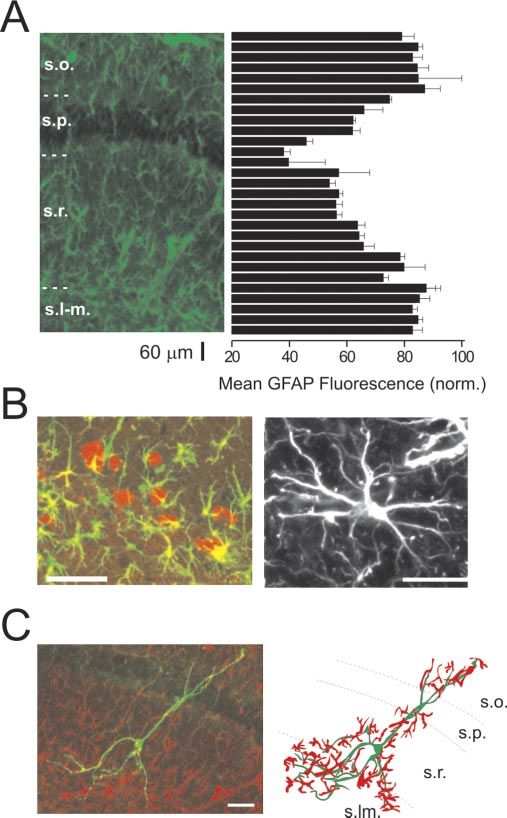
Figure 2. Characterization of CA1 s.r.–s.l-m. interneurons. A, Immunofluorescence micro- neurons (Fig. 3C). The probability of a single evoked action po-
graphs of neurons immunoreactive for parvalbumin, calbindin, or calretinin. Scale bar, 50 m. tential causing a uIPSC (⫺75.5 ⫾ 11.0 pA) in the postsynaptic
B, Montage of confocal Z-stacks flattened to present an overview of a biocytin-filled interneuron interneuron was 0.24 ⫾ 0.04 (n ⫽ 14 pairs; 100 trials per pair).
reconstructed on the right with predominantly horizontal dendrites (black) and axonal arborization ATP␥S-evoked spontaneous action potential firing in eight of
confined to s.r.–s.l-m. (gray) (see supplemental material, available at www.jneurosci.org, cell 6, for nine presynaptic interneurons and 28% (probability, 0.28 ⫾ 0.09;
additional details of this interneuron). Scale bar, 50 m. C, Properties of the interneuron pre- n ⫽ 8) of these triggered uIPSCs in the postsynaptic interneurons
sented in B. i, Immunofluorescence image of biocytin (green) and calbindin (red) immunoreac- (Fig. 3C) (⫺75.5 ⫾ 11.4 pA).
tivity, with overlay in yellow. Note that several calbindin-positive interneurons are present in We next tested whether the s.r. interneurons that are excited
this image. Scale bar, 25 m. ii, Current in response to 100 M ATP␥S. iii, Action potential
by ATP␥S synapse exclusively onto other interneurons or addi-
generated by a 5 msec current pulse of ⫹150 pA. iv, Irregular action potential discharge pattern
generated during depolarizing current injection. s.p., Stratum pyramidale.
tionally onto output CA1 pyramidal cells. Bath-applied ATP␥S
failed to evoke inward currents in CA1 pyramidal neurons
(Khakh et al., 2003) (Fig. 3D) (n ⫽ 8) but dramatically increased
interneurons, because we recorded only from s.r. interneurons the frequency and amplitude of sIPSCs in a TTX-sensitive man-
distal to the pyramidal cell layer and near the s.l-m. border. We ner (seven of eight neurons) (Fig. 3E). We recorded from con-
next tested the hypothesis that the neurons reported in this study nected pairs of SR interneurons and CA1 pyramidal neurons to
are positive for calbindin and calretinin and attempted to relate determine whether the ATP␥S-evoked increase in sIPSC fre-
the size of the ATP-evoked currents with electrophysiological and quency onto pyramidal neurons (Fig. 3F ) arises from s.r. or other
morphological properties of interneurons. We recorded peak and interneurons within the slice. The probability of a spontaneous
residual ATP-evoked currents from 44 interneurons (Figs. 1, 2C) action potential causing a uIPSC in the postsynaptic pyramidal
and compared these to the location of interneuron somata (Fig. neuron was 0.57 ⫾ 0.01, and in the presence of ATP␥S, this was
2 B), dendritic orientations (Fig. 2 B), resting membrane poten- 0.60 ⫾ 0.02. However, uIPSCs triggered by presynaptic ATP␥S-
tials (supplemental material, available at www.jneurosci.org), fir- evoked action potentials were larger than those evoked by action
ing patterns (Fig. 2C), action potential half widths (Fig. 2C), and potentials as a result of depolarizing current injection into the
expression of calbindin (Fig. 2C) (supplemental material, avail- presynaptic neurons (⫺81.4 ⫾ 7.0 pA vs ⫺55.1 ⫾ 4.7 pA; p ⬍8610 • J. Neurosci., September 29, 2004 • 24(39):8606 – 8620 Bowser and Khakh • ATP Excites Interneurons
0.05); the GABAA synaptic conductance
was increased from 0.9 ⫾ 0.1 to 1.4 ⫾ 0.1
nS (n ⫽ 8). Thus, ATP␥S increased inhibi-
tion onto output pyramidal neurons in
two ways, by increasing the frequency of
IPSCs and by triggering IPSCs of larger
synaptic conductance. The increased syn-
aptic conductance may be caused by pre-
synaptic effects of ATP such as facilitation
or to postsynaptic effects, which may have
increased GABAA receptor-mediated re-
sponses in pyramidal neurons. We hope to
discriminate between these two possibili-
ties in future experimental work. To-
gether, our data from interneuron–inter-
neuron and interneuron–pyramidal
neuron pairs suggest that although the ef-
fect of ATP on single interneurons is exci-
tatory (Fig. 1), its effect at the level of the
network is dominated by heightened syn-
aptic inhibition (Fig. 3).
Figure 3. ATP increases synaptic inhibition onto stratum radiatum interneurons and CA1 pyramidal neurons. A, ATP␥S caused
A role for P2Y1 receptors an inward current as well an increase in the frequency (freq.) and amplitude of spontaneous IPSCs in 21 of 26 interneurons (traces
The ATP␥S-evoked inward current in in- show 3 superimposed 3 sec sweeps). B, Left graph, Average data for changes in sIPSC frequency in the absence of TTX. Right graph,
terneurons developed slowly with a 20 – Cumulative probability (Prob.) plots of IPSC amplitude before and during ATP␥S. C, The diagram illustrates the recording set up,
80% rise time of 25.7 ⫾ 5.2 sec (Fig. 1C). with one s.r. interneuron as the presynaptic cell held in current clamp and another as the postsynaptic cell held in voltage clamp.
Moreover, membrane conductance was Top panel, Membrane potential recording from a presynaptic s.r. interneuron showing spontaneous action potentials during the
application of ATP␥S. Bottom panel, Membrane current recording from a postsynaptic s.r. interneuron showing IPSCs. D, ATP␥S
unaltered (1.6 ⫾ 0.2 nS in control to 1.6 ⫾
caused no inward current but increased in the frequency and amplitude of sIPSCs in CA1 pyramidal neurons (traces show 3
0.2 nS in ATP␥S; n ⫽ 23) during the slow superimposed 3 sec sweeps). Postsynaptic uIPSCs showed a short latency (2.7 ⫾ 0.1 msec; n ⫽ 14 pairs) and displayed 20 – 80%
inward currents, whereas P2X channels in- rise times of 1.7 ⫾ 0.1 msec and decay time constants of 13.4 ⫾ 0.7 msec, respectively (n ⫽ 14 pairs). E, Left graph, Average data
crease neuronal membrane conductance for changes in sIPSC frequency in the absence of TTX. Right graph, Cumulative probability plots of IPSC amplitude before and
(North, 2002). The lack of effect on mem- during ATP␥S. F, The diagram illustrates the recording set up, with an s.r. interneuron as the presynaptic cell held in current clamp
brane conductance combined with strong and a CA1 pyramidal neuron as the postsynaptic cell held in voltage clamp. Top panel, Membrane potential recording from a
membrane potential depolarization (Fig. presynaptic s.r. interneuron showing spontaneous action potentials during the application of ATP␥S. Bottom panel, Membrane
1) recalls similar data with muscarinic ago- current recording from a postsynaptic CA1 pyramidal neuron showing IPSCs. Unitary IPSCs onto pyramidal neurons displayed
nists and suggested the activation of 20 – 80% rise times of 1.0 ⫾ 0.2 msec and decay time constants of 11.6 ⫾ 1.1 msec (n ⫽ 8 pairs). s.r.–s.p. pairs had an average
metabotropic receptors (Shen and North, uIPSC latency of 4.1 ⫾ 0.3 msec in control conditions and 4.2 ⫾ 0.3 msec in ATP␥S (n ⫽ 5 pairs; Fig. 3g).
1992; McQuiston and Madison, 1999). To
determine the nature of the receptors responsible for the re- We detected P2Y1 immunoreactivity in numerous CA1 inter-
sponses described in Figures 1– 6, we exploited the known phar- neurons in s.o., s.r., and s.l-m. (Fig. 4 E), which was similar to the
macological properties of ATP receptors. We used two measures pattern observed for parvalbumin, calbindin, and calretinin ex-
of receptor activation, the amplitude of the agonist-evoked in- pressing neurons (Fig. 2 A). No P2Y1 staining was observed in
ward current in single neurons and percentage of increases in the CA1 pyramidal neurons, which is consistent with the lack of
frequency of sIPSCs onto single SR interneurons. We began by ATP-evoked currents in these cells (Khakh et al., 2003) (Fig. 3D).
examining the relative effects of agonists known to activate dis- Higher magnification views clearly showed that the somata of
tinct types of ATP receptors. Each putative agonist was applied interneurons in s.r. and s.l-m. are immunopositive for P2Y1 (Fig.
for 3 min, washed out for 7 min, and then 100 M ATP␥S was 4 E). Interestingly, within the s.r., there were numerous finer
applied to verify that the interneuron was responsive to this con- structures that were also immunopositive for P2Y1 receptors (Fig.
trol agonist. Inward currents similar to those evoked by ATP␥S 4 E, arrows); these may represent the processes of interneurons
were observed for ATP (1 mM; pH 7.4), 2MeSATP (100 M), and/or astrocytes. Overall, these pharmacological and antibody
2MeSADP (100 M), and ADPS (100 M). In contrast, UTP (1 labeling experiments provide evidence for functional P2Y1 recep-
mM; pH 7.4), ␣meATP (100 M), and adenosine (1 mM in the tors on interneurons (Moore et al., 2000; Moran-Jimenez and
absence of DPCPX) were without effect (Fig. 4 A, B). Overall, this Matute, 2000).
agonist profile argues against P1 and P2X receptors and implies
the involvement of P2Y1, P2Y11, or P2Y12 receptors (von Kugel- The peak and residual ATP-evoked inward currents are
gen and Wetter, 2000). Consistent with this, the responses were carried by two types of conductance
blocked by the P2 receptor antagonist PPADS (30 M) and the We used the more specific agonist ADPS to gain insight into the
P2Y1 antagonist 2⬘-deoxy-N 6-methyladenosine 3⬘,5⬘- ionic basis of the P2Y1 receptor-mediated inward current (Fig.
bisphosphate (MRS2179; 10 M) (Moro et al., 1998). A similar 4 B) and either applied slow voltage ramps from ⫺100 to ⫹40 mV
pharmacological profile was found when we measured the in- (over 15 sec) or 10 mV voltage steps over the same voltage range
crease in sIPSCs arriving onto interneurons, which probably pro- before ADPS (Fig. 5Ai) at the peak of the inward current (Fig.
vides a better measure of increased synaptic inhibition across the 5Aii) and after ADPS washout for 10 min at the residual phase
network (Fig. 4C,D). of the current (Fig. 5Aiii,Biii). All data shown in Figure 5 are fromBowser and Khakh • ATP Excites Interneurons J. Neurosci., September 29, 2004 • 24(39):8606 – 8620 • 8611
Figure 4. Pharmacological properties of ATP responses in SR interneurons. A, Exemplar
traces showing whole-cell voltage-clamp currents at ⫺60 mV first to a test nucleotide (ATP)
and then to ATP␥S (100 M). B, Average data for each test agonist: ATP␥S (100 M; n ⫽ 22),
ATP (1 mM; pH 7.4; n ⫽ 8), 2MeSADP (100 M; n ⫽ 8), ADPS (100 M; n ⫽ 16), ␣meATP
(100 M; n ⫽ 10), UTP (100 M; n ⫽ 11), and adenosine (100 M; n ⫽ 7). Data are also shown
for ATP␥S-evoked currents in slices incubated in MRS2179 (30 M; n ⫽ 19) and PPADS (10 M;
n ⫽ 6). C, Spontaneous IPSCs were recorded in voltage-clamp mode at ⫺60 mV (KCl intracel-
lular solution) first to a test nucleotide agonist and then to test ATP␥S. An example experiment Figure 5. Electrophysiological properties of P2Y1 receptor-mediated inward currents. A, The
is shown in C where the frequency of sIPSCs is normalized to baseline. D shows the average peak trace shows average ADPS-evoked inward currents recorded from interneurons at ⫺60 mV
sIPSC frequency increase for each agonist tested: ATP␥S (100 M; n ⫽ 21), ATP (1 mM; pH 7.4; (n ⫽ 12). The points i, ii, and iii indicate the time when current–voltage relationships presented
n ⫽ 5), 2MeSADP (100 M; n ⫽ 7), ADPS (100 M; n ⫽ 16), ␣meATP (100 M; n ⫽ 8), in B–E were determined. Current–voltage (I–V ) relationships were determined using voltage
UTP (100 M; n ⫽ 11), and adenosine (100 M; n ⫽ 6). Data are also shown for ATP␥S-induced ramps from ⫺100 to ⫹40 mV (9.3 mV/sec) before ( i), at the peak of the ATP␥S current (ii), and
responses in slices incubated in MRS2179 (30 M; n ⫽ 9) and PPADS (10 M; n ⫽ 11). The after washout of ATP␥S (iii) as indicated in A. The resulting I–V relationships for a single exper-
asterisk indicates significant responses. E, Confocal images of P2Y1 expressing interneurons in iment are shown in B. Subtraction of I–V relationships indicates the average I–V relationships of
CA1. Scale bar, 50 m. Note the highly fluorescent distinct somata are confined to interneurons the peak and residual currents (n ⫽ 10; C–E). Inset in D is an expanded I–V region from ⫺100
in s.r., s.l-m., and s.o. The more diffuse staining in the pyramidal cell layer is probably not to ⫺80 mV to show reversal potentials for each individual neuron. F, Average ADPS-evoked cur-
specific and has been observed by others (Matyas et al., 2004). rents recorded from interneurons under control conditions (F) and then in the presence of group I
mGluR antagonists MPEP and LY367385 (100 M; G). The points i, ii, and iii in G indicate where
current–voltage relationships presented in I and J were determined. H, Normalized traces shown in F
voltage ramps, but Table 1 includes average data for ramps and and G. I, Current–voltage relationships from ramps for an ADPS-evoked current in the presence of
steps. The current–voltage relationship at the peak of the ADPS- mGluR blockers. J, Subtraction of I–V relationships at i and ii indicates the average I–V relationship of
the peak current, with reversal of the current close to 0 mV (n ⫽ 8).
evoked inward current (ii minus i) was complex, with no appar-
ent reversal potential over the range ⫺100 to ⫹40 mV (Fig. 5C),
suggesting that the peak response may consist of at least two clear that all of the currents do indeed reverse polarity, and the
underlying currents with differing reversal potentials but over- average data are presented in Table 1. This suggests that the
lapping activation ranges (Shen and North, 1992; McQuiston and ATP␥S-evoked residual current was attributable to suppression
Madison, 1999). We calculated the current–voltage relationship of a K ⫹ conductance (McQuiston and Madison, 1999). We de-
of the slow plateau current (Fig. 5D, iii minus i) and found the termined the current–voltage relationship of the peak current
reversal potential to be ⫺89.6 ⫾ 1.5 mV (n ⫽ 10) close to the (Fig. 5E, ii minus iii). The most salient features were as follows:
Nernst potential for K ⫹ ions at ⫺99.8 mV. This reversal potential (1) an inward current at ⫺60 mV, (2) little change in slope con-
is hard to see from the average graph (Fig. 5D), because the cur- ductance in the range of ⫺100 to ⫺20 mV, (3) strong outward
rent was small and the reversal potentials varied between cells. To rectification, and (4) a reversal potential (⫺14.5 ⫾ 3.4 mV), sug-
ameliorate this, we plotted the ramp current–voltage relation- gestive of a nonselective cationic current. Together, these electro-
ships for all neurons on an expanded scale (Fig. 5D, inset); it is physiological properties argue against P2X channels (North,8612 • J. Neurosci., September 29, 2004 • 24(39):8606 – 8620 Bowser and Khakh • ATP Excites Interneurons
2002) and instead imply activation of a Table 1. Properties of ADPS-evoked inward currents in interneurons using voltage steps and slow voltage
nonselective cationic current (average cur- ramps
rent–voltage relationships for 10 cells are Erev peak current (mV) n Erev residual current (mV) n
presented in Fig. 5C– E). Consistent with ADPS (voltage steps) ⫺15.7 ⫾ 1.9# 9 ⫺92.3 ⫾ 3.1 9
this, addition of the broad-spectrum cat- ADPS (voltage ramps) ⫺14.5 ⫾ 3.4 #
10 ⫺89.6 ⫾ 1.5 10
ion channel blockers Cd 2⫹ (30 M; n ⫽ 8) ADPS plus mGluR blockers (voltage ramps) ⫺3.2 ⫾ 1.1* 8 ⫺ ⫺
and La 3⫹ (10 M; n ⫽ 8) reduced the am- The transmembrane voltage was stepped from ⫺60 mV to the desired potential (between ⫺100 and ⫹40 mV) for 3 sec every 5 sec, or in the case of ramps,
plitude of the inward current by 63.7 ⫾ it was initially stepped from ⫺60 to ⫺100 mV for 2 sec and then ramped to ⫺40 mV over a 15 sec period (9.3 mV/sec) every 20 sec. Calculated potassium
4.4% (n ⫽ 8) and 72.7 ⫾ 5.4% (n ⫽ 8), ion equilibrium potential for our experimental conditions is ⫺99.8 mV. The peak current reversal potential was significantly different ( p ⬍ 0.05) to that
#
measured at the residual phase for the same cells. This was true for experiments that used voltage steps or ramps. The ⫺ symbol indicates that there was no
respectively. Interestingly, intracellular di- residual current in cells where metabotropic glutamate receptors were blocked. The asterisk indicates that the peak current reversal potential for these cells
alysis of interneurons with GDPS (100 was significantly different from that measured from cells where metabotropic receptors were not blocked.
M; n ⫽ 6) through the patch pipette to
block G-protein-mediated signaling did glutamate release acting on group I metabotropic glutamate recep-
not reduce the ATP␥S-evoked inward current (⫺30.3 ⫾ 3.2 pA vs tors (Krause et al., 2002). Because interneurons have dendritic ar-
⫺36.0 ⫾ 6.7 pA). This suggests that G-proteins are not involved, bors, we cannot rule out the possibility that the reported reversal
and P2Y1 receptors may directly couple to ion channels, as pre- potential estimates may be contaminated to some extent by un-
dicted from detailed heterologous expression studies (O’Grady et avoidably inadequate voltage clamp of distal processes. The data
al., 1996; von Kugelgen and Wetter, 2000; Lee et al., 2003). Over- should be interpreted with these considerations in mind.
all, the experiments presented in Figure 5 and Table 1 suggest that Astrocytes are potential sources of endogenous glutamate re-
ADPS activation of P2Y1 receptors depolarizes interneurons by lease in response to P2Y receptor activation. But are astrocytes
activating a nonselective cationic conductance and suppressing a actually excited by P2Y receptor agonists in our experiments in
K ⫹ conductance. brain slices? To address this, we applied ATP␥S or ADPS (100
M) (Fig. 6 B), monitored interneuron transmembrane current,
and imaged Ca 2⫹ levels in astrocytes in the s.r.–s.l-m. (Fig.
The residual component of the ADPS-evoked current was 6 A–C) (movie in supplemental material, available at www.
mediated by glutamate and accompanied by persistent jneurosci.org). Some astrocytes displayed spontaneous Ca 2⫹ oscil-
2ⴙ
increases in astrocyte Ca oscillations lations, whereas others fluoresced only in ADPS, confirming that
We considered the possibility that a component of the ATP- functional P2Y receptors are expressed in astrocytes (Fam et al.,
evoked responses recorded from interneurons may be secondary 2000; Koizumi et al., 2003). On average, the ADPS-evoked increase
to astrocyte activation and the release of glutamate (Parpura and in astrocyte Ca 2⫹ levels displayed rise times of 11.3 ⫾ 1.8 sec,
Haydon, 2000; Newman, 2003b; Liu et al., 2004). The responses whereas the peak current recorded concomitantly from interneu-
described in this study are not caused by kainate–AMPA–NMDA rons was slower (61.5 ⫾ 3.7 sec) (Fig. 6C). Thus, at the peak of the
channels because they were not affected by CNQX and AP-5 (10 astrocyte Ca 2⫹ increase, the inward current had developed by only
M). We explored the possibility that metabotropic glutamate 31.2 ⫾ 4.7%, whereas at the time of the peak current, the astrocyte
receptors (mGluRs) may contribute to part of the ATP␥S-evoked Ca 2⫹ level had already decayed by 54.1 ⫾ 6.5% (n ⫽ 33). Moreover,
inward current (Figs. 1 B, 5A), because group I mGluRs are ex- there was no correlation between the magnitude of the peak ADPS-
pressed in hippocampal interneurons (van Hooft et al., 2000) and evoked current and the peak ⌬F/F in astrocytes (r ⫽ 0.4), implying
astrocytes are known to release glutamate in response to elevated that the two responses were independent. How then do P2Y1 recep-
Ca 2⫹ levels (Pasti et al., 2001). Consistent with previous work tor agonists cause release of glutamate that mediates the residual
(Mannaioni et al., 2001), bath application of the group I mGluR current (Fig. 5H) recorded from interneurons? Interestingly, we ob-
agonist DHPG (10 M) activated inward currents in interneu- served persistent increases in the number of Ca 2⫹ oscillations within
rons (⫺46.6 ⫾ 7.9 pA; n ⫽ 7) that could be blocked with mGluR astrocytes when the P2Y1 receptor agonists had been washed from
antagonists MPEP and ( S)-(⫹)-␣-amino-4-carboxy-2- the bath. This is evident in astrocytes 1, 3, 4, and 5 in Figure 6B, and
methylbenzeneacetic acid (LY367385) (100 M; antagonists of two other examples are shown on an expanded scale in Figure 6D
mGluR5 and mGluR1a receptors, respectively). This current, like before and 5 min after ADPS. Quantification revealed that the vast
the residual ADPS-evoked current (Fig. 5D), is caused by sup- majority of astrocytes (88%) within the s.r.–s.l-m. showed increased
pression of a K ⫹ conductance (Krause et al., 2002). The mGluR Ca 2⫹ oscillations (Fig. 6E), which was reflected as a significant in-
blockers also reduced the peak ADPS-evoked current by ⬃20% crease in the coefficient of variation (SD divided by mean) in astro-
in all cases, although this did not reach significance (n ⫽ 12) (Fig. cyte Ca 2⫹ levels (Fig. 6F). The oscillatory responses in astrocytes are
5 F, G). However, the ADPS-evoked residual current was abol- not likely to be a secondary consequence of neuron activation, be-
ished when metabotropic glutamate receptors were blocked (Fig. cause the experiments were performed in the presence of TTX. We
5G,H ). This is further evidenced by voltage-ramp experiments propose that the residual ATP␥S-evoked current recorded from in-
(Fig. 5I ). With mGluR blocked the peak current–voltage rela- terneurons that persists even when ATP␥S has been removed is be-
tionship shows a reversal potential (⫺3.2 ⫾ 1.0 mV; n ⫽ 8) cause of persistent increases in Ca 2⫹ oscillations within
indicative of a nonselective cationic current and a shape almost astrocytes that release glutamate (Parpura and Haydon, 2000; New-
identical to that calculated for the peak current by subtraction man, 2003b) to activate metabotropic glutamate receptors on
(Fig. 5, compare E and J ). In short, when mGluRs were blocked, interneurons.
the ADPS-evoked inward current displayed no residual compo-
nent, and there was no evidence for suppression of a K ⫹ conduc-
tance by ADPS. We suggest the residual current (Figs. 1 B, 5A), Evidence for endogenous activation of P2Y receptors
which is dominated by suppression of a K ⫹ conductance (Fig. on astrocytes
5D) and persists even when the agonist has been washed from the Astrocytes can be activated by numerous stimuli as they func-
slice (Figs. 1 B, 5A), is primarily attributable to ADPS-evoked tionally express receptors for the transmitters glutamate, acetyl-Bowser and Khakh • ATP Excites Interneurons J. Neurosci., September 29, 2004 • 24(39):8606 – 8620 • 8613
Figure 7. Astrocyte activation by stimulation (stim) of the Schaffer collaterals and the pe-
forant path. A, Schematic diagram of the hippocampus showing glutamatergic SC and PP axons.
A concentric wire electrode was placed in stratum radiatum to stimulate SC or PP axons as
indicated, whereas Ca 2⫹ transients were recorded in astrocytes. B, Fluorescence micrographs
of fluo-4-loaded astrocytes in s.r. without stimuli, with SC stimuli, and with PP stimuli. Numbers
in the left panel indicate astrocytes monitored to obtain recordings shown below in C. D, Bar
graph indicating number of astrocytes that responded to SC and PP stimulation from eight
slices.
thus explored the possibility that ATP may activate nearby astro-
Figure 6. Astrocyte Ca 2⫹ dynamics. A, Fluorescence micrographs of an acute hippocampal cytes. We used similar conditions to those already reported for SC
slice loaded with fluo-4-AM (see Materials and Methods) before ( i), during (ii), and after (iii) stimulation (Porter and McCarthy, 1996) but also stimulated the
ADPS. iv indicates the location of the astrocytes that were monitored (numbered 1–5) and perforant path (PP) axons from entorhinal cortex and recorded
hippocampal cell layers as well as the location of the recording pipette (the patched interneuron
calcium signals from CA1 astrocytes in the same s.r.–s.l-m. area
was below the confocal section). Scale bar, 50 m. B, Traces showing changes in intracellular
Ca 2⫹ for five representative astrocytes indicated in the panels in A. C, Average fluorescence
(Fig. 7A). Astrocytic calcium responses were evoked by trains of
trace from nine astrocytes and the corresponding interneuron current in this experiment. D, stimuli (300 – 800 A; 30 Hz; 3 sec) similar to those used by
Traces showing spontaneous Ca 2⫹ oscillations before and after ADPS for two astrocytes on an researchers to induce calcium responses and long-term synaptic
expanded time scale. The asterisk indicates a transient peak in intracellular Ca 2⫹ concentra- potentiation in hippocampal pyramidal neurons (400 –1000 A;
tion. E, Number of oscillations in the 200 sec before and 200 sec after ADPS for 33 astrocytes. 50 Hz; 2 sec) (Regehr et al., 1989; Regehr and Tank, 1990) and
F, Coefficient of variance was also measured before and after ADPS as a measure of astrocyte calcium responses in astrocytes (200 – 400 A; 50 Hz; 2 sec) (Por-
activity. In F, astrocytes with increased oscillations are shown in black, and those with decreased ter and McCarthy, 1996). Stimulating electrodes were placed be-
oscillations are shown in gray. tween ⬃300 and ⬃750 m from the confocal imaging site in all
eight slices examined. In five slices, we first stimulated the PP and
choline, noradrenaline, serotonin, and ATP (Haydon, 2001). In then repositioned the electrode to stimulate the SC (Fig. 7A) (the
vitro electrical stimulation of Schaffer collateral (SC) afferents order was reversed for three slices). As shown in the fluorescence
leads to excitation of astrocytes in the CA1 region (Porter and micrographs (Fig. 7B) and the overlaid astrocyte Ca 2⫹ transients
McCarthy, 1996). This effect has been partly attributed to gluta- (Fig. 7C), only a proportion of the cells activated by SC stimula-
mate release, which acts on metabotropic glutamate receptors of tion were also activated by PP stimulation (six and four astro-
neighboring astrocytes. SC terminals have also been shown to cytes, respectively, for the exemplar experiment in Fig. 7C). This
release ATP (Wieraszko et al., 1989; Pankratov et al., 1998). We was true of all eight slices investigated (73.8 ⫾ 12.5% of SC-8614 • J. Neurosci., September 29, 2004 • 24(39):8606 – 8620 Bowser and Khakh • ATP Excites Interneurons
stimulated astrocytes responded to PP
stimulation). These differences suggest
that excitation of astrocytes may be stron-
ger for the SC as opposed to the PP path-
way (Fig. 7C,D). We next determined
whether local stimulation within s.r. could
evoke similar responses in astrocytes. A
glass monopolar electrode was positioned
in the center of the confocal field of view,
and astrocyte calcium was monitored
while the length of the stimulation train
was gradually increased from 1 to 80 stim-
uli (10 – 40 A; 30 Hz) (Fig. 8 A, B). This
experiment was repeated in six slices, and
the results of two experiments are shown
in Figure 8 B. Astrocytes closest to the elec-
trode were activated by lower numbers of
stimuli than those further from the point
of stimulation, for which activation was also
delayed (Fig. 8B) (also see below). All loaded
astrocytes could be activated with 80 stimuli
at 30 Hz. We chose to use 100 stimuli at 30
Hz in subsequent pharmacological experi-
ments to ensure reproducible astrocyte
activation.
How does local electrical stimulation
within s.r. cause astrocyte Ca 2⫹ responses?
Within a ⬃200 m square field of view,
95% of the astrocyte responses (56 of 59
astrocytes; nine slices) were blocked by
TTX (1 M). Moreover, astrocyte re-
sponses were abolished (46 of 46 cells; six
slices) when voltage-gated Ca 2⫹ channels
were blocked with cadmium (10 M) (Fig.
8C,D). Finally, very few astrocytes (Fig.
8C) responded during electrical stimu-
lation in slices that had been preincubated
in botulinum neurotoxin E to cleave Figure 8. Astrocytes are activated by vesicular release during local electrical stimulation. A, Confocal images of fluo-4-loaded
synaptosomal-associated protein of 25 astrocytes in hippocampal slices. A glass electrode is placed in the center of the field of view (stim), and trains of stimuli (number
kDa (SNAP-25) (BoToxE, 20 g/ml, 4 hr), indicated on image) are delivered to the slice at 30 Hz. The concentric circles are 50 m apart. The final panel identifies astrocytes
constituting a blockade of the response by monitored and the number of micrometers they are from the electrode. Astrocytes appear to be confined to the bottom left of the
⬎93% (Fig. 8C,D). Because (1) the major- image as the confocal section is taken across an uneven hippocampal slice where fluo-4 loading is often confined to superficial
ity of CA1 s.r. astrocytes do not express astrocytes. B, Representative recordings of astrocyte Ca 2⫹ transients from two slices with increasing numbers of electrical stimuli.
TTX-sensitive Na ⫹ channels (Sontheimer The calcium transients in astrocytes of slice 2 are from the experiment presented in A. C, Ten superimposed traces showing the
2⫹
and Waxman, 1993), (2) there is no evi- change in intracellular Ca for astrocytes under control conditions (i) and in the presence of 1 M TTX (ii), 10 M cadmium (iii),
dence to indicate that s.r. astrocytes ex- and 20 g/ml botulinum toxin E (iv). D, Average traces for treatments indicated in C (TTX: n ⫽ 36, 9 slices; cadmium: n ⫽ 46, 6
press voltage-gated Ca 2⫹ channels, and slices; botulinum toxin E: n ⫽ 35, 5 slices).
(3) astrocytes mostly express SNAP-23
rather than SNAP-25 (Sadoul et al., 1997; Wilhelm et al., 2004), latency between the time of the stimulus and the peak of the Ca 2⫹
these data imply that the trigger for astrocyte responses during elec- increase in astrocytes were smaller for astrocytes close to the elec-
trical stimulation is exocytic release of transmitter from SC and/or trode (Fig. 9Ci) and longer for astrocytes up to 200 m away (Fig.
PP nerve terminals. These experiments do not address the possibility 9Cii), indicative of a signal that spreads out from the site of stim-
that astrocytes may also release transmitter by exocytosis but rather ulation (all data points are shown in Fig. 10 A, control and aver-
support the hypothesis that the initiating stimulus for the responses ages are shown in B). This is reminiscent of the spread in ATP
described in Figure 8 is release from nerve terminals. levels from a point source in retinal slices and cultured astrocytes
If astrocytes are activated through release from nerve termi- (Guthrie et al., 1999; Newman, 2001b; Koizumi et al., 2003). We
nals, then which transmitter is responsible? In a series of experi- next tested the hypothesis that the spread of astrocyte activation
ments, we applied trains of stimuli in the center of the field of evoked by electrical stimulation in the center of the field of view
view (313 by 208 m) and imaged Ca changes in s.r. astrocytes
2⫹ was attributable to ATP acting on astrocyte P2Y receptors and/or
(Fig. 9) (movies in supplemental material, available at www. glutamate acting on metabotropic glutamate receptors. The peak
jneurosci.org). Under these conditions, astrocyte Ca 2⫹ increases ⌬F/F for astrocyte Ca 2⫹ increases in the antagonists or under
were measured in surrounding astrocytes (Fig. 8 A) up to ⬃200 control conditions was similar (Fig. 9E) but significantly briefer
m from the stimulating electrode. As alluded to earlier, the in the presence of PPADS (10 M) and MRS2179 (30 M) than inBowser and Khakh • ATP Excites Interneurons J. Neurosci., September 29, 2004 • 24(39):8606 – 8620 • 8615
peak ⌬F/F (41 astrocytes, 7 slices) (Fig.
9 D, E), and cotreatment with PPADS
completely blocked evoked astrocyte acti-
vation in 95% of cells (3 of 55 astrocytes
from 9 slices still responded). From these
data, we suggest that the triggering stimu-
lus to astrocytes is likely to be vesicular re-
lease of glutamate and ATP from presyn-
aptic terminals in s.r. This is readily seen in
the representative traces in Figure 9D, av-
eraged data in Figure 9E, and was further
quantified by integrating the area under
the Ca 2⫹ transients (Fig. 10 D). In the
most straightforward explanation, the as-
trocyte signal appears to be propagated by
a mixture of glutamate acting on astro-
cytes within 100 m of the stimulus and by
ATP to more distant astrocytes (200 m)
(Fig. 10 E).
Endogenous activation of P2Y receptors
on astrocytes increases
synaptic inhibition
If endogenous ATP activates astrocyte
P2Y receptors over ⬃200 m distance
scales (Figs. 9, 10), then does this affect
inhibitory synaptic activity onto inter-
neurons? To address this, we monitored
the frequency of spontaneous IPSCs in
30 sec windows before and after electri-
cal stimulation using conditions identi-
cal to those that caused excitation of as-
trocytes (Figs. 9, 10). We expressed the
data as the ratio of the number of IPSCs
before and after stimulation (the facili-
tation ratio) (Fig. 11 A, B) under control
conditions and during pharmacological
treatments to affect ATP signaling. The
facilitation ratio was significantly re-
Figure 9. Astrocyte Ca 2⫹ transients evoked by electrical stimulation (stim). A, B, Confocal images of fluo-4-AM-loaded duced when P2Y receptors were blocked
hippocampal slices 30 sec before field stimulation and 10 and 30 sec after stimulation under control conditions ( A) and in the with PPADS at 23°C (Fig. 11 Bi) (1.06 ⫾
presence of 30 M PPADS ( B). The position of the stimulating electrode is shown on a grid of 25 m spacing. C, Example Ca 2⫹
0.04 to 0.84 ⫾ 0.04; n ⫽ 10; p ⬍ 0.05)
traces for two astrocytes (i, ii indicated in A, B) and the distances from the stimulating electrode under control conditions and in the
2⫹
presence of PPADS. D, Ten superimposed traces showing change in intracellular Ca for astrocytes in control ( i), in the presence
and at the more physiological tempera-
of mGluR antagonists (ii), PPADS (iii), and both mGluR antagonists and PPADS (iv). Note that the transients are briefer in the ture of 34°C (Fig. 11 Bii) (1.11 ⫾ 0.06 to
presence of PPADS and completely blocked in the presence of both PPADS and the mGluR antagonists. Superimposed traces are 0.91 ⫾ 0.05; n ⫽ 7; p ⬍ 0.05). We also
also shown for slices treated with 20 U/ml apyrase ( v) and for experiments conducted at 34°C (vi). Average astrocyte transients for used complimentary approaches to
the indicated treatments are shown in E. block endogenous ecto-nucleotidases
with 6-N,N-diethyl--␥-dibromomethy-
lene-D-ATP (ARL67156) and therefore
control (Fig. 9 D, E). Furthermore, whereas in control slices, presumably increase extracellular ATP levels and used apyrase
Ca 2⫹ changes could be measured in astrocytes ⬃200 m from (20 U/ml) to cleave any released ATP. In experiments conducted
the stimulating electrode (Fig. 10 A, B) (supplemental material, at 34°C, ARL67156 significantly increased the facilitation ratio by
available at www.jneurosci.org), in the presence of PPADS and 25% (Fig. 11 Biii) (0.95 ⫾ 0.02 to 1.20 ⫾ 0.05; n ⫽ 8; p ⬍ 0.05). In
MRS2179, astrocytes only responded in a region half this size at experiments at 34°C, apyrase decreased the facilitation ratio in 9
⬃100 m (Figs. 9Bi,ii, 10 A, B) (supplemental material, available of 12 interneurons investigated (Fig. 11 Biv). Although the pooled
at www.jneurosci.org). Similar data were gathered from slices data from all 12 interneurons treated with apyrase did not reach
treated with extracellular apyrase (10 U/ml), a nucleotidase that is statistical significance ( p ⬎ 0.05), statistical significance was ob-
expected to hydrolyze any released ATP (Fig. 9D). The residual tained (from 1.11 ⫾ 0.01 to 1.02 ⫾ 0.01; n ⫽ 9; p ⬍ 0.05) by
astrocyte responses that remain in the presence of P2Y1 receptor removing the two experiments where the facilitation ratio in-
antagonists are likely caused by activation of group I metabo- creased. The variability in the effect of apyrase may be explained
tropic glutamate receptors (Porter and McCarthy, 1996). Consis- by the fact that it is a protein, for which penetration may vary
tent with this, treatment of slices with the group I mGluR antag- between slices and also because apyrase is expected to generate
onists MPEP and LY367358 (100 M) significantly reduced the ADP, a potent agonist of P2Y1 receptors (Zimmermann, 1999).You can also read