Black carbon and dust alter the response of mountain snow cover under climate change
←
→
Page content transcription
If your browser does not render page correctly, please read the page content below
Black carbon and dust alter the response of mountain snow cover under climate change Marion REVEILLET ( marion.reveillet@meteo.fr ) Univ. Grenoble Alpes, Université de Toulouse, Météo-France, CNRS, CNRM, Centre d’Etudes de la Neige, 38000 Grenoble, France https://orcid.org/0000-0001-9802-4649 Marie Dumont Météo-France - CNRS https://orcid.org/0000-0002-4002-5873 Simon Gascoin Centre d’Etudes Spatiales de la Biosphère (CESBIO), Université de Toulouse, CNRS/CNES/IRD/INRAE/UPS, 31400 Toulouse, France Matthieu Lafaysse Univ. Grenoble Alpes, Université de Toulouse, Météo-France, CNRS, CNRM, Centre d'Etudes de la Neige, Grenoble, France Pierre Nabat CNRM-GAME Aurélien Ribes Centre National de Recherches Météorologiques https://orcid.org/0000-0001-5102-7885 Ra fe Nheili Univ. Grenoble Alpes, Université de Toulouse, Météo-France, CNRS, CNRM, Centre d’Etudes de la Neige, 38000 Grenoble, France François Tuzet Univ. Grenoble Alpes, Université de Toulouse, Météo-France, CNRS, CNRM, Centre d'Etudes de la Neige, Grenoble Martin Menegoz University de GRenoble Samuel Morin Univ. Grenoble Alpes, Université de Toulouse, Météo-France, CNRS, CNRM, Centre d'Etudes de la Neige, Grenoble, France https://orcid.org/0000-0002-1781-687X Ghislain Picard Laboratoire de Glaciologie et Géophysique de l'Environnement, CNRS/Université Joseph Fourier de Grenoble Paul Ginoux National Oceanic and Atmospheric Administration
Article Keywords: snowmelt, water availability, snow cover decline Posted Date: September 9th, 2021 DOI: https://doi.org/10.21203/rs.3.rs-800501/v1 License: This work is licensed under a Creative Commons Attribution 4.0 International License. Read Full License
1     Black carbon and dust alter the response of mountain snow
2                    cover under climate change
3

 4    Marion Réveillet 1∗ , Marie Dumont 1∗ , Simon Gascoin 2 , Matthieu Lafaysse 1 , Pierre
 5   Nabat 3 , Aurélien Ribes 3 , Rafife Nheili 1 , Francois Tuzet 1 , Martin Ménégoz 4 , Samuel
 6                            Morin 3 , Ghislain Picard 4 , Paul Ginoux5
      1
 7        Univ. Grenoble Alpes, Université de Toulouse, Météo-France, CNRS, CNRM, Centre d’Etudes de la
 8                                          Neige, 38000 Grenoble, France
                   2
 9                   Centre d’Etudes Spatiales de la Biosphère (CESBIO), Université de Toulouse,
10                            CNRS/CNES/IRD/INRAE/UPS, 31400 Toulouse, France
                      3
11                      CNRM, Université de Toulouse, Météo-France, CNRS, Toulouse, France
                         4
12                         Univ. Grenoble Alpes, CNRS, IRD, IGE, 38000 Grenoble, France
           5
13           NOAA Geophysical Fluid Dynamics Laboratory, 201 Forrestal Road, Princeton, NJ 08540, USA

14
                 ∗
                     To whom correspondence should be addressed; E-mail: marion.reveillet@meteo.fr,
15                                             marie.dumont@meteo.fr

16           By darkening the snow surface, mineral dust and black carbon (BC) deposition en-
17           hances snowmelt and triggers numerous feedbacks. Assessments of their long-term
18           impact at the regional scale are still largely missing despite the environmental and

19           socio-economic implications of snow cover changes. Here we show, using numerical
20           simulations, that dust and BC deposition has advanced snowmelt by 17 days on average
21           in the French Alps and the Pyrenees over the 1979–2018 period, with major implica-

22           tions for water availability. We demonstrate that the decrease in BC deposition since
23           the 1980s moderates the impact of current warming on snow cover decline. Hence, ac-
24           counting for changes in light-absorbing particles deposition is required to improve the

25           accuracy of snow cover reanalyses and climate projections, that are crucial for better
26           understanding the past and future evolution of mountain social-ecological systems.

                                                          1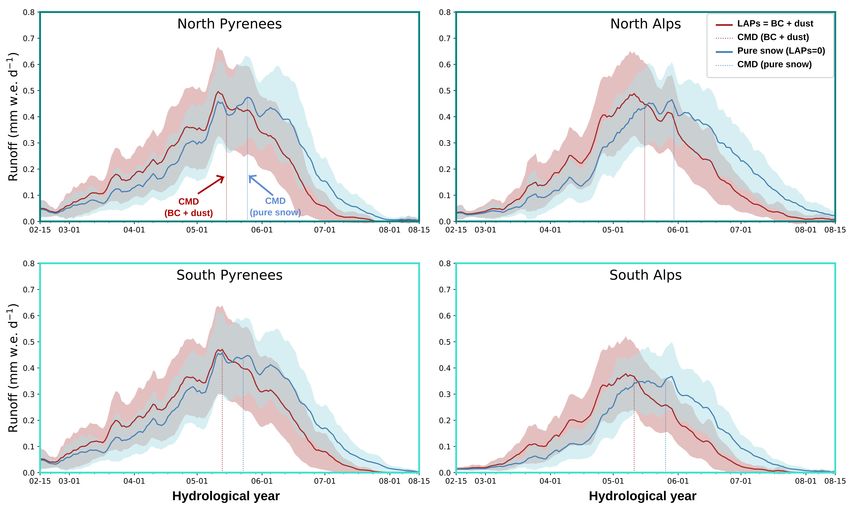
27       Snow cover changes have drastic consequences for numerous components of the Earth system such as
28   water resources (1,2), ecosystems (3,4) and the Earth climate through complex feedbacks (5). In response

29   to climate change, the snow cover duration in mountain areas has declined at the global scale since the
30   1950s, on average by 5 days per decade at low elevations (6, 7). As a response to snow cover decline and
31   enhanced snowmelt, the peak runoff from snowmelt has shifted by around 10 days on average over the

32   1965–2005 period for the Alps (8). Changes both in the magnitude and timing of the snowmelt runoff
33   threaten the availability of water resources in downstream regions, and in particular for irrigation (2).
34   Snow cover trends are mostly attributed to changes in atmospheric drivers, and especially to the warming

35   that intensified over the last decades to reach 0.3±0.2◦ C per decade for mountainous areas at global
36   scale (6).
37       Light-absorbing particles (LAPs) such as black carbon (BC), brown or organic carbon, mineral dust

38   and algae are potent drivers of snow cover changes (9–11). LAPs darken the snow surface when deposited
39   on the snow cover and amplify several snow-albedo feedback loops, drastically modifying the snow cover
40   evolution and duration (12). LAPs indeed accelerate the coarsening of the snow microstructure, leading to

41   more solar energy absorption and to an acceleration of the intrinsic snow albedo feedback (13). Moreover,
42   LAPs are partially retained at the snow surface during melt, amplifying the decrease in the albedo (14).
43   The impact of LAPs on the snow cover is, thus, modulated by meteorological conditions, leading to

44   complex interplays between the LAPs and the meteorological drivers of the snow cover evolution (5).
45       BC is the most efficient absorbing aerosol in the atmosphere (12, 15) and its deposition strongly im-

46   pacts snowmelt rates (12). In central Europe, an increase in BC deposition since 1850 has been observed
47   until the 1970s due to anthropogenic activities (16). It has been suggested that BC deposition contributed
48   to the triggering of glacier retreat in the Alps (16). However, BC deposition has decreased since the

49   1980s (17), due to a reduction of emissions likely related primarily to traffic emission decrease (18).
50   However, the impact of this recent negative trend on snow cover has not been quantified hitherto.
51       Even if mineral dust deposition events are generally more episodic than BC deposition (19, 20), they

52   can have a widespread visible impact on the snow surface (e.g. in Feb. 2021, (21)), with a prevailing
53   radiative effect compared to BC (19, 22). In Europe, mountain ranges are generally affected by dust
54   deposition events originating from the Sahara, which contribute to 50–70% of the total annual dust de-

                                                         2
55 position (23). Yet, the strong spatial and temporal variability combined with the lack of long-term data
56 make it difficult to identify trends over the last decades (24).
57 Regional assessments of the combined effect of LAPs deposition on snow cover changes over long
58 time periods are currently missing (6, 12). Here, we quantify the combined effect of BC and dust deposi-
59 tion on snow cover dynamic and trends at the regional scale of the French Alps and Pyrenees mountain
60 ranges, for the 1979–2018 period. Considering the large uncertainty in brown carbon deposition and
61 absorption efficiency (12), the effect of brown carbon is excluded from the analysis as well as the effect
62 of algae that generally bloom only at high elevation and late in spring (25). Our analysis is based on
63 numerical simulations performed with the detailed snow cover model Crocus accounting for the complex
64 interactions between LAPs and snow (26).
65 Results
66 Simulations explicitly accounting for dust and BC deposition fluxes are compared to a pure snow sim-
67 ulation, excluding any LAP. Simulations are driven by the meteorological reanalysis S2M (27) and BC
68 and dust deposition fluxes from the regional climate model CNRM-ALADIN63 driven by reanalysis data
69 (so as to follow the unfolding of observed meteorological conditions) (28). To quantify the impact of BC
70 and dust on snow cover evolution we used the snow melt-out date (SMOD), defined as the last date of
71 the annual longest period with at least 30 cm of snow. This indicator is relevant for water resources and
72 ecosystem impacts of the seasonal snow cover (6). The snow cover simulations were evaluated against
73 satellite observation of the snow cover area and in situ observations of melt rates using 495 stations mea-
74 suring snow depth (See Methods). Simulations accounting for BC and dust systematically lead to better
75 scores compared to pure snow simulations.
76 Shortening of the season due to BC and dust
77 The comparison of the pure snow simulations with the simulations accounting for BC and dust show
78 that, by darkening the snow surface, the combined effect of BC and dust leads to an earlier snow melt-
79 out date (SMOD) by 17.8 and 16.1 days on average in the French Alps and Pyrenees, respectively, over
80 the 1979-2018 period (Fig. 1). These reductions correspond to 9.1 and 8.8% of the mean annual snow
381 cover duration. These averages are calculated accounting for the relative surface at each elevation bands
82 in both mountain ranges. The SMOD reduction varies from 0 to 47 days across the domain (Fig. 1).
83 Variations depend on the year (Supplementary Fig. S1), due to strong BC and dust variations over time
84 (Supplementary Fig. S2). Variations also depend on the area and the elevation. A larger absolute impact
85 of BC and dust on the SMOD in number of days is found at higher elevations. This is related to later melt
86 and longer snow season, where dust and BC are exposed to higher incoming solar radiation, amplifying
87 its effect on snowmelt acceleration (29).
88 The effect of BC is prevailing in the Northern part of the French Alps and Pyrenees, where higher BC
89 deposition is observed (Supplementary Fig. S2). The simulated SMOD when accounting only for BC
90 is earlier on average by 14.2 days (7.1%) in the Northern Alps and by 13.3 days (6.9%) in the Southern
91 Alps, compared to the pure simulation. The Southern parts of both mountain ranges are more exposed
92 to Saharan dust deposition (Supplementary Fig. S2), and exhibit larger dust deposition amounts than
93 the Northern parts. However the effect of dust deposition is prevailing only at higher elevation in the
94 Southern parts where the snow cover melts earlier by 3.7 days (1.9%) on average when accounting for
95 dust only than when accounting for BC only.
96 Figure 1 also shows the SMOD reduction between the pure snow simulation and a simulation named
97 ”baseline” that accounts only implicitly for the LAPs by decreasing albedo as a function of time since
98 the last snowfall without any link to the actual LAP concentration. This simple treatment of the radiative
99 impact of LAPs, only represented by a darkening of the surface snow over time, is the most common
100 practice in snow modeling (30) but has the disadvantage of neglecting spatial or temporal variations of
101 the LAPs deposition fluxes (see Methods). The simulated SMOD in the baseline configuration is later
102 compared to the explicit simulation on averaged by 7.3 days for the Alps and 9.3 days for the Pyrenees
103 (Fig. 1). This suggests that the temporal and spatial variability of the BC and dust deposition fluxes likely
104 has an important effect on the snow cover duration.
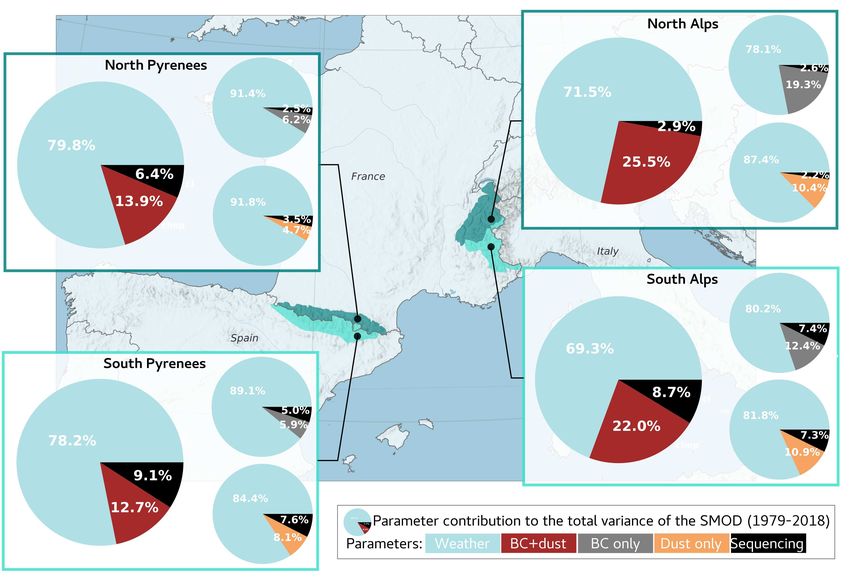
105 BC and dust effect on snow cover inter-annual variability
106 Based on an analysis of the variance (ANOVA, (31), Method and Supplementary text), we quantify the
107 contribution of the different atmospheric drivers to the SMOD inter-annual variability (see Methods).
108 The combined effect of the BC and dust explains up to 30.7% of the variance of the SMOD at 2100 m
4109 a.s.l. in the Alps (Fig. 2, total variance of 329 d2 ) and up to 21.8% in the Pyrenees (for a total variance
110 of 578 d2 ) .
111 BC and dust contributions depend on the meteorological conditions (32). For instance, the same
112 amount of BC and dust deposited at the snow surface has a stronger impact if a large time period between
113 two snowfalls occurs, than when a snowfall occurs immediately after the deposition. To evaluate this
114 effect we separate the contribution of the BC and dust only to the total variance (named the additive
115 part) and the contribution of BC and dust that cannot be separated from the meteorological conditions
116 (named the sequencing part). This sequencing of meteorological conditions and BC and dust deposition
117 contributes to 2.9 – 9.1% to the total variance, while the additive part contributes to 12.7 – 25.5% of the
118 total variance (Fig. 2). These results indicate a marked contribution of BC and dust to the variance of the
119 SMOD that depends on the meteorological conditions especially in the Southern mountain ranges.
120 The BC and dust contribution to the SMOD inter-annual variability is larger in the Alps than in the
121 Pyrenees, mostly related to a higher contribution of the BC deposition. BC deposition contributes to 19.3
122 and 12.4% to the total variance of the SMOD for the Northern and Southern Alps, and to 6.2 and 5.9% for
123 the Northern and Southern Pyrenees, respectively. BC contribution to the SMOD inter-annual variability
124 is generally higher than dust contribution, except for the Southern Pyrenees, more affected by episodic
125 dust outbreaks (33).
126 In summary, our results show that BC and dust are significant drivers of the SMOD inter-annual
127 variability. The calculation of their contribution has been performed on the 39 years time series without
128 detrending and thus including the effects of atmospheric trends, such as trends in air temperature and BC
129 and dust deposition, over this period.
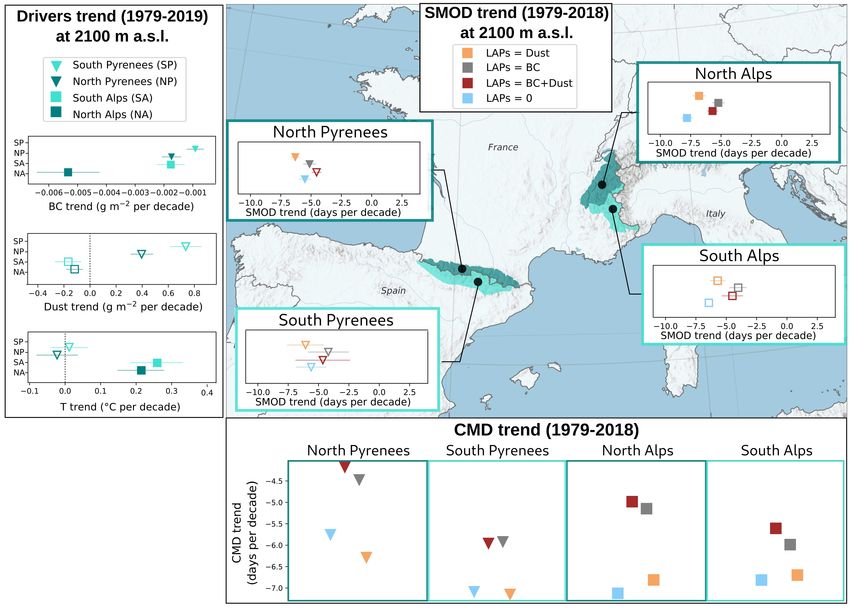
130 Past trends (1979–2018)
131 The simulated SMOD for pure snow (without considering the BC and dust effect) follows a negative
132 trend over the last decades (1979–2018) indicating earlier snowmelt (Fig. 3). For instance, the SMOD
133 decrease at 2100 m a.s.l. is 7.8 days per decade (corresponding to a 4.0% shorter snow season) for the
134 Northern Alps and 6.4 days per decade (4.0%) for the Southern Alps. This decrease is consistent with
135 the positive trend in air temperature. According to the reanalysis data used in this study, significant
136 temperature trends range from 0.1 to 0.3◦ C per decade (Fig. 3). The SMOD decreasing trend simulated
5137 in the Pyrenees is smaller than in the Alps and consistent with the trend in air temperature.
138 The trend in simulated BC deposition over the winter period for the last decades (1979–2018) is
139 negative (Fig. 3), with a decrease of 11% on average considering all the massifs. Simulations accounting
140 for BC deposition leads to a negative SMOD trend lower than the SMOD trend of the pure snow case
141 (Fig. 3). For instance, the SMOD decrease at 2100 m a.s.l. is of 5.2 days per decade for the Northern Alps
142 (corresponding to a decrease of 2.6% of the snow season duration), 4.0 for the Southern Alps (2.5%). This
143 means that, at the beginning of the study period (1979–1988), the shortening attributed to BC deposition
144 alone (i.e. 15 days on average for all the areas) is higher than for the recent period (2009–2018) (i.e. 10
145 days only in average). Thus, reduced BC deposition fluxes partly offset the effect of rising temperature
146 because less BC on the snow surface decreases melting rates by reducing solar energy absorption.
147 Conversely, no significant trend in dust deposition is identified (Fig 3). Dust deposition consequently
148 does not significantly affect the SMOD trend. The decrease in SMOD trend from simulations accounting
149 for both BC and dust deposition is thus, due to the decrease in BC deposition since the 1980s. This
150 decrease compensates part of the impact of warming on the trend of the snow cover duration at 2100 m
151 a.s.l. and is observed for all the Alps and Pyrenees (Supplementary text and Fig. S3) However, trends
152 presented in this section originate from one model and the limitations are therefore discussed below.
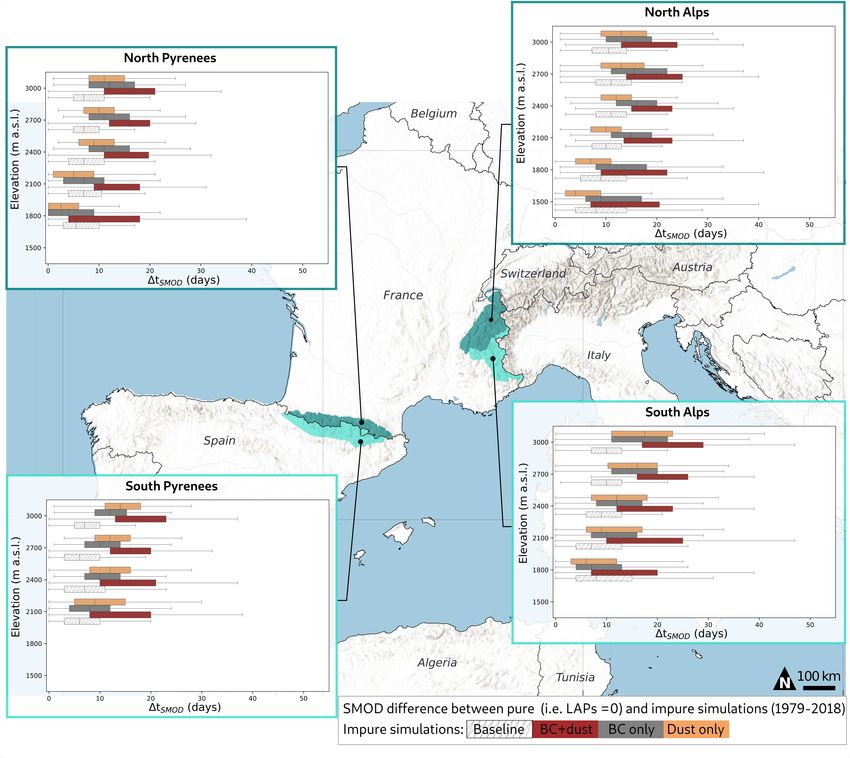
153 Impacts on mountain hydrology
154 By exerting a strong control on the snow cover ablation rate, BC and dust deposition also has a profound
155 influence on melt water runoff. To quantify this effect, we use the Center of Mass Date (CMD), defined
156 as the date for which half of the total annual runoff from snowmelt is reached (34). BC and dust lead to
157 a shift in the simulated CMD by up to 15 days earlier in the season (Fig. 4) over the 1979-2018 period
158 compared to pure snow simulations. The effect is larger in the Alps (CMD shift of 15 days for the Alps)
159 than for the Pyrenees (CMD shift of 10 days) in agreement with the larger effect on snow cover duration
160 in the Alps mentioned above. No significant change in the intensity of the peak runoff can be attributed
161 to the presence of BC and dust (Fig. 4). Even if the magnitude of the peak runoff is preserved, earlier
162 snowmelt can have a profound consequences on the management of the water resource and downstream
163 alpine ecosystems (35). The combined effect of BC and dust explains up to 5.4 days of the CMD variance
164 (37% of the total variance, Supplementary Fig. S4). This is in agreement with the contribution of BC
6165 and dust found for the SMOD variance with a prevailing contribution of BC deposition on the Northern
166 ranges and dust deposition in the Southern ranges. The observed changes in the timing of the peak runoff
167 attributed to climate change over the 1965–2005 period are of around 10 days for the Alps (8). The
168 simulated CMD shift of 10 to 15 days attributed to the presence of BC and dust here is thus comparable
169 in magnitude.
170 Finally, our results indicate that the shift of the CMD due to warming would be stronger if not com-
171 pensated by a decrease in BC deposition over the 1979–2018 period (Fig. 3). When considering only BC
172 deposition, the trend in CMD would decrease by 1.3 days per decade on average, with a larger impact (of
173 2 days per decade) in the Northern Alps, explained by a stronger negative trend in BC deposition (Fig.
174 3).
175 Relevance and implications
176 This study analyses the impact of dust and BC deposition on seasonal snow cover variability and trends in
177 the French Alps and Pyrenees, using regional meteorological and deposition reanalysis and the detailed
178 snow cover model Crocus. We demonstrate that BC and dust have a major role in advancing the snow
179 cover melt, with a strong influence on the inter-annual variability of the snow cover and drastic implica-
180 tions for water availability timing. We also show that the response of the snow cover evolution to climate
181 change is strongly modulated by the BC and dust deposition fluxes, suggesting that trends in snow cover
182 and LAPs deposition cannot be investigated independently.
183 Our results also show that the impact of BC and dust on SMOD depends strongly on elevation,
184 in terms of their influence on snowmelt timing (Fig. 1) (29). Indeed when snow is melting later in the
185 spring (e.g., high elevation) more incoming shortwave energy is available, enhancing the radiative impact
186 of LAPs. However, these altitudinal variations are superimposed with regional contrasts in the controlling
187 factors of SMOD changes. The BC and dust deposition leads to larger effect on snow cover duration in
188 the Alps compared to the Pyrenees directly related to higher BC deposition in the Alps (Supplementary
189 Fig. S2). The relative impact of dust compared to the one of BC is higher for the South Pyrenees than
190 for the Alps. This is explained by the regional patterns of African dust deposition that decreases with
191 the distance to the North African coasts according to a south-north gradient (33) and by the general
7192 predominance of African over local sources in the total dust load (36). We can thus expect similarly large
193 regional contrast in the impact of LAPs on snow cover in other mountainous regions.
194 Strong regional and altitudinal contrasts in BC and dust deposition has also been found for other
195 mountain ranges as recently evidenced in High Mountain Asia (22). They showed a prevailing of dust
196 effect on snowmelt at high elevation, especially in the Western regions. The BC and dust load is about
197 twice higher in these areas than in the Alps and the Pyrenees. The snow cover duration shift induced by
198 BC and dust in High Mountain Asia is thus likely higher than the 17 days reported in our study for the
199 French Alps and Pyrenees.
200 Similarly strong regional contrasts arise in the trends of BC and dust deposition. Negative trends
201 in BC deposition has been observed since the 1980s in Europe but also in North America and in the
202 Arctic (37, 38). In contrast, positive trends have been reported in Asia, Oceanic regions and Antarctica
203 (37). Such positive trends may result in enhancing the effect of global warming on snow cover duration.
204 Regarding dust deposition, no trend is evidenced for most of the mountain regions, partly due to the strong
205 annual variability of dust deposition and the limited record duration (24). However, a positive trend in
206 deposition was observed in the Caucasus likely due to increasingly dry conditions in North Africa and
207 the middle East (39). As exemplified in our study, these regional contrasts in deposition trend modulates
208 the regional response of the snow cover to climate change.
209 Limitations
210 Atmospheric and snow cover trends studied here originate from a single land surface mode driven by
211 a single one meteorological reanalysis (S2M). However, the snow cover trend from our simulations ac-
212 counting for BC and dust is in line with the observed trends in Alps and Pyrenees (7, 40–42) (see Meth-
213 ods). Besides, the results of our study are mostly based on relative differences between simulations and
214 not on absolute values, therefore mitigating the impact of uncertainties in the meteorological variables
215 and in the surface model. The trend in BC deposition originating from one atmospheric model reported
216 in this study is in agreement with the negative trend observed in Europe since the 80’s, as reported in
217 many studies (18, 43, 44), and in total conformity with the trend in BC deposition originating from the
218 atmospheric model GFDL-AM4 (45) (Supplementary Fig. S2).
8219 In this study, we considered only two types of LAPs, BC and dust, while other types may also con-
220 tribute to modify the radiative forcing on the snow cover. Brown carbon was excluded considering the
221 high uncertainty in atmospheric concentrations and optical properties estimates (12). Snow algae could
222 play an important contribution to snow cover in some regions such as Greenland (46) but their impact
223 on seasonal snow in the European Alps is not yet bounded and their impact is limited to the very end of
224 the snow season and for high elevations (typically above 2000 m a.s.l.) (25, 47). BC and dust are thus
225 assumed to hold the dominant role in accelerating snow melt. BC and dust optical properties vary consid-
226 erably (48, 49). The sensitivity to dust refractive index is investigated and the selected index in the study
227 results in median impact (Supplementary Fig. S5). The sensitivity of our results to this parameter points
228 out a need to better characterize the optical properties of Saharan dust after long-range transport and
229 deposition in snow. The absorption efficiency of BC is also prone to large uncertainties (50) especially
230 in snow (48) and is expected to impact our results. The absorption efficiency chosen here is a moderate
231 value between extremes found in the literature (32).
232 Bias might also originates from the choice of a scavenging coefficient of BC and dust with melt
233 water and from the choice of a given snow model. This was quantified using an ensemble approach
234 with 35 configurations of the snow model showing that the deterministic simulation presented here give
235 a slightly lower estimate of the impact of BC and dust on SMOD compared to the ensemble simulation
236 (Supplementary Fig. S6). However, both estimates are close and the temporal trend is conserved. Finally,
237 BC and dust in the atmosphere may lead to an atmospheric cooling before their deposition on the surface.
238 Further research would be required to investigate simultaneously the snow cover changes induced by the
239 deposition and the potential compensating effect of the particles in the atmosphere.
240 Concluding remarks
241 Our results demonstrate that BC and dust deposition advances the end of the snow season by 17 days
242 on average over the French Alps and the Pyrenees mountain ranges. This reduction shifts up to 15
243 days in the availability of water from snowmelt. This has potential environmental and socio-economic
244 impacts. The BC effect is generally prevailing over the dust effect, especially in the Northern part of the
245 massifs. BC deposition alone, shortens the snow season by 11 days on average, compared to pure snow
9246 simulations. However, the BC effect would be even larger without the decrease in deposition observed
247 since the 1980s. At the beginning of the study period (1979–1988), a shortening of 15 days is attributed
248 to BC deposition alone. On the contrary, for the recent period (2009–2018), the shortening due to BC
249 is of 10 days only on average. This emphasizes the key effect of changes in BC deposition on the snow
250 cover. Due to the current warming, the snow cover decline would be even more pronounced without the
251 opposing effect of the decrease in BC deposition since the 1980s. The future changes in BC deposition
252 related to human activities will therefore be of critical importance for the evolution of the snow cover
253 in the coming decades. Hence, past and future trends in snow cover and LAPs deposition cannot be
254 investigated independently. This is crucial to assess the future regional response of mountain hydrology,
255 water availability, and the future evolution of mountain social-ecological systems.
256 Methods
257 Site description and atmospheric forcing
258 Study sites: French Alps and Pyrenees
259 The study covers the French Alps and the Pyrenees mountain ranges. In the French Alps, most of the
260 mountains range between 300 and 3600 m a.s.l. with a maximum at the Mont-Blanc with 4810 m a.s.l..
261 In this study, the Alps are split into the Northern Alps, with elevation ranging between 1500 to 3000 m
262 a.s.l. and the Southern Alps with elevation ranging between 1800 to 3000 m a.s.l.. These elevation ranges
263 are selected as the ones fulfilling the condition of a mean simulated snow depth >30 cm over the winter
264 period (i.e., 1st of December to 30 of April), and considering all the winters over the 1979–2018 period.
265 Elevation above 3000 m a.s.l. were excluded because the meteorological forcing and the snow model
266 Crocus were not thoroughly evaluated int this context (see details below).
267 The Pyrenees mountain range covers distinct mountains located in France, Spain, and Andorra, and
268 most of them range between 300 and 3000 m a.s.l. with a maximum of 3404 m.a.s.l at the Aneto Peak
269 (Spain). In this study, the Pyrenees are divided between the Northern and the Southern Pyrenees. The
270 elevations selected, fulfilling the snow depth condition (i.e., an average larger than 30 cm for the winter
271 period) are from 1800 to 3000 m a.s.l for the Northern Pyrenees and from 2100 to 3000 m a.s.l. for the
272 Southern Pyrenees.
10273 S2M meteorological reanalysis
274 The S2M atmospheric reanalysis is built from the SAFRAN (Système d’Analyse Fournissant des Ren-
275 seignements Atmosphériques à la Neige) meteorological analysis system (27). SAFRAN data are based
276 on atmospheric vertical profiles simulated by an atmospheric model (ERA-40 reanalysis until 2001 and
277 ARPEGE numerical weather prediction model after 2002). These guesses are then corrected by opti-
278 mal interpolation with mainly observed surface meteorological data from various networks (automatic or
279 manual observations). SAFRAN do not assimilate any observation above 3000 m a.s.l..
280 SAFRAN outputs include hourly meteorological variables: 2 m air temperature and relative humidity,
281 precipitation amounts and phases, incoming direct and diffuse shortwave radiation, incoming longwave
282 radiation, wind speed, cloudiness. These data are assumed to be homogeneous within a given massif.
283 In SAFRAN geometry, the Alps and the Pyrenees are both divided into 23 massifs defined for their
284 climatological homogeneity (51). For each massif, meteorological data depends only on elevation (one
285 data point every 300 m) and and are considered for flat surfaces.
286 BC and dust deposition from CNRM-ALADIN63
287 BC and dust deposition fluxes are obtained from the regional climate model CNRM-ALADIN63 (28).
288 This model includes an interactive tropospheric aerosol scheme able to represent the main aerosol species
289 such as BC and dust in the troposphere. These aerosols are prognostic variables, subject to transport, dry
290 deposition and in-cloud and below-cloud scavenging. In this study, hourly output of dry and wet BC and
291 dust deposition fluxes were used, coming from a simulation over the 1979–2018 period driven by the
292 ERA-Interim reanalysis in order to ensure a realistic timeline of the evolution of aerosol deposition. This
293 simulations was carried out on a regional domain covering Europe, the Mediterranean Sea and Northern
294 Africa, at a 12 km horizontal resolution with 91 vertical levels. Data from this simulation have been
295 chosen as the study performed by (32) indicated a good agreement with the observations at the Col du
296 Lautaret (Alps, France).
297 Points covering the Alps and Pyrenees are extracted from this simulation, for the period 1979–2018,
298 and downscaled to obtain BC and dust forcing in SAFRAN geometry. For that purpose, for a given
299 massif, points located within the massif boundaries were selected. Between 5 to 10 points were selected,
11300 depending on the massif area. From these selected points, the hourly mean and the hourly altitudinal
301 gradient of each variable: dry and wet BC and dust deposition is computed. The hourly gradient is then
302 applied to the hourly mean to redistribute the data for each 300m steps in agreement with SAFRAN
303 geometry. Due to differences in precipitation timing between SAFRAN and CNRM-ALADIN63, and
304 to agree with SAFRAN atmospheric forcing data, hourly dry and wet deposition fluxes are added and
305 redistributed according to SAFRAN precipitation. Uncertainties of such approach are evaluated (see
306 Method limitations).
307 Snow cover simulations and evaluation
308 Simulations description
309 Simulations are performed with the detailed multilayer snowpack model SURFEX/ISBA-Crocus (52).
310 Crocus is a detailed snowpack model that includes, among others, dynamical layering, full description
311 of the surface energy balance, specific surface area, liquid water content as prognostic variable, snow
312 types, dry and wet snow metamorphism, and an explicit representation of LAPs (the number and types
313 are users defined) with a fully coupled spectral radiative scheme for solar radiation absorption inside the
314 snowpack at 20 nm spectral resolution (26). The radiative properties of dust and BC can be user-defined
315 either based on LAP refractive index or on LAP mass absorption efficiency (26, 32). In the present study,
316 dust is defined by the mass absorption efficiency from Caponi et al. (49) corresponding to dust PM2.5
317 from Libya in agreement with the study performed by Tuzet et al. (32). BC is defined from the constant
318 refractive index advised by Bond et al. (50) (i.e. m=1.910.79i). The MAE is then scaled to obtain an
319 MAE value at 550 nm of 11.25 m2 g−1 (53). The scaling makes it possible to implicitly account for the
320 potential absorption enhancement due to internal particle mixing or particle coating.
321 The model ran over the period 1979–2018, in a semi-distributed geometry (i.e., per 300m elevation
322 bands, for each massif, following the SAFRAN geometry). Contrary to some other applications of the
323 SAFRAN-Crocus system, we did not extend the simulations to different aspects and slopes. To investigate
324 the explicit effect of BC and dust on snow cover evolution, four configurations are set up: (i) pure
325 simulation with no LAP (Spure ), (ii) simulation considering BC and the dust deposition fluxes (SBC+Dust ),
326 (iii) simulation considering BC deposition only (SBC ) and (iv) a simulation considering dust deposition
327 only (SDust ). Furthermore, the original version of Crocus model (52) considers an implicit representation
12328 of LAPs. Indeed, the snow albedo decreases based on the snow age and therefore implicitly considers a 329 darkening of the snow surface. However this representation is not able to consider temporal variability 330 of the deposition. For model evaluation, simulations (Sbaseline ) performed with this version are compared 331 to the one allowing an explicit representation of BC and dust (i.e., SBC+Dust ). 332 Evaluation 333 1. Using satellite images 334 For each massif, the simulated snow cover area (SCA) and the snow cover duration (SCD) are 335 compared to the MODIS snow product. MOD10A1 (Terra) and MYD10A1 (Aqua) snow products 336 are downloaded from the National Snow and Ice Data Center (54, 55) for the period 2000–2016. 337 The binary snow products are projected on a 500 m resolution grid in the same coordinate system 338 as the DEM. Missing values, mainly due to cloud obstruction, are interpolated using a stepwise 339 gapfilling algorithm that was evaluated in the Pyrenees (56).The simulated snow depth is projected 340 on the same 500 m DEM resolution. Then, a threshold of 0.03 m is used to convert the simulated 341 snow depth into snow presence or absence for each grid cell (56)). By comparing the simulated and 342 the observed SCA, results indicate high correlations (R2 >0.75) and low RMSE (i.e.,
353   Strategy of BC and dust contribution quantification

354     1. On the snow cover duration
355        First, the snow melt-out date (SMOD), defined as the last date of the longest period with at least

356        30cm of snow is computed for each simulation. Then, to quantify the impact of BC and dust on
357        the shortening of the season, the SMOD differences between Spure and SBC+Dust are computed
358        for each massif, elevations, and years. The differences (i.e., ∆SM OD ) are given by elevation and

359        locations (Fig. 1), and the spread corresponds to the annual variability. The differences are also
360        quantified for the simulation between Spure and SBC and SDust to evaluate the influence of BC and
361        dust deposition on the snow cover duration separately (Fig. 1) Finally, differences between Spure

362        and Sbaseline are also shown.

363     2. On the annual variability of the snow cover
364        A statistical approached based on the variance analysis (ANOVA) is used to evaluate the contri-
365        bution of the BC and dust on the SMOD annual variability. The detailed method is described in

366        Geoffroy et al. (31) (following the Eq. reported in the Supplementary text). Here, the contribution
367        of the two parameters ”meteorological forcing” and ”BC+Dust” to the SMOD variance is computed
368        (Fig. 2).

369     3. On the trend in snow cover

370        The trends in meteorological forcing (temperature and solid precipitation), BC and dust, are com-
371        puted over the 1979–2018 period, and a Student test (t-test with a 0.05 confidence interval) is
372        applied to evaluate the significance. The trends in simulated snow cover (SMOD) and CMD of

373        Spure and SBC+Dust are quantified following the same method (Fig. 3). Then, for each year, the
374        SMOD differences between Spure and SBC+Dust (and also SBC and SDust separately) is computed,
375        in order to obtain a dataset (39 years) from these differences. The trend of this dataset is then

376        computed and its significance is evaluated following the t-test with a 0.05 confidence interval. This
377        method allows to evaluate the significance of the impact of the BC and dust on the trend.

                                                         14
378 Hydrological impacts
379 To evaluate the impact of BC and dust on the hydrology, the center of mass date (CMD) of the runoff
380 from snowmelt is computed for each simulation. The CMD is defined as the date for which 50% of the
381 total annual runoff from snowmelt is reached (34). The simulated runoff from snowmelt by Crocus is
382 projected on a 500 m DEM for the Alps and the Pyrenees. The Northern and Southern Alps and the
383 Pyrenees are considered as four distinct catchments and the total runoff is computed for each catchment
384 for the 39 years. The mean with the standard deviation (indicating to the temporal variability) is computed
385 for each catchment considering pure simulations and simulations accounting for BC and dust, to evaluate
386 the impact of the BC and dust on the runoff amount and timing (Fig. 4). Then, the impact of BC and
387 dust on the annual variability of the CMD is evaluated following the same method as for the snow cover
388 described above (Supplementary Fig. S4). The same method as for the snow cover is also applied to
389 evaluate the impact of the BC and dust on the CMD trends (Fig. 3).
390 Method limitations
391 Forcing uncertainties
392 1. Trends
393 As atmospheric and snow cover trends studied here, originate from only one surface model forced
394 with only one meteorological reanalysis (S2M), comparisons to other models and observations are
395 required to reinforce our conclusions. All climatological reconstructions are affected by irreducible
396 uncertainties in the obtained trends due to the temporal heterogeneities of the number and quality of
397 the data upon which they rely. In particular, Vidal et al. (58) demonstrate that the heterogeneities
398 of available temperature measurements can significantly affect local temperature trends in S2M.
399 This limitation is expected to be less important when considering large scale signals as in this pa-
400 per. However, Beaumet et al. (59) and Ménégoz et al. (60) revealed some large scale differences
401 in temperature and precipitation trends between S2M analyses and the Regional Climate Model,
402 MAR, forced by ERA20C reanalysis at the boundaries but not assimilating any observation inside
403 the simulation domain. Similar discrepancies were obtained in Switzerland by Scherrer and Kot-
404 larski (61) comparing similar products between S2M and another atmospheric model. However,
15405 the snow cover trend from our simulations accounting for BC and dust is in line with the observed
406 trends. In our simulations, the SMOD trend in the Northern Alps at around 1500 m a.s.l is -4.0±0.6
407 days per decade, comparable to the trend observed at Col de Porte (-4.1 days per decade, 1325 m
408 a.s.l., 1960-2018) (40). In addition, the averaged trend of -5.3±0.6 days per decade (3.0%) sim-
409 ulated for the Northern Alps considering elevation ranging between 1500 and 2400 m a.s.l. is in
410 good agreement with an averaged earlier snowmelt of 5.7 days per decade observed at 11 stations
411 (covering elevations from 1139 to 2540 m a.s.l) in the Swiss Alps over the 1970–2015 period (41).
412 In a study based on 202 to 688 stations in the European Alps over the 1971–2019 period, the SCD
413 computed over the March-May season decreases by -7.8 to -0.7% depending on elevation (1000 to
414 3000 m a.s.l.) and orientation (North or South) (7). The mean relative change of 3.0% from our
415 simulations is within the range of this study. In the Pyrenees, the absence of significant trend of the
416 SMOD at 2100 m a.s.l. since 1980 is in agreement with the work of Lopez-Moreno et al. (42). Be-
417 sides, the results of our study are mostly based on relative differences between simulations and not
418 on absolute value, therefore mitigating the impact of uncertainties in the meteorological variables
419 and in the surface model.
420 2. SAFRAN reanalysis
421 In snow modeling, significant uncertainties are bought by the meteorological forcing (62). Uncer-
422 tainties in the SAFRAN meteorological reanalysis has been estimated by previous studies (63, 64)
423 and are highly variable in space. While air temperature biases have not been reported compared
424 to observations at different locations, radiatif and precipitation biases have been observed. For
425 instance, Queno et al. (57) reported a bias of the shortwave radiation reaching 25 %/ in the Pyre-
426 nees. Vionnet et al. (65) showed and under-estimation of precipitation amount in the Alps at
427 high elevation. To consider these uncertainties, ensemble methods on the meteorological forcing
428 are increasingly used. By applying this method, the simulated SMOD uncertainty can reach one
429 month (66). However, in our study, this impact of this uncertainty is minimized as our conclusions
430 are bases on relative differences between simulations.
431 3. BC and dust
432 BC and dust deposition used to force the snowpack model is from only one atmospheric model and
16433 could be taken with caution. Still, BC and dust deposition from CNRM-ALADIN63 have been
434 evaluated by Tuzet et al., (32) at the Col du Lautaret (French Alps) over two snow season. They
435 showed that compared to the radiative forcing and BC and dust content at the snow surface, sim-
436 ulated deposition from CNRM-ALADIN63 performs really well (R2 =0.78 between the simulated
437 and measured absorption and no significant bias are observed between the modeled specific surface
438 area and the measurements). In addition, annual BC deposition and trend from CNRM-ALADIN63
439 is in total agreement with BC deposition modeled by GFDL-AM4 (45, 67) (Supplementary Fig.
440 S2). While dust load from CNRM-ALADIN63 are higher than the one from GFDL-AM4, both
441 model indicate no significant trend in dust deposition over the period 1980–2014.
442 The BC and dust downscaling method is also prone to uncertainties. Different approaches are
443 therefore been tested. Firstly, we tested the impact of the number of points selected in each mas-
444 sif with and without considering a weight depending on the point location using the downscaling
445 methodology. Results do not lead to significant differences in total BC and dust deposition (differ-
446 ences lower than 5% ) when computing this deposition with a different number of points selected
447 for a given massif. Second, another method to compute the altitudinal gradient, used to redistribute
448 the BC and dust deposition, is tested. This gradient is computed using the concentration profiles
449 of the BC and dust in the atmosphere instead of the BC and dust deposition. With the hypothesis
450 that the atmospheric profile is conserved for the altitudinal variation of the deposition, the monthly
451 gradient is computed from the monthly data of the BC and dust concentration profile available. In
452 this case, dry and wet deposition cannot be separated and the gradient is relatively homogeneous
453 for all the locations. The maximum difference in BC and dust deposition between the two methods
454 is 30% for the BC and 45% for the dust deposition. This method hasn’t been chosen due to the
455 unrealistic homogeneous gradient obtained. Finally, the dry and wet distribution method following
456 the SAFRAN precipitation events can be questionable. A sensitivity test by performing a simu-
457 lation considering all the fluxes as dry deposition indicated a mean difference lower than one day
458 (with a maximum of 4 days observed at highest elevations) compared to the simulation performed
459 with the method described in this study. Larger differences are observed when considering all the
460 fluxes as wet deposition where a maximum of -15 days is observed at the highest elevation with a
17461 mean of 4 days. Yet, this uncertainty is lower than the SMOD differences calculated related to the
462 effect of BC and dust on the snow cover duration.
463 Model uncertainties
464 1. Optical properties of BC and dust
465 The choice of dust refractive index and mass absorption coefficients also implies some uncertain-
466 ties. In this study, value for Saharan Libya PM2-5 (49) are chosen: a mass absorption efficiency at
467 400 nm of 110 10−3 m2 g−1 and a dust Angstorm exponent equal to 4.1. This choice was made as
468 Saharan dust is the primary source of dust deposition in European mountainous areas and as Tuzet
469 et al. (32) demonstrated based on spectral reflectance measurements that this spectral signature
470 agrees well with the measured spectrum for two winter seasons. However, this spectral signature
471 is expected to vary significantly with the source location which varies over time. Simulations per-
472 formed by changing this spectral signature, with a mass absorption efficiency at 400nm ranging
473 between 27 10−3 m2 g−1 (corresponding to the source Sahel – Bodélé PM10) and 630 10−3 m2
474 g−1 (for dust PM2-5 from Sahel – Mali). The Angstorm exponent is equal to 3.3 (Bodélé) and 3.4
475 (Mali). This sensitivity study allows quantifying the uncertainty related to the spectral signature
476 chosen (Supplementary Fig. S5). Depending on this calibration, the median of the ∆SMOD at
477 2100 m a.s.l. vary between 15 to 25 and 12 to 23 for the North and South Alps respectively, and
478 between 11 to 20 and 10 to 21 for the North and South Pyrenees respectively. The median of the
479 ∆SMOD with the spectral signature chosen in this study is closer to the lower median (i.e. 19
480 (15) for the North (South) Alps and 13 for both the North and South Pyrenees), suggesting that the
481 effect of dust reported in this study might be under-estimated, especially for Saharan event from lo-
482 cation close to Mali. Finally, additional uncertainties are also associated with the modelling of BC
483 absorption efficiency in snow. Indeed, the evolution of this parameter are still poorly understood
484 with variations of at least a factor 2 reported in the literature (e.g. Tuzet et al. (48) and references
485 therein).
486 2. Scavenging of BC and dust
487 In this study the scavenging of impurities in the snowpack was not considered (32). Indeed, the lack
18488 of quantitative observations of LAPs percolation at the snow surface in presence of melt water does
489 not allow a proper evaluation of this effect. Moreover, Crocus percolation schemes are quite simple
490 and are expected to be entached with many uncertainties. A sensitivity test has nevertheless been
491 performed, allowing 20% of the BC (5% of the dust) to scavenged with the water percolation (26).
492 This leads to a negligible effect (i.e. a median of the ∆SMOD variation at 2100 m a.s.l. of 2 days
493 for the North Alps and 1 day for the South Alps).
494 3. Representation in snow physics
495 Large uncertainties remain also in the representation of the snow physics, and Skiles and Painter
496 (68) quantified a SMOD difference around 30 days depending on the complexity of the snow model
497 chosen (degree-day snow model vs detailed snow model). Using an ensemble approach considering
498 35 different state-of-the art parameterisations in Crocus, Dumont et al. (29) indicates a SMOD
499 variation around 5 days, highlighting the uncertainty related to the selected snow physic in the
500 model. In this study, we quantified the model uncertainty using and ensemble approach considering
501 35 different state-of-the art parameterisations in Crocus (69) to simulate the delta SMOD at 2100
502 m a.s.l. (Supplementary Fig. S6). Uncertainties related to model physic choice and location (i.e.
503 box plot size of the ensemble simulations) is within the same range than the location uncertainty
504 (i.e. the box plot size of the deterministic simulation in Supplementary Fig. S6).
505 4. Geometry of the simulations
506 Simulations are performed in a semi-distributed geometry only considering a flat aspect. This is
507 because the slope and aspect represent a huge amount of additional data, complex to be considered
508 in the simulations. Still, with a simulation considering the slope and aspect, we expect a higher
509 impact of the BC and dust deposition on the snowpack evolution for southern slopes compared
510 to flat areas (and the opposite for the Northern slopes). Southern slopes are indeed exposed to
511 considerably higher solar radiation.
19512 References
513 1. Barnett, T. P., Adam, J. C. & Lettenmaier, D. P. Potential impacts of a warming climate on water
514 availability in snow-dominated regions. Nature 438, 303–309 (2005).
515 2. Mankin, J. S. & Diffenbaugh, N. S. Influence of temperature and precipitation variability on near-term
516 snow trends. Climate Dynamics 45, 1099–1116 (2015).
517 3. Ernakovich, J. G. et al. Predicted responses of arctic and alpine ecosystems to altered seasonality
518 under climate change. Global Change Biology 20, 3256–3269 (2014).
519 4. Hoegh-Guldberg, O. et al. Impacts of 1.5 c global warming on natural and human systems. Global
520 warming of 1.5 C. An IPCC Special Report (2018).
521 5. Flanner, M. G., Shell, K. M., Barlage, M., Perovich, D. K. & Tschudi, M. Radiative forcing and albedo
522 feedback from the northern hemisphere cryosphere between 1979 and 2008. Nature Geoscience 4,
523 151–155 (2011).
524 6. Hock, R. et al. High mountain areas: Ipcc special report on the ocean and cryosphere in a changing
525 climate (2019).
526 7. Matiu, M. et al. Observed snow depth trends in the european alps: 1971 to 2019. The Cryosphere 15,
527 1343–1382 (2021).
528 8. Hartmann, D. et al. Observations: Atmosphere and Surface, book section 2, 159–254 (Cam-
529 bridge University Press, Cambridge, United Kingdom and New York, NY, USA, 2013). URL
530 www.climatechange2013.org.
531 9. Wiscombe, W. J. & Warren, S. G. A model for the spectral albedo of snow. i: Pure snow. Journal of
532 Atmospheric Sciences 37, 2712–2733 (1980).
533 10. Painter, T. H., Skiles, S. M., Deems, J. S., Brandt, W. T. & Dozier, J. Variation in rising limb of
534 colorado river snowmelt runoff hydrograph controlled by dust radiative forcing in snow. Geophysical
535 Research Letters 45, 797–808 (2018).
20536 11. Warren, S. G. Light-absorbing impurities in snow: a personal and historical account. Frontiers in
537 Earth Science 6, 250 (2019).
538 12. Skiles, S. M., Flanner, M., Cook, J. M., Dumont, M. & Painter, T. H. Radiative forcing by light-
539 absorbing particles in snow. Nature Climate Change 8, 964–971 (2018).
540 13. Dumont, M. et al. Contribution of light-absorbing impurities in snow to greenland’s darkening since
541 2009. Nature Geoscience 7, 509–512 (2014).
542 14. Sterle, K. M., McConnell, J. R., Dozier, J., Edwards, R. & Flanner, M. G. Retention and radiative
543 forcing of black carbon in eastern sierra nevada snow. The Cryosphere 7, 365–374 (2013). URL
544 https://tc.copernicus.org/articles/7/365/2013/.
545 15. Flanner, M. G., Zender, C. S., Randerson, J. T. & Rasch, P. J. Present-day climate forcing and
546 response from black carbon in snow. Journal of Geophysical Research: Atmospheres 112 (2007).
547 16. Painter, T. H. et al. End of the little ice age in the alps forced by industrial black carbon. Proceedings
548 of the national academy of sciences 110, 15216–15221 (2013).
549 17. Lim, S. et al. Black carbon variability since preindustrial times in the eastern part of europe recon-
550 structed from mt. elbrus, caucasus, ice cores. Atmospheric Chemistry and Physics 17 (2017).
551 18. Kutzner, R. D. et al. Long-term monitoring of black carbon across germany. Atmospheric Environ-
552 ment 185, 41–52 (2018).
553 19. Kaspari, S., Painter, T. H., Gysel, M., Skiles, S. & Schwikowski, M. Seasonal and elevational
554 variations of black carbon and dust in snow and ice in the solu-khumbu, nepal and estimated radiative
555 forcings. Atmospheric Chemistry and Physics 14, 8089–8103 (2014).
556 20. Di Mauro, B. et al. Mineral dust impact on snow radiative properties in the european alps combining
557 ground, uav, and satellite observations. Journal of Geophysical Research: Atmospheres 120, 6080–
558 6097 (2015).
559 21. Réveillet, M. et al. Dépôts massifs de poussières sahariennes sur le manteau neigeux dans les Alpes
560 et les Pyrénées du 5 au 7 février 2021 : Contexte, enjeux et résultats préliminaires Version du 3
21561 mai 2021. Technical Report, CNRM, Université de Toulouse, Météo-France, CNRS (2021). URL
562 https://hal.archives-ouvertes.fr/hal-03216273.
563 22. Sarangi, C. et al. Dust dominates high-altitude snow darkening and melt over high-mountain asia.
564 Nature Climate Change 10, 1045–1051.
565 23. Ginoux, P. et al. Sources and distributions of dust aerosols simulated with the gocart model. Journal
566 of Geophysical Research: Atmospheres 106, 20255–20273 (2001).
567 24. Chedin, A., Capelle, V. & Scott, N. Detection of iasi dust aod trends over sahara: How many years
568 of data required? Atmospheric Research 212, 120–129 (2018).
569 25. Di Mauro, B., Garzonio, R. & Baccolo, G. e. a. Glacier algae foster ice-albedo feedback in the
570 european alps. Scientific Reports 10 (2020).
571 26. Tuzet, F. et al. A multilayer physically based snowpack model simulating direct and indirect radiative
572 impacts of light-absorbing impurities in snow. The Cryosphere 11 (2017).
573 27. Vernay, M. et al. The S2M meteorological and snow cover reanalysis in the French mountainous
574 areas (1958–present), Data set, AERIS (2019).
575 28. Nabat, P. et al. Modulation of radiative aerosols effects by atmospheric circulation over the
576 euro-mediterranean region. Atmospheric Chemistry and Physics 20, 8315–8349 (2020). URL
577 https://acp.copernicus.org/articles/20/8315/2020/.
578 29. Dumont, M. et al. Accelerated snow melt in the Russian Caucasus mountains after the Saharan dust
579 outbreak in March 2018. Journal of Geophysical Research: Earth Surface 125 (2020).
580 30. Essery, R., Morin, S., Lejeune, Y. & Ménard, C. B. A comparison of 1701 snow models using
581 observations from an alpine site. Advances in Water Resources 55, 131–148 (2013).
582 31. Geoffroy, O., Saint-Martin, D. & Ribes, A. Quantifying the sources of spread in climate change
583 experiments. Geophysical Research Letters 39 (2012).
22584 32. Tuzet, F. et al. Quantification of the radiative impact of light-absorbing particles during two con-
585 trasted snow seasons at col du lautaret (2058 m asl, french alps). The Cryosphere Discussions 1–38
586 (2020).
587 33. Vincent, J. et al. Variability of mineral dust deposition in the western mediterranean basin and
588 south-east of france (2016).
589 34. McCabe, G. J. & Clark, M. P. Trends and variability in snowmelt runoff in the western united states.
590 Journal of Hydrometeorology 6, 476–482 (2005).
591 35. Bard, A. et al. Trends in the hydrologic regime of alpine rivers. Journal of Hydrology 529, 1823–
592 1837 (2015).
593 36. Pey, J. et al. Snow impurities in the central pyrenees: From their geochemical and mineralogical
594 composition towards their impacts on snow albedo. Atmosphere 11, 937 (2020).
595 37. Ningombam, S. S. et al. Long-term (1995–2018) aerosol optical depth derived using ground based
596 aeronet and skynet measurements from aerosol aged-background sites. Atmospheric Pollution Re-
597 search 10, 608–620 (2019).
598 38. Sharma, S. et al. Widespread loss of lake ice around the northern hemisphere in a warming world.
599 Nature Climate Change 9, 227–231 (2019).
600 39. Kutuzov, S. et al. The elbrus (caucasus, russia) ice core record–part 2: history of desert dust deposi-
601 tion. Atmospheric Chemistry and Physics 19 (2019).
602 40. Lejeune, Y. et al. 57 years (1960–2017) of snow and meteorological observations from a mid-altitude
603 mountain site (col de porte, france, 1325 m of altitude). Earth System Science Data 11, 71–88 (2019).
604 URL https://essd.copernicus.org/articles/11/71/2019/.
605 41. Klein, G., Vitasse, Y., Rixen, C., Marty, C. & Rebetez, M. Shorter snow cover duration since 1970 in
606 the swiss alps due to earlier snowmelt more than to later snow onset. Climatic Change 139, 637–649
607 (2016).
23608 42. López-Moreno, J. et al. Long-term trends (1958–2017) in snow cover duration and depth in the
609 pyrenees. International Journal of Climatology (2020).
610 43. Sun, J. et al. Decreasing trends of particle number and black carbon mass concentrations at 16
611 observational sites in germany from 2009 to 2018. Atmospheric Chemistry and Physics 20, 7049–
612 7068 (2020).
613 44. Grange, S. K., Lötscher, H., Fischer, A., Emmenegger, L. & Hueglin, C. Evaluation of equivalent
614 black carbon source apportionment using observations from switzerland between 2008 and 2018.
615 Atmospheric Measurement Techniques 13 (2020).
616 45. Zhao, M. et al. The gfdl global atmosphere and land model am4. 0/lm4. 0: 1. simulation character-
617 istics with prescribed ssts. Journal of Advances in Modeling Earth Systems 10, 691–734 (2018).
618 46. Hoham, R. W. & Remias, D. Snow and glacial algae: A review1. Journal of phycology 56, 264–282
619 (2020).
620 47. Stewart, A. et al. Altitudinal zonation of green algae biodiversity in the french alps. Frontiers in
621 Plant Science 12, 1066 (2021).
622 48. Tuzet, F. et al. Influence of light-absorbing particles on snow spectral irradiance profiles. The
623 Cryosphere 13, 2169–2187 (2019).
624 49. Caponi, L. et al. Spectral-and size-resolved mass absorption efficiency of mineral dust aerosols in the
625 shortwave spectrum: a simulation chamber study. Atmospheric Chemistry and Physics 17, 7175–7191
626 (2017).
627 50. Bond, T. C. & Bergstrom, R. W. Light absorption by carbonaceous particles: An investigative review.
628 Aerosol science and technology 40, 27–67 (2006).
629 51. Durand, Y. et al. Reanalysis of 44 yr of climate in the french alps (1958–2002): methodology,
630 model validation, climatology, and trends for air temperature and precipitation. Journal of Applied
631 Meteorology and Climatology 48, 429–449 (2009).
24You can also read