BUDGET SUBMISSION 2022/23 - CAIRNS WATER SECURITY STAGE 1 PROJECT - Cairns Regional Council
←
→
Page content transcription
If your browser does not render page correctly, please read the page content below
QUEENSLAND GOVERNMENT
2022/23
BUDGET SUBMISSION

 Mareeba              Copperlode Dam                   Barron River         Cairns Airport    Cairns Seaport

                                                                                                 Cairns

                                              CONSTRUCTION PHASE

                                                                                              CAIRNS
                                                                                              WATER
                                                                                             SECURITY
                                                                                             – STAGE 1

  Atherton   Tablelands Agricultural Region      Tinaroo Dam          Mulgrave River

CAIRNS WATER SECURITY
STAGE 1 PROJECT
                                                                                                      October 2021
1

         2022/23 BUDGET SUBMISSION REQUEST

           Cairns Regional Council formally requests that:

                                      Budget provision be made in the forward estimates of the Capital
                1.                    Statement in the Queensland Government 2022/23 Budget for a
                                      Queensland Government contribution of $107.5 million towards the
                                      Cairns Water Security – Stage1 project as outlined in the table below.

                                                                                        2024-25                     2025-26                   TOTAL
                                                                                        $ Million                   $ Million                $ Million
                                                                                           (ex GST)                    (ex GST)               (ex GST)

                                      Queensland Government                                 55.0                       52.5                   107.5
                                      Contribution
                                      Federal Government                                                                                      107.5
                                      Contribution
                                                                                            55.0                       52.5

                                      Total funding sought
                                      (State and Federal)                                   110.0                     105.0                   215.0

               2.
                                     The Queensland Government also support Cairns Regional Council’s
                                     request for Federal Government funding to support project delivery.

C A I R N S R E G I O N A L C O U N C I L / 2 0 2 2 / 2 3 B U D G E T S U B M I S S I O N / C A I R N S WAT E R S E C U R I T Y S TA G E 1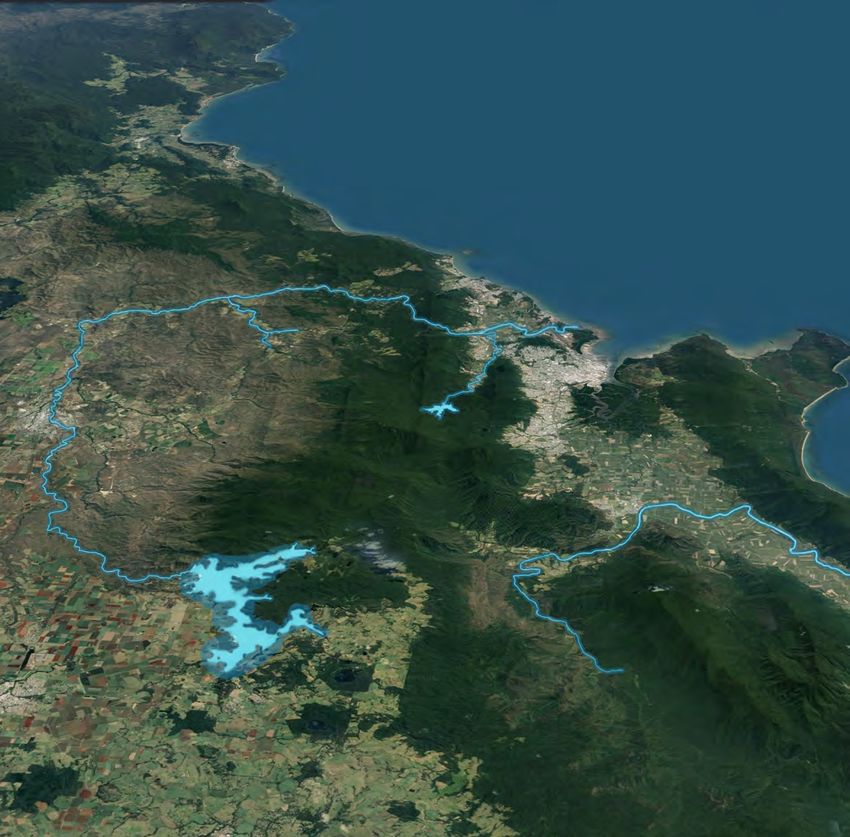
2

BACKGROUND
THE PROBLEM                                                                                                           Cairns’ service population has
 A    ustralia’s urban water infrastructure is critical for the
      liveability and prosperity of more than 20 million people                                                       more than tripled since Copperlode
 and 9 million connected properties in our towns and cities. It                                                       Falls Dam was built in 1976
 also serves industries, supporting growth in productivity and
 employment across Queensland and the country.
    Recognising the importance of this issue, on 26 February 2020                                                                             1976         TODAY
 Infrastructure Australia included Town and City Water Security                                                       DAM                    38,400ML      38,400ML
 as a new High Priority Initiative on the National Infrastructure                                                     CAPACITY
 Priority List. This new High Priority Initiative was informed, in
 part, by a submission from Cairns Regional Council (Council)
 regarding Cairns’ water security needs and the Cairns Water
 Security (CWS) – Stage 1 project.
                                                                                                                     SERVICE                 58,000        198,000
                                                                                                                     POPULATION

CAIRNS URBAN WATER SUPPLY SOURCES
                                                                                                                • Constructed 1976.
                                                                    PRIMARY SOURCE                              • Dam capacity 38,400 Megalitres (ML).
                                                                    (~>80% of annual supply)                    • Water treated at the full-service Freshwater
                                                                                                                  Water Creek Water Treatment Plant (WTP)
                                                                    Copperlode Falls Dam                          located at Tunnel Hill (constructed 1981).
                                                                    on Freshwater Creek
                                                                                                                • Currently supplies over 80% of Cairns’
                                                                                                                  annual water requirements.

                                                                                                                • Established 1955 with subsequent
                                                                                                                  improvements/upgrades.
                                                                    SECONDARY SOURCE
                                                                                                                • Run of river supply (no bulk water storage).
                                                                    Behana Creek                                • Volumes constrained by seasonality,
                                                                                                                  environmental flow requirements, turbidity
                                                                                                                  and a sub-optimal treatment process.

WHILST THE ABOVE SUPPLY SOURCES HAVE SERVED CAIRNS
       WELL OVER MANY DECADES, THEY WILL NO LONGER BE ABLE
                  TO MEET THE NEEDS OF A GROWING CAIRNS POPULATION.
C A I R N S R E G I O N A L C O U N C I L / 2 0 2 2 / 2 3 B U D G E T S U B M I S S I O N / C A I R N S WAT E R S E C U R I T Y S TA G E 1
3

     The graph below plots the existing supply capacity within the Cairns
   Water Supply Scheme and the anticipated annual demand for urban
   water, taking into account future population growth (medium growth
   scenario) based on the Queensland Government Statisticians Office                                                                            Local Resident and Business efficiency
   (QGSO) projections.                                                                                                                          has already delivered real results

                                                                                                                                                42%
   FIG 1: EXISTING SUPPLY CAPACITY VS DEMAND                                                                                                                                Reduction in water
                               50,000                                                                                                                                       usage per capita over
                                                                                                   d
                                                                                                                                                                            the past 15 years
                                                                                            Deman
                               40,000
   Annual Demand/Supply (ML)

                                                                                                RISK
                               30,000                                    (drinking water shortfall)
                                                                                                                                                                ON A PER RESIDENTIAL
                                                                                  Existing Supply Capacity                                                      PROPERTY BASIS, CAIRNS USES:
                                             CRITICAL
                               20,000
                                                                                                                                                                                          Less
                               10,000
                                                                                                                                                                                          water than
                                                                                                                                                                                          Townsville

                                                                                                                                                                 31%
                                    2020   2025     2030   2035   2040     2045          2050       2055     2060

                                                                                                                                                                                          Less
   Figure 1 highlights that by the middle of this decade, demand for water                                                                     water than
   in Cairns will outstrip existing supply capacity. Without action, there is                                                                  Darwin
                                                                                       *based on 2019-20 data
   the real risk of a drinking water shortfall. This could have significant
   ramifications for the Cairns community and economy including:
   • Severe and more frequent water restrictions adversely impacting                   Key demand management actions to date:
      the quality of life for residents and visitors.
                                                                                       • Effective metering and pricing.
   • Inability to service expected population growth including new
                                                                                       • Water education and conservation programs
      development supported by the State Government which in itself is                    (schools and community).
      likely to bring forward the demand to as early as 2024.                          • Media and communication campaigns.
   • Damage to the city’s and the region’s reputation as a visitor                     • Active leak detection, management and repair program.
      destination.                                                                     • Water conservation incentives for commercial customers.
                                                                                       • Use of recycled water for irrigation of public gardens,
   • Loss of business and consumer confidence as a result of risk and                     school fields and sports facilities.
      reliability issues associated with water supply with flow on negative
      impacts to the entire regional economy.
   • Diverting local resources and increasing costs on struggling
      businesses in an economy severely impacted by COVID-19 due to              Whilst demand management initiatives have delivered
      the region’s reliance on aviation connectivity and international and significant results and will be ongoing, they will not on their
      interstate tourism.                                                     own, enable the water needs of a growing population to be
                                                                              met. As a result, and in accordance with the CWSS, a series of
   Council has been investigating and planning for the long-term              augmentations to the Cairns water supply are required. These
   water needs of the Cairns region for many years. This included             augmentations are displayed in Figure 2 below as the series of
   active support for the additional water capacity that would have           ‘step-ups’ in supply capacity.
   been provided by Nullinga Dam. That project was regrettably not
   supported by either the State or Federal Governments at the time.
                                                                                FIG 2: AUGMENTED SUPPLY CAPACITY VS DEMAND
     In 2015, Council adopted the Cairns Water Security Strategy (CWSS)            50,000
   following 18 months of consultation and detailed analysis and advice
                                                                                                                               Supply Capacity         d
                                                                                                                                                 Deman
   coordinated through Council’s independent Water Security Advisory               40,000
                                                                                                                    Annual Demand/Supply (ML)

   Group (WSAG). The CWSS identified a staged series of initiatives                                                                                  RISK
   needed to meet Cairns’ short, medium and long-term water security               30,000

                                                                                                    Cairns Water Security Stage 1
   requirements. Regional implications of various alternatives were                                 (provides a decade of water security)
                                                                                   20,000
   also a key consideration. Initiatives identified in the CWSS included
   actions to reduce water demand as well as augmentations to the                  10,000
   Cairns water supply network. Significant work has already been
   undertaken in further developing and implementing the CWSS.
                                                                                                                                                2020   2025   2030   2035   2040   2045    2050      2055         2060

                                                                                                                    Note: The demand forecasts included in Figures 1 and 2 in this paper incorporate additional
                                                                                                                    water savings through further demand management initiatives over the period to 2060.

C A I R N S R E G I O N A L C O U N C I L / 2 0 2 2 / 2 3 B U D G E T S U B M I S S I O N / C A I R N S WAT E R S E C U R I T Y S TA G E 1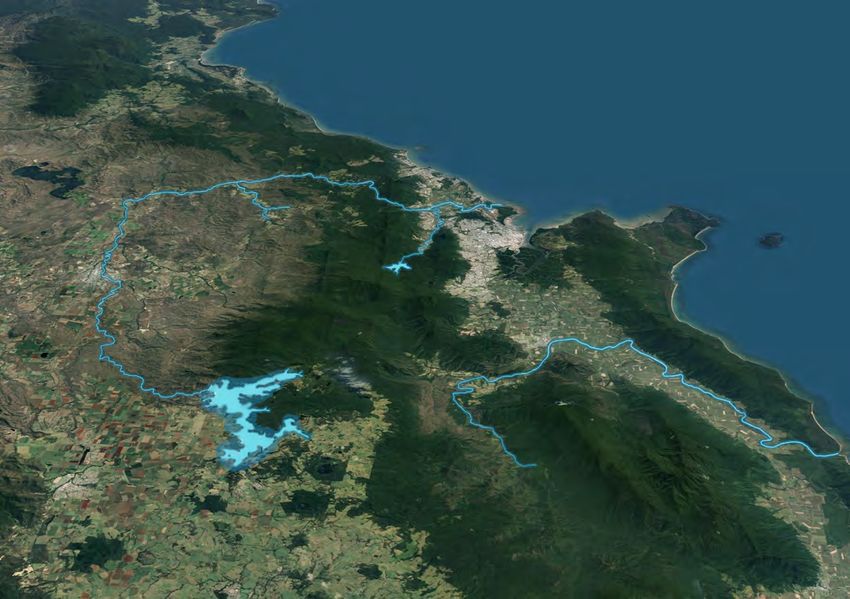
4

        THE SOLUTION
        Cairns Water Security – Stage 1
        T  he CWS – Stage 1 project delivers the additional water capacity required to meet Cairns’ short to medium term water
           needs. The project will underpin our region’s future population growth and specifically avoids conflict with the agricultural
        water needs on the Atherton Tablelands region by sourcing water from the Mulgrave River rather than the Barron River/Mareeba
        Dimbulah Water Supply Scheme (MDWSS). Unanimously endorsed as Council’s Number 1 Advocacy Priority and supported by
        key regional stakeholders and surrounding Councils, the project is well planned and already well advanced.

                                                                                                  NORTHERN BEACHES

 T  he CWS – Stage 1 project delivers the additionalKURANDA
                      BARRON RIVER
                                                      water
    capacity required to meet Cairns’ short to medium term
 water needs. The project will underpin our region’s future
                                                                  SMITHFIELD

 population growth and specifically avoids conflict with
 the agricultural water needs on the Atherton Tablelands                                                                                           CAIRNS CBD

 region by sourcing water from the Mulgrave River rather
 MAREEBA

 than the Barron River/Mareeba Dimbulah Water Supply
 Scheme (MDWSS). Unanimously endorsed as Council’s
                                                        COPPERLODE DAM                                                           EDMONTON
 Number 1 Advocacy Priority and supported by key regional
 stakeholders and surrounding Councils, the project is well                                                                                       CAIRNS SOUTH STATE
                                                                                                                                                  DEVELOPMENT AREA
 planned and already well advanced.
                                                                                                                                                           GORDONVALE

   Further details on the project are included in project
 overview document set out at Appendix 1
                                          TINAROO DAM

                                         TINAROO DAM

                                                                                                            MULGRAVE RIVER

                                                                                                                 MT Peter
                                                                                                             Development Area

                                                                                                                                                     MAINS INFRASTRUCTURE

ATHERTON                                                                                    PROJECT OVERVIEW                                            to current network

                                                                                                                 RESERVOIRS & TREATMENT
                                                                                                                    INFRASTRUCTURE
                                                                                                                  strategically located on land
                                                                                                                  bordering the southern edge
                                                                                                                  of the Mt Peter urban
                                                                                                                  development area.
                                                                                                                                                                             Cairns South SDA

                                                                                                                                                                                                   SUPPLY PIPELINE
                                                                                                                                                                                                Intake to treatment plant

           Total project capital cost is estimated at $215 million
                                                                                                                                                              MAINS NETWORK
           (ex GST) with a two-year construction timeframe
                                                                                                       WASTEWATER
           (July 2024 to June 2026). The project is already                                        from the treatment process.
                                                                                                                                                                         Gordonvale

           well progressed. A strategic reserve has been
           made within water regulations to support the new
           supply. Land acquisition, hydrology and hydraulic
           analysis, procurement strategy development and
           endorsement, and pilot testing are also all complete.                                                                                         NEW WATER CAPACITY
                                                                                                                                                          – MULGRAVE RIVER

 C A I R N S R E G I O N A L C O U N C I L / 2 0 2 2 / 2 3 B U D G E T S U B M I S S I O N / C A I R N S WAT E R S E C U R I T Y S TA G E 1
5

 Key benefits
     Provides new water capacity like a dam but at a
                                                                                                       Provides significant risk mitigation and contingency for
     fraction of the cost and with a significantly lighter
                                                                                                       Cairns’ primary water source (Copperlode Falls Dam).
     environmental footprint.

                                                                                                       Protects Cairns’ reputation as an internationally
     Augments the entire Cairns water supply network
                                                                                                       renowned visitor destination thereby supporting the
     through connectivity to the water mains network to the
                                                                                                       long-term prosperity of the region’s tourism and allied
     north and south of Gordonvale.
                                                                                                       industries.

     Provides water security for Cairns well into the next
                                                                                                       Provides significant risk mitigation and contingency
     decade (with a second phase of the project able to
                                                                                                       for the city’s water treatment processes/capabilities
     further extend this) and delivers the additional water
                                                                                                       through the establishment of a second full-service WTP
     Cairns needs to grow and prosper.
                                                                                                       within the Cairns Water Supply Scheme.

     Supports agricultural sector growth in the broader
                                                                                                       Provides a significant contribution to regional
     Atherton Tablelands region by not sourcing water from
                                                                                                       employment and gross regional product during both
     the Mareeba Dimbulah Water Supply Scheme (MDWSS)/
                                                                                                       construction and operation.
     Barron River. It is noted that existing water allocations
     within the MDWSS are already fully subscribed.
                                                                                                       Strategically located adjacent to the Mount Peter
                                                                                                       future urban development area which is expected
     Supports and underpins the Queensland Government’s
                                                                                                       to accommodate a significant portion of the Cairns
     Cairns South State Development Area (1,159 hectares
                                                                                                       and FNQ region’s population growth over the coming
     situated to the north of Gordonvale) which secures land
                                                                                                       decades.
     for significant industrial development.

     Enables a significantly enhanced treatment process
     to be applied to Council’s existing Behana Creek water
     source increasing the reliability, quality (safety) and
     volume of water able to be drawn from this existing
     source.

C A I R N S R E G I O N A L C O U N C I L / 2 0 2 2 / 2 3 B U D G E T S U B M I S S I O N / C A I R N S WAT E R S E C U R I T Y S TA G E 1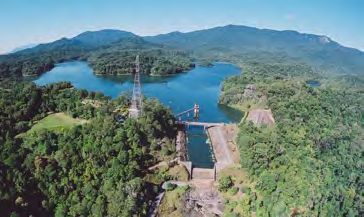
6

    ECONOMIC IMPACTS

                                   $242.7m               contribution to GRP

    CONSTRUCTION
    PHASE
                                   1,658 JOBS                (FTE JOB YEARS)

                                   $352.2m                                 GRP

     OPERATION
     PHASE*                         3,179 JOBS
     *GRP and jobs supported/protected                                    (FTE )

    CAPITAL INVESTMENT MEASURES
    (7% DISCOUNT RATE)
    Project net present value                          Benefits to cost ratio

     $261.2m 1.97

A   detailed independent business case is currently being
    prepared for the project to confirm the significant strategic
assessment, options analysis and benefit/cost assessment
                                                                                               A copy of the AEC report is included at Appendix 2.
                                                                                               Key findings of the report include:
                                                                                               • The project is expected to contribute $242.7 million to Cairns’
work already undertaken as part of the CWSS and further                                          Gross Regional Product (GRP) and support 1,658 jobs (full time
analysis completed since that strategy’s adoption. In the                                        equivalent job years) during the its construction phase.
interim, Council has commissioned independent economic                                         • The project is expected to support/protect $352.2 million in
analysis (including preliminary net present value and benefits                                   Cairns’ GRP and 3,179 FTE jobs (on an average annual basis)
to cost ratio assessment) of the project by economic advisory                                    during the project’s operations phase. This includes the
firm AEC Group Ltd (AEC).                                                                        retention of visitor expenditure in the region by virtue of the
                                                                                                 impact the project has on protecting destination reputation.
                                                                                               • A positive case for investment with a project Net Present Value
                                                                                                 (NPV) of $261.2 million and Benefits to Cost Ratio (BCR) of 1.97
                                                                                                 at a 7% discount rate.

C A I R N S R E G I O N A L C O U N C I L / 2 0 2 2 / 2 3 B U D G E T S U B M I S S I O N / C A I R N S WAT E R S E C U R I T Y S TA G E 1
7

      Alignment with the Draft Queensland
      State Infrastructure Strategy
       The Draft Queensland State Infrastructure Strategy (the Draft SIS)                     into new infrastructure to support economic development,
       was released on 9 September 2021. We are pleased to see a                              and protecting water security. The table below provides an
       priority focus on Water, with the Draft SIS recognising that:                          overview of how the CWS – Stage 1 project aligns with the
                                                                                              four objectives in the QBWOS that guide the Queensland
       “Ensuring all Queenslanders have access to safe and                                    Government’s approach to bulk water supply.
       secure drinking water is a critical priority. The Queensland                              In relation to Regional Queensland water security, the Draft
       Government works in partnership with local governments to                              SIS indicates:
       ensure that communities have water and wastewater systems
       in place, and that these assets are sustainably managed,                               “In regional Queensland, the state partners with local
       through good planning, proactive maintenance, and an                                   governments to undertake urban water supply security
       appropriately skilled workforce.”                                                      assessments, monitor risks to security and continuity
                                                                                              of supply and provides assistance when needed.”
       The Queensland Bulk Water Opportunities Statement
       (QBWOS) sets out the Queensland Government’s strategic                                 For the water security needs of Cairns, State assistance is
       framework for maximising the utilisation and efficiency of                             needed now to support delivery of the CWS – Stage 1 Project.
       existing water supply infrastructure, optimising investment

      TABLE 1: CWS – STAGE 1 PROJECT/QBWOS STRATEGIC ALIGNMENT

          QBWOS STRATEGIC                          How the CWS – Stage 1 project supports/aligns to this objective
          OBEJCTIVE

       Ensure safety and reliability           • Contributes to the reliability of Cairns’ urban water supply by providing access to new water capacity in the
       of dams and urban water                   Mulgrave River. The new water capacity will then be pro-actively managed in conjunction with Cairns’ other major
       supply                                    water supplies (Copperlode Falls Dam and Behana Creek) to deliver improved water reliability and security.
                                               • Enables an enhanced treatment process to be applied to water sourced from the Behana Creek water supply
                                                 improving the quality (safety) and reliability of this source.

       Optimise utilisation and                • Council’s demand management strategy has already delivered a 42% reduction in per capita water use over the
       efficiency of existing                    past 15 years. This demonstrates Council’s commitment to effective utilisation of existing water infrastructure.
       infrastructure
                                               • Council has also already undertaken a comprehensive review and update of its Levels of Service (LoS) framework
                                                 to enable better use of existing water resources through a thorough understanding of risk.
                                               • Through the application of an improved treatment process to water sourced from the Behana Creek supply, the
                                                 project enables the water yield from this source to be maximised.
                                               • The water from the CWS- Stage 1 project will be integrated into the Cairns trunk water network. With the water
                                                 from Council’s three main water sources (Copperlode Falls Dam, Behana Creek and the new Mulgrave River supply)
                                                 to be managed as a consolidated water grid, the project will enable the optimisation and efficiency of water supply
                                                 infrastructure to be achieved including:
                                                 - Conservation and effective management of Council’s only bulk water storage facility (Copperlode Falls Dam);
                                                 - Minimising infrastructure operational costs (in particular electricity) by sourcing, treating and delivering water
                                                   from the most cost-effective supply having regard to seasonal and water conservation factors.

      Support infrastructure                   • The infrastructure will be owned and operated by a commercialised business unit (Cairns Water) within Cairns
      development that provides a
                                                 Regional Council (a publicly owned entity). Returns from water usage charges will be utilised to cover operational
      commercial return to the state and
      publicly owned bulk water entities         costs and support investment in future water infrastructure for the benefit of the Cairns community.

      Consider projects that                   • An independent economic assessment of the project by economic advisory firm AEC (refer Appendix 2) confirms
      will provide regional                      the project will deliver significant economic benefits during both its construction and operations phases.
      economic benefits
                                               • As highlighted earlier, the project also supports continued agricultural sector growth in the broader Atherton
                                                 Tablelands region by not sourcing water from the fully allocated Mareeba Dimbulah Water Supply Scheme
                                                 (MDWSS)/Barron River.
                                               • It is also noted that the CWS – Stage 1 project was highlighted as a priority project in the economic recovery section
                                                 of the COVID-19 Cairns Local Recovery Plan which was developed by Council following significant consultation and
                                                 engagement with key stakeholders including representatives of both the Queensland and Federal Governments.

C A I R N S R E G I O N A L C O U N C I L / 2 0 2 2 / 2 3 B U D G E T S U B M I S S I O N / C A I R N S WAT E R S E C U R I T Y S TA G E 1
8

        Stakeholder support
        for the project
       R   ecognising how critical the project is to our city and our
           region’s future, on 28 April 2021 Council unanimously
        endorsed the project as its Number 1 Advocacy Priority.
        A community and stakeholder awareness and advocacy
        campaign has been progressively implemented since that time.                                 The impacts of
           All three members of the Queensland Labor Government
        whose electorates cover the Cairns Local Government Area                                     COVID-19 on the Cairns
        (the Hon Craig Crawford MP, the Hon Curtis Pitt MP and Michael
        Healy MP) have confirmed their support for the project. The                                  community’s capacity
        Hon Warren Entsch MP, Federal Member for Leichhardt has
        also expressed his support for the project as has Shane Knuth                                to fund this project
        MP, whose State electorate of Hill also encompasses a portion
        of the Cairns Local Government Area. Refer Appendix 3 for
        copies of letters of support in this regard.
                                                                                                    C   airns’ economy has been one of the most severely impacted
                                                                                                        by COVID-19 of any region in the country. With an economy
                                                                                                     heavily reliant on international/interstate tourism and aviation
           The key stakeholder organisations set out in the diagram                                  connectivity, border and travel restrictions continue to
        below have also formally confirmed their support for the                                     constrain economic recovery. Like the Queensland and Federal
        project.                                                                                     Governments, Council has implemented a range of initiatives to
                                                                                                     mitigate the impacts of COVID-19 on the Cairns community and
                                                                                                     economy including:
              TRC
              TABLELANDS REGIONAL COUNCIL
                                                                                                     • Financial hardship policy for ratepayers impacted by
                                                                                                       COVID-19 (interest waivers and generous deferrals/
                                                                                                       repayment plans).
                                                                                                     • Record $159 million capital works program in 2020-21 to
                                                                                                       stimulate activity in the construction and capital works
        ADVANCE
         CAIRNS
             OUR REGION ONE VOICE
                                                                                                       sector.
                                                                                                     • Rate deferrals.
        THE COMMITTEE FOR TROPICAL NORTH QUEENSLAND

                                                                                                     • A range of fee waivers and deferrals.
        Council has also recently established a Business Supporters                                  • An investment incentive policy (including financial
        Board, a dedicated page on Council’s website where                                             incentives) to stimulate economic activity and development.
        businesses/organisations can upload their logo in support
        of the project. At the date of this submission, over 200                                     Whilst these initiatives are needed and have been welcomed,
        businesses/organisations have confirmed their support                                        they have constrained Council’s financial capacity to invest
        in this regard. A copy of this Business Supporters Board is                                  in the major infrastructure projects necessary for long-term
        attached at Appendix 4.                                                                      recovery and future growth. Without external investment, the
          The wider Cairns community also wants to see investment in                                 $215 million capital cost of the CWS - Stage 1 project would be
        water security as evidenced by responses to Council’s recent                                 borne by the ratepayers and residents of Cairns at the very time
        Our Cairns Survey (a community survey conducted in 2020                                      their capacity to bear such costs is heavily constrained.
        with approximately 8,000 respondents). Refer Figure 4 below.

       FIG 4: OUR CAIRNS SURVEY RESPONSES
                                                                                                        At the date of this submission, more than 1,300 Cairns
                                                                     59% OF RESPONDENTS
                                                                                                        ratepayers are on financial hardship plans with
                                                                                                        additional requests for assistance expected in the coming
                                                                                                        months. The community of Cairns is simply not able
                                                               47% OF RESPONDENTS                       to fund this project, particularly in light of the financial
                                                                                                        hardship experienced as a result of COVID-19.
                                                                     41% OF RESPONDENTS

                                                                     40% OF RESPONDENTS

                                                                     38% OF RESPONDENTS

C A I R N S R E G I O N A L C O U N C I L / 2 0 2 2 / 2 3 B U D G E T S U B M I S S I O N / C A I R N S WAT E R S E C U R I T Y S TA G E 1
9

      Project capital cost and funding schedule
     C   ouncil is actively seeking Queensland and Federal
         Government Support (on a 50/50 basis) for the project’s
      $215 million (ex GST) capital cost. The project capital cost
                                                                                               Council has already incurred substantial costs in
                                                                                               progressing the project to date (water strategy, project
                                                                                               planning and analysis, land acquisition etc) and will
      has been subject to an independent cost review undertaken                                be responsible for project delivery including accepting
      by specialist water industry consulting firm Hunter H2O                                  responsibility for project risks (potential cost overruns etc).
      with the capital cost estimated to a P90 level. A full copy                              Council has an established track record of successfully
      of this independent cost review is available on request.                                 delivering large scale civil infrastructure projects over many
      A summary of the anticipated timing of the capital cost and                              years.
      external funding being sought, is set out in the table below.

     TABLE 2: CAPITAL COST/FUNDING SUPPORT REQUESTED (ALL AMOUNTS ARE GST EXCLUSIVE)
                                  20/21         21/22         22/23        23/24          24/25           25/26           26/27        27/28       TOTAL
                                 $’000s        $’000s        $’000s       $’000s         $’000s          $’000s          $’000s       $’000s       $’000s

    CWS– Stage 1                     550         2,834         1,607        5,701         98,137        100,446           2,000         3,725     215,000
    CAPEX Budget
    CWS – Stage 1
    Funding Request
      QLD Government     - - - - 55,000   52,500 - - 107,500
      Federal Government - - - -  55,000  52,500 - - 107,500
    TOTAL                - - - - 110,000 105,000 - - 215,000

         Queensland government support required

       C   ouncil previously requested funding allocations be
           made for the CWS – Stage 1 project in the 2021/22
       Queensland Budget that was delivered in June this year,
                                                                                               2026, funding is now essential in the forward estimates
                                                                                               of the Queensland 2022/23 Budget. Queensland
                                                                                               Government support is also important in the context
       noting that technically a significant proportion of the                                 of Council’s request for a Federal Government funding
       funding program fell outside the forward estimates.                                     contribution, noting that the forthcoming Federal
       However, to ensure final planning and construction can                                  Budget and election platforms bridge the necessary
       take place by 2024 in order to avoid a water shortfall in                               period for Federal support.

         Accordingly, Cairns Regional Council formally requests that:

          1.           Budget provision be made in the forward estimates of the Capital
                       Statement in the Queensland Government 2022/23 Budget for a                                           2.          The Queensland Government
                                                                                                                                         also support Cairns Regional
                       Queensland Government contribution of $107.5 million towards                                                      Council’s request for Federal
                       the Cairns Water Security – Stage 1 project as outlined in the                                                    Government funding to
                       table below.                                                                                                      support project delivery.
                        2024-25 2025-26   TOTAL
                     		 $million $million $million
                     		 (ex gst) (ex gst) (ex gst)
                        QLD Government		                         55.0             52.5             107.5
                        Federal Government		                     55.0             52.5             107.5
                       Total funding sought		                    110.0           105.0             215.0

C A I R N S R E G I O N A L C O U N C I L / 2 0 2 2 / 2 3 B U D G E T S U B M I S S I O N / C A I R N S WAT E R S E C U R I T Y S TA G E 1
QUEENSLAND GOVERNMENT 2022/23 BUDGET SUBMISSION APPENDIX 1: Cairns Water Security – Stage 1 project HIGH LEVEL PROJECT OVERVIEW
QUEENSLAND GOVERNMENT
2022/23
BUDGET SUBMISSION

 APPENDIX 2:

AEC Group Ltd -
Independent Economic Analysis
CAIRNS WATER
SECURITY – STAGE 1
PROJECT – ECONOMIC
ANALYSIS
CAIRNS REGIONAL COUNCIL
AUGUST 2021
CAIRNS WATER SECURITY – STAGE 1 PROJECT – ECONOMIC ANALYSIS

DOCUMENT CONTROL
Job ID:                    J002177

Job Name:                  CWS – Stage 1: Economic Analysis

Client:                    Cairns Regional Council

Client Contact:            Nick Masasso

Project Manager:           Kieron Lacey

Email:                     kieron.lacey@aecgroupltd.com

Telephone:                 (07) 4771 5550

Document Name:             CWS Stage 1 - Economic Analysis Final

Last Saved:                11/10/2021 3:56 PM

 Version                   Date                            Reviewed               Approved
 Draft v1.0                6 August 2021                        KL                    KL
 Draft v2.0                17 August 2021                       KL                    KL
 Final                     19 August 2021                       KL                    KL

Disclaimer:

Whilst all care and diligence have been exercised in the preparation of this report, AEC Group Pty Ltd does not warrant the
accuracy of the information contained within and accepts no liability for any loss or damage that may be suffered as a result of
reliance on this information, whether or not there has been any error, omission or negligence on the part of AEC Group Pty Ltd
or their employees. Any forecasts or projections used in the analysis can be affected by a number of unforeseen variables, and
as such no warranty is given that a particular set of results will in fact be achieved.

                                                                                                                               i
CAIRNS WATER SECURITY – STAGE 1 PROJECT – ECONOMIC ANALYSIS
EXECUTIVE SUMMARY
BACKGROUND
The primary water supply for Cairns comes from the Copperlode Falls Dam and Behana Creek Intake, with the
Copperlode Dam having served Cairns for the past 45 years. However, it is projected the existing water supply
infrastructure is at risk of no longer meeting the water supply needs of Cairns by as early as the mid-2020s.
In 2015, Cairns Regional Council (Council) adopted the Cairns Water Security (CWS) Strategy, which identifies a
staged series of initiatives needed to meet Cairns’ short, medium and long-term water needs. This includes
initiatives to augment Cairns’ water supply network.
To secure Cairns’ water needs well into the future, Council is proposing two augmentations:
• CWS – Stage 1. This will secure the region’s water needs well into the next decade (2033)
• CWS – Stage 2. This stage will provide water security through to 2038.
PURPOSE AND APPROACH
Council has engaged ARUP to prepare a detailed business case (DBC) for the project following the Building
Queensland Detailed Business Case methodology. Whilst the DBC undertaken by ARUP will include a detailed
cost benefit analysis (CBA) following strategic assessment and options analysis phases, the final report is not
expected to be available until third quarter 2022. In the interim, Council have engaged AEC Group Pty Ltd (AEC)
to develop a preliminary Economic Impact Assessment (EIA) and CBA for the Stage 1 project based on existing
available information to support future advocacy and funding negotiations while the DBC is completed.
KEY FINDINGS
Economic Impact Assessment
During the construction phase, the CWS – Stage 1 project is estimated to generate significant economic impacts
within the Cairns Local Government Area (LGA), as outlined below.
Table ES. 1. Economic Activity Supported by Construction ($M), Cairns
Impact Outputs ($M) Gross Regional Incomes ($M) Employment
Product ($M) (FTEs)
Direct $191.4 $75.9 $47.5 474
Production Induced Impacts $112.8 $52.4 $38.2 407
Household Consumption impacts $196.1 $114.4 $60.1 776
Total $500.2 $242.7 $145.8 1,658
Note: Totals may not sum due to rounding.
Source: AEC.
Once construction of Stage 1 is complete, operational activity and retention of visitor expenditure will generate
significant activity within the Cairns LGA each year.
Table ES. 2. Economic Activity Supported by Operations ($M), Cairns (Average Annual)
Impact Outputs ($M) Gross Regional Incomes ($M) Employment
Product ($M) (FTEs)
Direct $265.1 $136.3 $104.1 1,692
Production Induced Impacts $110.1 $55.0 $38.3 395
Household Consumption impacts $275.7 $160.9 $84.6 1,092
Total $650.9 $352.2 $226.9 3,179
Note: Totals may not sum due to rounding.
Source: AEC.
iiCAIRNS WATER SECURITY – STAGE 1 PROJECT – ECONOMIC ANALYSIS
Other Socio-Economic Benefits
In addition to the economic activity outlined above, the project will support a range of socio-economic benefits for
the Cairns Region, including:
• Continued Population Growth: Without the augmentation of the water supply, future population growth in
Cairns would be constrained. The implementation of significant water restrictions in the region may be
perceived as a deterrent for current locals and those looking to relocate. However, with the project, population
growth is not restrained. Population within the Cairns LGA is estimated to grow from 166,849 persons in 2019
to 233,113 persons in 2041. These projections do not include visitors who are non-residents that use a
significant amounts of water per annum. The average daily population load from visitors in 2019 was around
31,500 visitors per day (TRA, 2021), noting that the daily visitation loads will likely vary based on season.
• Benefits to Council: The project will provide additional benefits to Council, including:
o Solar/hydro savings: there are opportunities to incorporate solar and hydro components in stage one which
would reduce the requirement for Council to purchase electricity from the grid to support the project’s
energy needs and thereby provide a cost saving to Council relative to electricity costs if solar/hydro
components are not included.
o Behana Creek savings: current treatment activities at Behana Creek will be decommissioned and be
replaced by a new water treatment plant delivered as part of the project. The new treatment plant will
provide an enhanced water treatment process to that currently applied to the Behana Creek water supply,
and will remove the existing cost of water treatment at Behana Creek from Council’s operating expenditure
(to be replaced by costs for operating the new treatment plant).
o Revenue: the water supply augmentation will provide revenues for Council. These revenues would be
incurred in the form of rates as well as water usage/ consumption charges to local residents and
businesses in the Cairns LGA. While this can also be seen as a cost to residents, by supporting population
(and business) growth, the project will also support an increase in the rates base, thereby ensuring the
costs to residents is dispersed across a larger community, lessening the impact per household/ business.
• Benefit to the Broader Tropical North Queensland Tourism: Not only will the critical water supply
augmentation support retention of tourism to the direct Cairns LGA, but it will also support the retention of
tourism to the broader region. Cairns is the central visitor hub in the Tropical North Queensland region, and
the key location for overnight visitation. Those who visit Cairns make stops, or day trips to other places within
the broader region, generating visitor expenditure. If visitation to the Cairns Region were to reduce, due to
water supply constraints, this would impact not only expenditure within Cairns itself, but it would also impact
the visitor expenditure in the broader region.
• Other Benefits Include:
o Improved water availability to support local business operations and expansion. This will support the
continued attraction of key projects in the region, including continued growth of industrial development.
Providing ‘reliable and sufficient water supplies are critical for business development and reduced
investment risk’ (SIWI 2005, p.19).
o Supporting the identity of the Cairns Region and a luscious rainforest retreat, with an abundance of
‘greenery’.
o Avoiding conflict with future agricultural water needs on the Atherton Tablelands by not sourcing water
from the Baron River/Mareeba Dimbulah Water Supply Scheme (Cairns Regional Council, 2021).
o Complementing the Queensland Government’s Cairns South State Development Area and thereby
assisting to secure land for significant industrial development (Cairns Regional Council, 2021).
iiiCAIRNS WATER SECURITY – STAGE 1 PROJECT – ECONOMIC ANALYSIS
Cost Benefit Analysis
The CBA examined the costs and benefits associated with the project over a 30-year timeframe. Specifically, the
following costs and benefits were assessed:
• Costs:
o Construction costs for the project of $215 million.
o Ongoing operating expenditure of approximately $4.8 million from steady state. This includes the savings
from solar/hydro and decommissioning of the existing treatment process at Behana Creek.
o Replacement costs for the membrane total $5.3 million and will initially occur eight years after construction,
and at seven-yearly intervals thereafter. Replacement costs for mechanical and electrical components will
occur in 2046 and total $102.2 million.
• Benefits (this includes avoided costs of water restrictions in the Cairns LGA):
o Avoided welfare costs to households valued at $1.8 per annum from 2027 onwards
o Avoided loss to tourism and hospitality providing a benefit of $48.2 million per annum from 2027 onwards.
o Avoided costs to Council of $0.8 million per annum from 2027 onwards.
The Cairns water security stage one is economically desirable. The project when examined at a 7% discount rate
realises a Net Present Value (NPV) of $261.2 million and a Benefit Cost Ratio (BCR) of 1.97, highlighting the
project will return $1.97 for every $1 of cost. The development is assessed as not being sensitive to the discount
rate used, with the project returning an Internal Rate of Return (IRR) of 18.9%.
Table ES. 3. Cost Benefit Analysis Results
Real Discount Rate PV Costs ($M) PV Benefits ($M) NPV ($M) BCR
4% $322.9 $766.6 $443.7 2.37
7% $270.4 $531.6 $261.2 1.97
10% $237.6 $387.6 $150.0 1.63
Source: AEC.
Whilst a standard discount rate of 7% is generally recommended, a lower discount rate may be reasonable for
projects which have long lives, large social benefits (i.e., essential services such as water supply) and a strategic
focus which may place more emphasis on the project’s value to society in the future (TfNSW, 2021). High discount
rates understate the potential longer-term benefits of a project and thereby prompt decision makers to prioritise
short term benefits over longer term benefits, resulting in longer term appearing less desirable than shorter term
projects (Grattan Institute, 2018). Furthermore, interest rates are currently low (i.e., the opportunity cost of capital
is low), and so a lower discount rate may better reflect the existing economic and financing environment.
While the project provides a highly positive NPV and BCR at a 7% discount rate, the results at a 4% discount rate
may be considered more appropriate reflection of the present value of benefits and costs of the project. At a 4%
discount rate the project is identified as having a higher NPV and BCR than at a 7% discount rate, highlighting the
longer-term nature of the benefits that will be delivered relative to the up-front cost of the infrastructure.
Sensitivity testing of key parameters highlights that at a discount rate of 7%, there is a 90% probability the project
will provide an NPV of between $86.9 million and $545.9 million. Project outcomes are most sensitive to the avoided
loss to tourism and hospitality.
The sensitivity testing indicates the analysis outcomes are robust to changes in the assumptions used, returning a
positive NPV across 99.9% across the 5,000 iterations run in the Monte Carlo analysis for the project.
ivCAIRNS WATER SECURITY – STAGE 1 PROJECT – ECONOMIC ANALYSIS
TABLE OF CONTENTS
DOCUMENT CONTROL .......................................................................................................................................... I
EXECUTIVE SUMMARY ........................................................................................................................................ II
TABLE OF CONTENTS .........................................................................................................................................V
1. INTRODUCTION............................................................................................................................................ 1
1.1 BACKGROUND .............................................................................................................................................. 1
1.2 PURPOSE OF THIS REPORT ............................................................................................................................ 1
1.3 APPROACH .................................................................................................................................................. 1
2. PROJECT DESCRIPTION ............................................................................................................................. 2
2.1 PROJECT DESCRIPTION AND NEED ................................................................................................................. 2
2.2 CAPITAL COSTS ........................................................................................................................................... 2
2.3 OPERATING ACTIVITY .................................................................................................................................... 3
3. SOCIO-ECONOMIC BENEFITS .................................................................................................................... 4
3.1 ECONOMIC IMPACT MODELLING ..................................................................................................................... 4
3.2 OTHER SOCIO-ECONOMIC BENEFITS .............................................................................................................. 8
4. COST BENEFIT ANALYSIS ........................................................................................................................ 11
4.1 METHOD AND APPROACH ............................................................................................................................ 11
4.2 PROJECT CASE AND BASE CASE .................................................................................................................. 11
4.3 QUANTIFICATION AND VALUATION OF COSTS AND BENEFITS ............................................................................ 12
4.4 COST BENEFIT ASSESSMENT ....................................................................................................................... 14
REFERENCES...................................................................................................................................................... 16
APPENDIX A: INPUT-OUTPUT METHODOLOGY .............................................................................................. 17
APPENDIX B: COST BENEFIT ANALYSIS METHODOLOGY ........................................................................... 20
vCAIRNS WATER SECURITY – STAGE 1 PROJECT – ECONOMIC ANALYSIS
1. INTRODUCTION
1.1 BACKGROUND
The primary water supply for Cairns comes from the Copperlode Falls Dam and Behana Creek Intake, with the
Copperlode Dam having served Cairns for the past 45 years. However, it is projected the existing water supply
infrastructure is at risk of no longer meeting the water supply needs of Cairns by as early as the mid-2020s.
In 2015, Cairns Regional Council (Council) adopted the Cairns Water Security (CWS) Strategy, which identifies a
staged series of initiatives needed to meet Cairns’ short, medium and long-term water needs. This includes
initiatives to augment Cairns’ water supply network.
To secure Cairns’ water needs well into the future, Council is proposing two augmentations:
• CWS – Stage 1. This will secure the region’s water needs well into the next decade (2033)
• CWS – Stage 2. This stage will provide water security through to 2038.
Council has engaged ARUP to prepare a detailed business case (DBC) for the project following the Building
Queensland Detailed Business Case methodology. Whilst the DBC undertaken by ARUP will include a detailed
cost benefit analysis (CBA) following strategic assessment and options analysis phases, the final report is not
expected to be available until third quarter 2022. In the interim, Council would like a preliminary economic impact
assessment (EIA) and CBA for the Stage 1 project based on existing available information to support future
advocacy and funding negotiations while the DBC is completed.
1.2 PURPOSE OF THIS REPORT
AEC Group Pty Ltd (AEC) have been engaged by Council to develop an EIA and CBA of the CWS – Stage 1
proposed augmentation (“the project”).
The findings from the report will be utilised by Council for advocacy and lobbying purposes to secure funding for
the project.
1.3 APPROACH
The remainder of the report is structured as follows:
• Project Description (Chapter 2): Provides an overview of the proposed project, capital costs and subsequent
operating costs.
• Socio-Economic Benefits (Chapter 3): An EIA utilising Input-Output modelling techniques to estimate the
direct and flow on impacts of the project during construction and once operational. Other anticipated socio-
economic benefits not captured through Input-Output modelling are also described.
• Cost Benefit Analysis (Chapter 4): A CBA was undertaken examining the financial, economic, and social
benefits and costs anticipated to be generated by the project, over a 30-year timeframe.
1CAIRNS WATER SECURITY – STAGE 1 PROJECT – ECONOMIC ANALYSIS
2. PROJECT DESCRIPTION
2.1 PROJECT DESCRIPTION AND NEED
The CWS – Stage 1 is the first supply augmentation required and will secure Cairns’ water needs well into the next
decade. The project will enable ‘new’ water to be sourced from a run of river supply in the Mulgrave River and also
enable a significantly enhanced treatment process to be applied to Council’s existing Behana Creek water supply.
The primary water supply for Cairns comes from the Copperlode Falls Dam and Behana Creek Intake, with the
Copperlode Dam having served Cairns for the past 45 years. However, it is projected the existing water supply
infrastructure is at risk of being unable to meet the water supply needs of Cairns by as early as the mid-2020s.
New water supply infrastructure is urgently needed in the region to assist in meeting future growth in demand, to
support population and business growth in the region. Without action, there could be significant ramifications for
the Cairns community and economy, including:
• Severe and more frequent water restrictions, adversely impacting quality of life for residents and visitors.
• Effectively capping growth on population and the economy.
• Loss of business, consumer and visitor confidence and amenity.
2.2 CAPITAL COSTS
2.2.1 Initial Capital Costs
Total capital costs for the project are estimated to total $215 million (Cairns Regional Council, unpublished a). A
breakdown of capital costs by component are included in Table 2.1 below.
Table 2.1. Capital Costs by Component ($M)
Element / Discipline Capital Cost ($M)
Civil $107.5
Mechanical $59.2
Electrical $43.0
Membranes $5.3
Total $215.0
Notes:
• Totals may not sum due to rounding.
• The above capital costs include contingency and design and documentation costs.
Source: Cairns Regional Council (unpublished a).
The capital expenditure is expected to be developed over a period of three years, beginning in 2023-24 as follows:
• 2023-24 - $10.7 million
• 2024-25 - $98.1 million
• 2025-26 - $106.2 million.
2.2.2 Useful Life of the Asset
The useful life of components of the project are estimated to range from seven years to 60 years. The table below
provides a breakdown of the useful life of each capital cost.
The membrane replacement will initially occur eight years after construction, and at seven-year intervals thereafter
(Cairns Regional Council, unpublished b).
2CAIRNS WATER SECURITY – STAGE 1 PROJECT – ECONOMIC ANALYSIS
Table 2.2. Useful Life
Element / Discipline Years
Civil 60
Mechanical 20
Electrical 20
Membranes 7
Source: Cairns Regional Council (unpublished a).
2.3 OPERATING ACTIVITY
Once operational, the project is expected to generate economic activity through its operations. The table below
provides a breakdown of the operating costs of the project, based on five-year averages. The table also includes
operating cost savings for solar/ hydro and Behana Creek operations.
Stage 2 of the CWS is anticipated to be implemented over the second half of the 20-year projection period, which
will increase overall capacity and operating costs. However, for the purposes of modelling and to retain the impacts
of the analysis to examine Stage 1 works only, the additional capacity and costs associated with Stage 2 have not
been considered throughout the analysis.
Table 2.3. Average Annual Operating Expenditure by Time Period ($M)
Operating Cost Item Years 1 - 5 Years 6 - 10 Years 11 - 15 Years 16 Onwards
Power $1.48 $1.92 $1.87 $2.07
Maintenance $1.95 $1.95 $1.95 $1.95
Chemicals $0.35 $0.44 $0.44 $0.48
Labour $0.54 $0.54 $0.54 $0.54
Vehicles $0.02 $0.02 $0.02 $0.02
Other $0.04 $0.04 $0.04 $0.04
Solar / hydro savings -$0.22 -$0.29 -$0.28 -$0.31
Behana Creek savings -$0.03 -$0.03 -$0.03 -$0.03
Total Opex $4.13 $4.59 $4.55 $4.76
Notes:
• Totals may not sum due to rounding.
• This only considers the operational costs for stage one of the project. Additional phases of the Cairns Water Security Storage are
planned to be implemented by 2040, however, these components are not included in this analysis.
Source: Cairns Regional Council (unpublished a).
3CAIRNS WATER SECURITY – STAGE 1 PROJECT – ECONOMIC ANALYSIS
3. SOCIO-ECONOMIC BENEFITS
3.1 ECONOMIC IMPACT MODELLING
3.1.1 Approach
Economic modelling in this section estimates the economic activity supported by the construction and operational
activity of the project.
Input-Output modelling is used to examine the direct and flow-on 1 activity expected to be supported within the
Cairns Local Government Area (LGA) economy. Modelling drivers used in the assessment are described in the
following section. A description of the Input-Output modelling framework used is provided in Appendix A.
Input-output modelling describes economic activity by examining four types of impacts:
• Output: Refers to the gross value of goods and services transacted, including the costs of goods and
services used in the development and provision of the final product. Output typically overstates the
economic impacts as it counts all goods and services used in one stage of production as an input to later
stages of production, hence counting their contribution more than once.
• Gross product: Refers to the value of output after deducting the cost of goods and services inputs in the
production process. Gross product (e.g., Gross Regional Product (GRP)) defines a true net economic
contribution and is subsequently the preferred measure for assessing economic impacts.
• Income: Measures the level of wages and salaries paid to employees of the industry under consideration
and to other industries benefiting from the project.
• Employment: Refers to the part-time and full-time employment positions generated by the economic
stimulus, both directly and indirectly through flow-on activity, expressed in full time equivalent (FTE)
positions 2.
3.1.2 Modelling Drivers and Assumptions
3.1.2.1 Construction Phase
Construction costs outlined in section 2.2.1, including contingency and on-costs, were broken down into their
respective Input-Output industries. This breakdown was developed based on assumptions by AEC regarding the
most appropriate industries for the project, and an assumed value for each activity.
Table 3.1. Construction Costs by Input-Output Industry
IO Industry Proportion of $M
Total
Heavy and Civil Engineering Construction 80% $172.0
Construction Services 10% $21.5
Professional, Scientific and Technical Services 10% $21.5
Total 100.0% $215.0
Note: Totals may not sum due to rounding.
Source: Cairns Regional Council (unpublished a).
Of the above capital outlay, not all activity will be undertaken within the Cairns LGA economy. For example, some
professional service activities are likely to be sourced from capital city centres.
1
Both production induced (Type I) and consumption induced (Type II) flow-on impacts have been presented in this report. Refer to Appendix A for
a description of each type of flow-on impact.
2
Where one FTE is equivalent to one person working full time for a period of one year.
4CAIRNS WATER SECURITY – STAGE 1 PROJECT – ECONOMIC ANALYSIS
In terms of where activity will occur and goods and services are anticipated to be sourced from, the following was
assumed:
• 100% of construction activity (construction services and heavy and civil engineering construction) will occur
locally, but only 90% of this is assumed to be sourced from businesses and labour inside the region (i.e. 10%
of construction will be imported to the region). For businesses/ labour sourced from outside the region:
o Approximately 25% of purchases on goods and services (supply chain related activity) would be spent
within the local economy (i.e., 25% of the Type I flow on activity associated with non-local construction
companies is assumed to represent additional local activity in the Cairns LGA).
o Approximately 5% of wages and salaries paid to construction-related workers sourced from outside the
region would be spent on local goods and services, such as food and beverages (i.e., 5% of the Type II
flow on activity associated with non-local workers is assumed to represent additional local activity in the
Cairns LGA).
• Approximately 80% of the direct expenditure on professional scientific and technical services will be sourced
from local businesses and labour, with the remainder imported. It was conservatively assumed that, aside from
the on-site construction personnel, non-local suppliers engaged would not undertake any activity within the
Cairns LGA as a result of the development.
3.1.2.2 Operations
Operating activity has been modelled through two avenues:
• Operating activity – highlighting the direct operational expenditure of the project.
• Retention of visitor expenditure – without the project, there will need to be increased instances of water
restrictions, which will decrease the amenity of Cairns as a place to visit. It is assumed that there would
therefore be a reduction in visitor numbers due to capacity constraints of the current system. However, with
the project, it is assumed that the Cairns LGA will be able to reduce frequency and severity of water restrictions,
thereby retaining visitation levels and visitor spend.
Operating Activity
For modelling purposes, the operating estimates for the project (outlined in section 2.3) have been modelled as an
average annual estimate over the period of 20 years as per the table below. For modelling purposes in the Input-
Output assessment, the savings from solar/ hydro and Behana Creek have been excluded.
Table 3.2. Average Annual Operating Expenditure (Over 20 years)
Operating Cost Item $M
Power $1.84
Maintenance $1.95
Chemicals $0.43
Labour $0.54
Vehicles $0.02
Other $0.04
Total $4.81
Source: Cairns Regional Council (unpublished a).
The operational expenditure has been allocated to the Input-Output industry of water supply, sewerage and
drainage services. To best reflect the flow-on economic contribution of the development, the modelling has
examined the typical level of activity associated with the above non-labour operating costs, with the direct impacts
based on the information outlined in the table above. No surplus for the project operations has been assumed as
the project requires subsiding by Council (i.e., direct output of the project is assumed to equal the operating costs
of the project).
5CAIRNS WATER SECURITY – STAGE 1 PROJECT – ECONOMIC ANALYSIS
Retention of Visitor Expenditure
Without the project, water supply will become insufficient to meet demand in the near term leading to increased
instances of water restrictions to manage demand levels. The increasing use of water restrictions that would have
to be implemented is likely to lead to Cairns not having sufficient secure water resources to maintain the region’s
natural assets and visual amenity, and support the water demand of residents, businesses and its high volume of
visitors annually. It is noted that visitors typically have higher water use demands than residents (Marsden Jacobs,
2019).
As highlighted in the Marsden Jacobs study (2019), ‘travel agents and advisors may be less likely to recommend
Cairns as a premium tourist destination if it is perceived that water restrictions are likely to restrict or diminish the
experience of leisure options’ (p. 17). The study also highlights a potential reluctance for visitation to the region
with a perception of not wanting to worsen the situation for local residents and workers (Marsden Jacobs, 2019).
The Marsden Jacobs study quantified a potential loss of 10% and 20% in Gross Value Added (GVA) generated by
the Cairns tourism and hospitality sector due to water shortages. For the purposes of this assessment, a potential
decline in visitation (and visitor spend) to the Cairns LGA of 10% has been assumed without the project (see Table
3.3 below).
Table 3.3. Cairns LGA Visitation in 2019 and Reduction Without the Project
Visitation Type Year Ending 2019 (000’) 10% Reduction in Visitors (000’)
Domestic Day 1,442 144
Domestic Overnight 1,291 129
International 750 75
Total 3,484 348
Notes: Totals may not sum due to rounding.
Source: TRA (2021).
With the project however, capacity will no longer be constrained, and water restrictions will not be required to be
implemented. As a result, there is avoided loss in visitation and subsequent visitation expenditure.
These visitors spend a significant amount of money in the region each year. Below highlights the expenditure per
visitor, by visitor type. This expenditure has been retrieved from Tourism Events Queensland (TEQ, 2021) based
on the December 2019 survey for the Tourism North Queensland Region. 2019 has been used as reflective of a
more typical level of annual visitor demand, prior to the COVID-19 pandemic.
• Day trip - $130.9
• Domestic overnight - $1,130.7
• International - $1,272.2.
The table below highlights the estimated retained visitation expenditure that would occur each year from 2027.
Table 3.4. Retention of Visitor Expenditure (2027 Onwards) $M (Average Annual)
Input-Output Industry Domestic Domestic International Total ($M)
Day ($M) Overnight Overnight
($M) ($M)
Air and Space Transport $0.0 $0.0 $0.0 $0.0
Road Transport $0.3 $3.7 $3.0 $7.0
Rail Transport $0.0 $0.1 $0.1 $0.3
Water, Pipeline and Other Transport $0.1 $6.6 $6.8 $13.5
Accommodation $0.0 $43.8 $20.6 $64.4
Food and Beverage Services $5.5 $38.3 $16.9 $60.7
Retail Trade $10.6 $41.0 $18.7 $70.3
Personal Services $0.5 $0.9 $1.7 $3.0
Heritage, Creative and Performing Arts $0.5 $3.6 $1.4 $5.5
Sports and Recreation $0.5 $2.8 $0.8 $4.1
Gambling $0.1 $0.5 $0.6 $1.2
6You can also read