Business and Operating Environment 2.1 - Powerlink ...
←
→
Page content transcription
If your browser does not render page correctly, please read the page content below
Powerlink Queensland
                                                                          Chapter 2 Business and Operating Environment
 2023-27 Revenue Proposal

2.      Business and Operating Environment
2.1     Introduction
        This chapter sets out the key external drivers that currently impact Powerlink, or are expected to impact Powerlink, over
        the 2023‑27 regulatory period and beyond.
        This chapter builds on our Business Narrative which we developed early in our customer engagement process for our
        Revenue Proposal (refer Chapter 3 Customer Engagement and Appendix 2.01 Business Narrative).

         Key highlights
         y Affordability remains a key concern for customers. We recognise customers expect us to do what we can to ensure
           affordable services and value for money.
         y There are significant changes occurring in energy markets as we transition to a low-carbon future. Decarbonisation,
           decentralisation, demand disruption, and digitisation necessitate changes to our patterns of operation.
         y We are in an uncertain economic environment, driven primarily by COVID‑19, which has placed pressure on our
           business and also on our customers and stakeholders.
         y The level of uncertainty that exists means it is more difficult to forecast into the 2023‑27 regulatory period.
         y We have prepared our Revenue Proposal with regard to the business and operating environment factors in this
           chapter and have proposed expenditure forecasts and revenue requirements that reasonably reflect the efficient
           costs of a prudent operator and a realistic expectation of demand and cost inputs.
         y We consider our forecasts are capable of acceptance by our customers, the Australian Energy Regulator (AER) and
           ourselves.

2.2     Our approach
        Our business and operating environment continues to present challenges and opportunities for Powerlink. Our priority
        remains to deliver safe, secure, reliable and cost-effective electricity transmission services to our customers. We also see
        a shift in our focus to take a more active role in guiding the energy market in Queensland, during what is a highly dynamic
        and uncertain energy environment.
        We have identified six key business and operating environment drivers. These drivers influence our day-to-day business,
        as well as elements of our Revenue Proposal, and are discussed in further detail in the following sections. They are:
        y our customers;
        y COVID‑19;
        y the energy market;
        y the economy and financial markets;
        y government policy and regulation; and
        y the environment.

2.3     Customer drivers
        We are a foundation signatory to The Energy Charter and are committed to customer-focused responses to the
        challenges and opportunities that lie ahead. We are committed to being a customer-centric business and recognise this
        is an ongoing journey for the business. Our aim is to embed our customers’ needs, views and priorities in our day-to-day
        business activities, and in key decision-making such as the development of our Revenue Proposal.
        The following sections outline the three key customer drivers that have influenced our Revenue Proposal: affordability,
        price signals and customer choice. More detail on our engagement approach and response to customer feedback on our
        Revenue Proposal is included in Chapter 3 Customer Engagement.

2.3.1   Affordability
        The cost of electricity remains a key concern for customers. While our transmission network charges comprise around
        9% of the average residential household bill (refer Figure 2.1), our focus does not stop here. We will continue to influence
        the external environment to minimise overall system costs for electricity users. In particular, we are well placed to help
        facilitate lower cost bulk supply electricity production, while the market transitions to a lower carbon future.

                                                                                                                                   4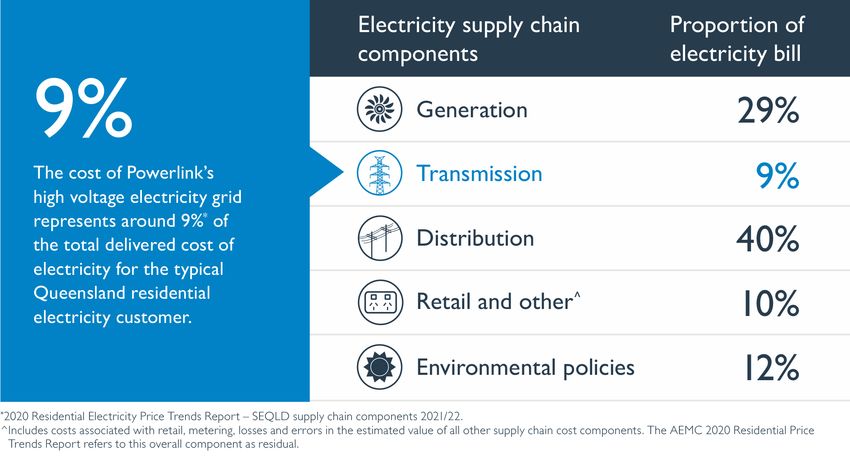
Powerlink Queensland
                                                                         Chapter 2 Business and Operating Environment
2023-27 Revenue Proposal

     Figure 2.1:   Breakdown of typical Queensland household electricity bill

     Customers expect us to do what we can to ensure affordable services and value for money. Over the current 2018‑22
     regulatory period we are responding to customer affordability concerns, through the forecast delivery of a 35% decrease
     in capital expenditure and a 7% decrease in operating expenditure compared to the 2013-17 regulatory period.
     During the current regulatory period, our Regulatory Asset Base (RAB) has declined in real and nominal terms. In
     the 2023‑27 regulatory period we expect this trend to continue as a result of our forecast 3% decrease in capital
     expenditure. This demonstrates the prudency of our approach to asset management, which is discussed further in
     Chapter 5 Forecast Capital Expenditure.
     We have also proposed a target of no real growth in operating expenditure for the 2023‑27 regulatory period. This
     will be a challenge for our business to meet, but is the right approach in the context of affordability and the current and
     mid-term economic climate, and was directly influenced by feedback from our customers on affordability concerns. We
     discuss this further in Chapter 6 Forecast Operating Expenditure.
     We recognise our impact on customer affordability is not limited to the prices we charge for transmission services. As the
     platform that connects electricity generators with electricity customers, we play a key role in ensuring customers have
     access to the lowest cost electricity, when they need it. Constraints and congestion on the transmission network can lead
     to higher wholesale prices as more expensive generation is required to operate to meet customer demand.
     As part of the economic assessment for major new transmission network investments, we analyse these potential
     benefits of improved operation of the wholesale market. In this way we seek an appropriate overall outcome for
     everyone who produces, transports and consumes electricity. We also support the goal of co-optimisation of generation
     and transmission development in the long-term interests of customers.
     We also have regard to Australian Energy Market Operator’s (AEMO’s) Integrated System Plan (ISP), which presents
     an integrated approach to the development of renewable energy resources in the National Electricity Market (NEM)
     and a roadmap for Australia’s eastern power system for the next 20 years. While the aim of the ISP is to set out a
     long-term optimal development path for the NEM, its success depends on the market’s confidence in that plan. In
     particular, this requires demonstration of a development process that is robust, transparent and enabled by effective
     stakeholder engagement. As customers are expected to pay for significant system investments over the next 20 years,
     it is important to have transparency around the robustness of AEMO’s analysis, the efficiency of costs and the impact
     on customers.
     It is not in the best interests of our customers for electricity prices to reflect allowances that include costs for projects
     or initiatives whose scope, timing and/or cost remains uncertain. For this reason, we pursued the concept of contingent
     reinvestment projects in the development of our Revenue Proposal. The reason we pursued this was to ensure the cost
     of these uncertain but probable projects was not borne by customers within the ex-ante capital expenditure allowance
     and hence the revenues determined by the AER up-front.

                                                                                                                                     5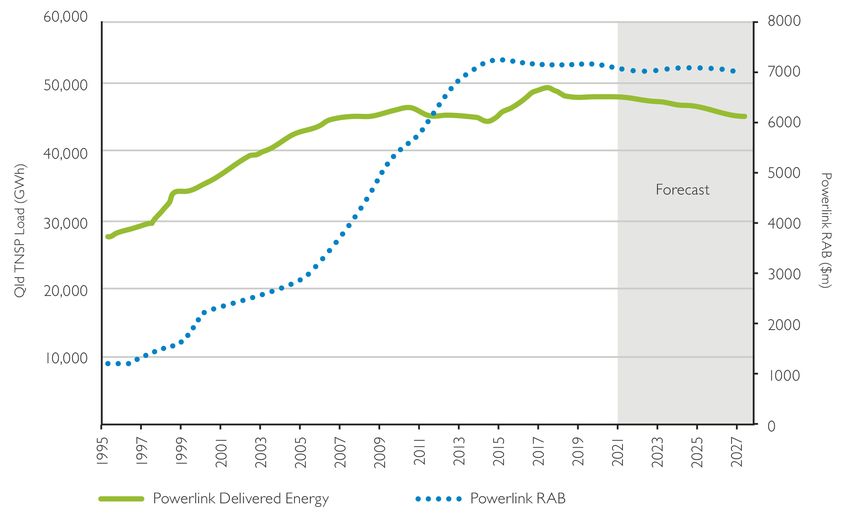
Powerlink Queensland
                                                                           Chapter 2 Business and Operating Environment
 2023-27 Revenue Proposal

        Feedback from customers, the AER and the AER’s Consumer Challenge Panel (CCP23) on the concept of contingent
        reinvestments primarily related to a concern that the triggers associated with contingent reinvestment may not be
        ‘objectively verifiable’1, which is a key requirement for contingent projects, and that further engagement on this point
        between Powerlink, customers and the AER is needed. Based on this feedback, we ultimately decided not to include
        any contingent reinvestment projects in our Revenue Proposal. However, we consider that the concept of contingent
        reinvestment projects remains appropriate and will seek to pursue this concept outside our Revenue Proposal process.
        The commitment we have made to The Energy Charter is to make ourselves accountable to our customers across all
        aspects of our operations, which includes improved energy affordability. Consistent with that commitment, we have
        worked to ensure that our forecast expenditure for the 2023‑27 regulatory period is prudent, efficient and essential
        to the delivery of safe, secure and reliable electricity supply.

2.3.2   Price signals
        We understand that our directly-connected customers want price signals that better reflect the costs of using our
        network at different times and in different locations. Such changes could also potentially benefit all customers over
        the long-term, as more cost reflective price signals incentivise more efficient use of the network. This in turn can ease
        pressure on the network in periods of high demand, and therefore reduce future network costs.
        We also know our customers are changing the way they use our network, as transformational changes take place
        throughout the energy system. To help identify where we could improve our transmission pricing arrangements, we
        have undertaken consultation on these issues to inform our Proposed Pricing Methodology.
        As a result of this consultation, we have proposed one key amendment to our existing Pricing Methodology. This
        amendment will progressively transition customers locational charges to be based on peak demand only. This transition
        will occur over the next two regulatory periods (or 10 years), commencing 1 July 2022.
        Chapter 16 Pricing Methodology discusses our consultation and Proposed Pricing Methodology changes in further detail.

2.3.3   Customer choice
        Customers want a greater say in how they access, use and pay for electricity as our energy system transitions. Consistent
        with trends across all aspects of our daily lives, a ‘one size fits all’ model is not appropriate. Technologies such as
        Distributed Energy Resources (DER), battery storage and smart home automation systems have the potential to
        fundamentally transform the way households and communities manage their energy needs. This necessitates flexibility
        and adaptability in responding to these different needs, which could also change through time.
        Delivery of a more flexible network has implications for our business. For example, the operation of our network is
        more complex due to added power system security constraints. We are exploring innovative technology applications to
        improve the flexibility of our operating practices in response to market changes, such as the use of Phasor Monitoring
        Units (PMUs) to improve our ability to monitor and respond to the changing characteristics of the power system as more
        Inverter-Based Resources (IBR) connect to the network.
        The implications of the changing energy market for our business is explored further in Section 2.5.

2.4     COVID‑19
        Additional challenges have been presented by the COVID‑19 pandemic, not only for Powerlink but for our customers
        and stakeholders. It is impossible to predict the likely path and duration of the pandemic.
        Our first and foremost commitment during the pandemic is the protection of the health, safety and wellbeing of our
        people, contractors and the communities in which we operate. The adversity of responding to COVID‑19 has also
        provided further impetus for us to develop and implement new ways to manage our business and respond to challenges,
        as well as opportunities for innovation.
        We have summarised the impacts of the pandemic on our business that have occurred, and/or could impact us in the
        2023‑27 regulatory period, in Table 2.1.

        1
            National Electricity Rules, clause 6A.8.1(c).

                                                                                                                                    6
Powerlink Queensland
Chapter 2 Business and Operating Environment
2023-27 Revenue Proposal
Table 2.1: COVID‑19 impacts
Area Impact
Affordability We recognise that COVID‑19 has had and may continue to have a very significant impact on the livelihoods
and economic security of our customers.
Affordability of supply for our customers during these uncertain economic times is a key goal of ours. For
the remainder of the current regulatory period, this means that we must manage our capital and operating
expenditure within the AER’s allowance.
For the 2023‑27 regulatory period, we have proposed no real growth in our operating expenditure and a
3% reduction in our capital expenditure compared to actuals/forecast in the current regulatory period as
two key measures to respond to customer concerns about affordability.
Engagement We have adjusted our engagement approach (e.g. greater use of digital technology) to be able to effectively
conduct our consultation remotely. This has occurred for our business-as-usual engagement, and for
engagement on our Revenue Proposal.
We think this approach has been successful, all things considered. We will look to integrate greater
digital engagement, along with more traditional face-to-face engagement, post-COVID to enable wider
engagement from customers and stakeholders across Queensland.
Economic impacts COVID‑19 has had significant and pervasive impacts on both the domestic and global economies. These
impacts affect our customers, suppliers and the broader communities in which we operate. Australia has
fared comparatively well and recent economic data has been better than previously expected(1). However,
the economic recovery path remains uncertain and impacts include:
• Economic activity: Queensland experienced a 5.9% fall in domestic economic activity in the June
quarter of 2020. However, the State budget notes that Queensland has fared better than other states.
It forecast flat Gross State Product (GSP) to 2020/21, which is expected to rebound in 2021/22. It also
forecast average unemployment of 7.5% in 2020/21 will improve steadily over the coming years, falling
to 6.5% by 2022/23(2).
• Inflation: we have observed a volatile and low/negative inflation environment in 2019/20 and so far in
2020/21. Inflation is a key input across a number of elements of our Revenue Proposal and persistently
low, volatile or negative periods of inflation mean this is a difficult input to accurately forecast in the
current environment (refer Chapter 9 Rate of Return, Taxation and Inflation).
• Interest rates: COVID‑19 has impacted Government bond yields (i.e. the risk-free rate), as well as the
debt risk premium. This has contributed to a significant reduction in our rate of return between the
current and next regulatory periods, which impacts on our overall financial sustainability (refer
Chapter 9 Rate of Return, Taxation and Inflation).
• Wages growth: we anticipate COVID‑19 to have an impact on wage growth and the Wage Price Index
(WPI), which is a key trend factor for operating expenditure. This is discussed further in Chapter 7
Escalation Rates and Project Cost Estimation.
Demand and energy AEMO has observed short-term reductions in both peak demand and energy consumption as living and
working habits changed across Australia. These factors cast a degree of uncertainty on electricity demand
forecasts in the short-term, acknowledged by the AEMO’s 2020 Electricity Statement of Opportunities
(ESOO)(3).
Capital expenditure COVID‑19 has caused delays in the delivery of network capital expenditure in 2019/20 and may also result
in further delays into 2020/21. At this time we anticipate that we will be able to catch-up some of this delay
during 2021/22. This is discussed further in Chapter 4 Historical Capital and Operating Expenditure.
Operating expenditure We have adjusted maintenance practices in 2019/20 in response to the pandemic and some routine
maintenance activities have been replaced with condition-based maintenance activities, particularly in areas
where it was possible to travel.
The main impact from COVID‑19 on operating expenditure has been in the balance of expenditure
between categories. This has influenced the choice of our operating expenditure base year (refer Chapter 6
Forecast Operating Expenditure).
Insurance Our insurance brokers, Marsh, have highlighted the unprecedented impact of COVID‑19 on the global
insurance industry(4). This includes significant potential upward pressure on premiums, which we will need to
actively manage in the 2023‑27 regulatory period (refer Chapter 6 Forecast Operating Expenditure).
(1) Statement on Monetary Policy November 2020, Reserve Bank of Australia, page 1.
(2) Queensland Budget 2020-21, Queensland Government, December 2020, pages 34-35.
(3) 2020 Electricity Statement of Opportunities, Australian Energy Market Operator, August 2020.
(4) Minutes of the June 2020 Revenue Proposal Reference Group (RPRG) meeting, https://www.powerlink.com.au/2023‑27-regulatory-period.
7Powerlink Queensland
Chapter 2 Business and Operating Environment
2023-27 Revenue Proposal
2.5 Energy market drivers
As the NEM continues to transition towards a new energy future, we must navigate a highly dynamic and uncertain
environment. The transmission system has changed from one which transports electricity from a small number of large
centralised generators to major loads and distributors, to a system that interconnects increasing numbers of generators,
loads and storage and transports energy to where it is needed. More homes and businesses also generate their own
power through DER technology.
Our annual stakeholder perception survey, undertaken by Deloitte, surveyed 115 of our customers and stakeholders.
A summary of the results of this survey for 2020 is included in Appendix 3.06. The survey found that the rapidly changing
energy system is a primary concern. A key issue for many of our generator and directly-connected customers was the
management of an energy system in transition, in particular system strength. We intend to take a more active role
in guiding the Queensland market through this transition. We will adopt an increased focus on planning the broader
energy system (generation, energy storage and transmission), undertake more proactive engagement with AEMO and
Queensland market participants on key issues and risks in the energy transition, and provide increased support for the
Queensland Government in the formulation of future energy policy.
Between 2018 and 2020, we developed our 30 year Network Vision2 with input from customers, stakeholders and
energy industry experts. The aim of our Network Vision is to provide a long-term view across a range of plausible
scenarios and understand what services future customers will value. Our Network Vision has informed our Revenue
Proposal.
We have further developed the broad themes of our Network Vision – changing electricity consumption patterns,
a lower carbon future and decentralised energy sources – into the ‘four Ds’ discussed in this section:
y decarbonisation;
y decentralisation;
y demand disruption; and
y digitisation.
2.5.1 Decarbonisation
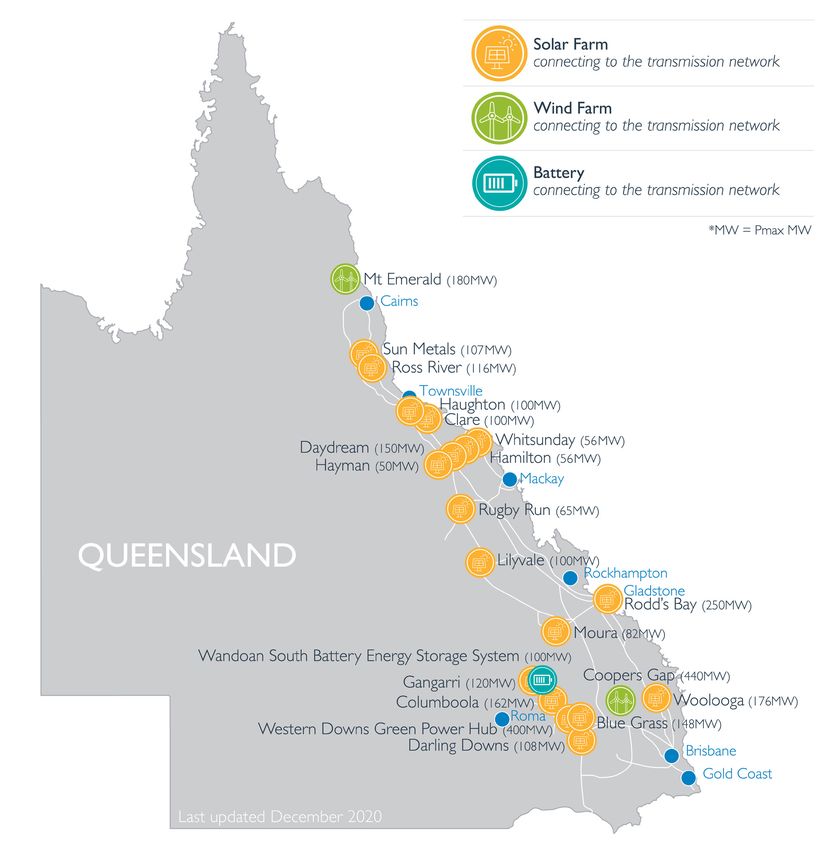
Queensland is in transition to a low carbon future. More than 1,600MW of large-scale renewable generation capacity has
been added to the transmission network since 2016. In addition, more than 3,000MW of rooftop solar has been installed
at the distribution network level across Queensland.
Figure 2.2 shows the number of completed and committed transmission-connected renewable generation projects as
at December 2020. This is provided as context and it is important to note these are non-regulated projects and are
therefore not included in our Revenue Proposal expenditure forecasts.
2
Network Vision, Powerlink, https://www.powerlink.com.au/network-vision.
8Powerlink Queensland
Chapter 2 Business and Operating Environment
2023-27 Revenue Proposal
Figure 2.2: Transmission connections – solar, wind, battery
A higher proportion of renewable generation presents technical challenges in keeping electricity supply and demand
balanced, and creates complexity in how we operate and plan the network.
We are involved in joint planning with Distribution Network Service Providers (DNSPs) Energex and Ergon Energy on
generator connections within the distribution network that may impact transmission network performance or constraints.
System strength has emerged as a prominent challenge in Queensland (particularly in North Queensland) as well as
other parts of the NEM. We are working with customers, regulators, project proponents, suppliers and AEMO to
identify, understand and appropriately respond to these challenges.
We have also had regard to AEMO’s 2020 ISP. There are currently no ‘actionable’ projects within the 2023‑27
regulatory period under AEMO’s ISP. However, one of the key projects identified in the ISP that is currently targeted for
completion around 2032 is Queensland/New South Wales Interconnector (QNI) Medium, which involves upgrades to
the QNI. Construction of this project would need to commence in the late 2020s, which requires the acquisition of new
transmission line easements in the 2023‑27 regulatory period (refer Chapter 5 Forecast Capital Expenditure).
9Powerlink Queensland
Chapter 2 Business and Operating Environment
2023-27 Revenue Proposal
2.5.2 Decentralisation
The change in generation mix creates challenges in the operation of our network. Rapid installation of renewables and
the forecast closure of ageing coal generation assets across the NEM have driven large changes in power flows across the
network, as seen in trends in flows over time in Figure 2.3. This introduces a high degree of uncertainty around the need
for investment in major transmission network flow paths.
Figure 2.3: Average annual power flow across major transmission flow paths (MW)
2,000
1,800
1,600
1,400
1,200
MW
1,000
800
600
400
200
0
2005 2006 2007 2008 2009 2010 2011 2012 2013 2014 2015 2016 2017 2018 2019 2020
Central Queensland to South Queensland Central Queensland to North Queensland South West Queensland Surat
The increasingly constrained network flow from Central Queensland to Southern Queensland (CQ-SQ) is an example
of the level of uncertainty that exists and the difficulties we face in planning the network. As shown in Figure 2.3, power
flow gradually declined until 2014. Since then CQ-SQ has seen a significant increase in power flows, driven by the
investment in new renewable generation in North Queensland.
This part of the network now experiences regular capacity constraints, which means the cheapest sources of electricity
cannot always be delivered to customers. Electricity market constraints also impact our ability to effectively manage
necessary outages on the network in a way that minimises impacts to network users. A reduced window to schedule
outages places pressure on how and when we can deliver capital works, and operate and maintain the network.
An upgrade of the CQ-SQ network is flagged for the early 2030s in AEMO’s 2020 ISP. However, subsequent renewables
development in southern Queensland or northern New South Wales (NSW) could again fundamentally shift
intra-connector flows. Given the uncertainty related to the investment need for CQ-SQ and the timing of any investment
need being potentially late in the 2023-27 regulatory period or early in the following regulatory period, our Revenue
Proposal includes some (limited) capital expenditure for targeted life extension works on this part of the network.
The CQ-SQ network is a key example of why we consider the concept of contingent reinvestments should be pursued
further, outside the current Revenue Proposal process. The rapid changes occurring through the energy transition can
make it highly uncertain whether existing network capacity along major transmission flow paths should remain the same,
be increased, or even be reduced, which must be considered as part of any potential asset reinvestment along those flow
paths. Rather than ask customers to pay for investments that remain highly uncertain, we would have a mechanism to
seek approval from the AER should such expenditure be required to maintain the safe, secure, reliable and cost-effective
supply of electricity within the regulatory period.
It is clear that as we transition to this new energy future, investment will need to take a ‘whole of system’ perspective.
This will require greater coordination of investment strategies between generation, transmission and distribution
businesses to deliver appropriate outcomes for our customers.
10Powerlink Queensland
Chapter 2 Business and Operating Environment
2023-27 Revenue Proposal
2.5.3 Demand disruption
Solar uptake at a household level continues to drive changes to our demand and energy patterns. Overall, while energy
consumption is declining, several key trends have been observed across our network.
Higher and shorter demand peaks
Maximum demand is expected to grow at 0.7% per annum over the next 10 years3 (refer Chapter 5 Forecast Capital
Expenditure). Increases in peak demand puts pressure on the maximum capacity of our network, which would
traditionally necessitate network augmentation investment. However, the short duration and low frequency of these
maximum demand events makes network augmentation uneconomic.
This reduction in demand-driven investment has occurred in the current regulatory period, and is expected to continue
in the 2023‑27 regulatory period. We have proposed only one capital project (estimated at $2.4m) driven by increased
maximum demand in our Revenue Proposal.
Decline in minimum demand
Demand during the day has reduced to levels (currently approximately 3,500MW) that impact on the technical capability
for daytime baseload generation to operate. This is driven by the increased deployment of DER, which includes
large-scale photovoltaic (PV) generation connected to distribution networks and customer rooftop PV. AEMO forecasts
that minimum operational demand is expected to continue to fall by 1.9% per annum in Queensland between 2021
and 2040 4.
While minimum demand has declined and will continue to decline, significant transmission connected generation is
still required to meet peak demand. These opposing factors mean it is increasingly difficult to determine the optimal
investment strategy (e.g. life extension, replacement or other reinvestment options) for some transmission network
assets, or whether they could potentially be decommissioned.
Figure 2.4 demonstrates these inverse trends.
Figure 2.4: Trends in Maximum and Minimum Delivered Demand in Queensland (MW)
9,000
8,000
7,000
MW
6,000
5,000
4,000
3,000
2013‐2014 2014‐2015 2015‐2016 2016‐2017 2017‐2018 2018‐2019 2019‐2020
Minimum Delivered Demand (MW) Maximum Delivered Demand (MW)
In the near-term, this rate of decline in minimum demand could be greater than the long-term average as Queensland
continues to experience rapid uptake of rooftop solar PV systems, particularly from larger sized commercial installations.
An increased spread between minimum and maximum demands is likely to present operational challenges for both
AEMO and network businesses in managing the demand for various forms of system services.
3
2020 Electricity Statement of Opportunities, Australian Energy Market Operator, August 2020.
4
Ibid, page 43.
11Powerlink Queensland
Chapter 2 Business and Operating Environment
2023-27 Revenue Proposal
As battery storage technology further develops, it also has the potential to flatten electricity usage and reduce the
need to develop transmission services to cover short duration peaks. We may also see an increase in the application of
batteries to reduce residential demand peaks as customers take advantage of storage to smooth their consumption and
avoid peak retail tariffs. Government policy, retail offerings, development of community storage or large-scale storage and
demand response are also factors that may influence minimum demand in the future.
For Powerlink, the issue of an increased spread between minimum and maximum demands is driving the need to install
additional reactive power control devices to maintain power system voltages within secure limits. Our capital expenditure
forecast includes $22.4m in investment for these devices to support prescribed transmission services (refer Chapter 5
Forecast Capital Expenditure).
If the decline in minimum demand turns out to be materially greater than is currently forecast by AEMO it could
necessitate further investment in the provision of system services for prescribed purposes. This could be either through
direct investment in new assets, or through mechanisms such as cost pass through arrangements and contracts for
network support services (refer Chapter 12 Pass Through Events). Relevant capital investments will also be subject to
the AER’s Regulatory Investment Test for Transmission (RIT-T).
Decline in delivered energy
Total delivered energy is expected to decline at an average annual rate of 0.7% over the next 10 years5 (refer Chapter 5
Forecast Capital Expenditure). This is primarily due to current and proposed large-scale renewable generation that is
(or will be) directly‑connected to the distribution network.
In line with flat or declining forecasts of delivered energy, our RAB has decreased in both nominal terms and real terms in
the current regulatory period6 .
In the 2023-27 regulatory period, we forecast our RAB to continue to decrease in both nominal and real terms7 (refer
Chapter 8 Regulatory Asset Base). Our proposed reduction in capital expenditure has contributed to this decrease, and
we consider the trend in our RAB provides a reasonable indication of our prudent asset management and reinvestment
approach.
Figure 2.5: Powerlink forecast delivered energy (GWh) versus RAB ($m nominal)
5
2020 Electricity Statement of Opportunities, Australian Energy Market Operator, August 2020.
6
Based on a comparison of 1 July 2017 opening RAB to 30 June 2022 closing RAB.
7
Based on a comparison of 1 July 2022 opening RAB to 30 June 2027 closing RAB.
12Powerlink Queensland
Chapter 2 Business and Operating Environment
2023-27 Revenue Proposal
2.5.4 Digitisation
The growth in the number and interconnectedness of digital sensors and mobile devices is often referred to as the
Fourth Industrial Revolution 8 . The first and second industrial revolutions entailed the harnessing of mechanical and
electrical energy to replace manual work. The third industrial revolution harnessed the power and cost benefits of digital
technologies to collect data from the real, analogue world and transform it into digital form. Once in digital form the
data can be assembled and communicated at near zero cost and provides the basis for improvements in production and
operations processes.
The transformation of data into information and then insights can improve business decision-making and reduce risks
to our customers. Our investments in Business Information Technology (IT) and Operational Technologies are made to
ensure we can deploy and access enhanced digital data analytics to support the business and the provision of services to
customers. This includes digital interfaces with our customers, our suppliers and AEMO.
Our key business initiatives that support this increase in digitisation are:
y Next Generation Network Operations (NGNO) – our program to modernise our network operations and be able
to adapt to the changing energy landscape. A foundational element is a new advanced Energy Management System to
support our real-time operations.
y Systems, Applications, Products (SAP) Transform – the replacement of our legacy Enterprise Resources Planning
system will support increasing digitisation and automation of routine business processes.
2.6 Economic and financial market drivers
The COVID‑19 pandemic is currently the dominant influence on the economy and financial markets and remains the main
source of uncertainty for the economic growth outlook.
The Reserve Bank of Australia (RBA) describes the COVID‑19 pandemic as the largest shock to the global economy
in many decades9. The RBA recently observed that the 7% contraction in Gross Domestic Product (GDP) in the June
quarter was the largest and one of the most sudden in peacetime since the 1930s10. It has also resulted in significant
disruption to the labour market. While labour market conditions have also improved, the RBA expects significant excess
capacity to remain. This will continue to drive low wages growth and inflation.
The global economy, along with Australia, is currently in the early stages of recovery, although the RBA sees this as fragile
and uneven11. Given the extreme uncertainty that has arisen from the pandemic, the RBA considers the outlook in
terms of three scenarios. Under its baseline scenario, the economy is forecast to contract by around 4% for the year to
December 2020, followed by growth of 5% in 2021 and 4% in 2022. Unemployment is forecast to peak at 8% by the end
of 202012. The RBA scenarios for GDP growth and unemployment are shown in Figure 2.6.
Figure 2.6: RBA scenarios: GDP and unemployment (Australia)
GDP Unemployment Rate
Forecast scenarios
Forecast scenarios, December 2019 = 100
% Forecasts %
index Forecasts index
9 9
105 105
8 8
100 100 Upside/
Baseline Downside
7 7
95 95
Upside/
Actual
Actual Baseline Downside
90 90 6 6
85 85 5 5
80 80 4 4
2014 2016 2018 2020 2022 2014 2016 2018 2020 2022
Source: Statement on Monetary Policy November 2020, Reserve Bank of Australia, pages 81-82
8
The Fourth Industrial Revolution – What it means and how to respond, Klaus Schwab, Foreign Affairs, December 2015.
9
Statement on Monetary Policy August 2020, Reserve Bank of Australia, page 1.
10
Statement on Monetary Policy November 2020, Reserve Bank of Australia, page 1.
11
Ibid, page 79.
12
Ibid, page 1.
13Powerlink Queensland
Chapter 2 Business and Operating Environment
2023-27 Revenue Proposal
In the Queensland Budget 2020/21, the Queensland Government forecast a marginal increase of 0.25% in GSP in
2020/21, a rebound to 3.5% growth in 2021/22 and then a return to longer-run growth potential of around 2.75%
per annum13. This assumes that COVID‑19 remains contained.
Overall, this highlights considerable uncertainty domestically and globally. This outlook has had a direct impact on the
demand for electricity in the short-term, which may continue into the medium and long-term. It has also impacted key
assumptions that underpin our Revenue Proposal such as inflation, labour cost escalators and elements of our rate
of return.
We are also mindful of the impact of COVID‑19 and the current economic climate on affordability, which is discussed
in sections 2.3.1 and 2.4. More broadly, a sustained low economic growth environment could impact the financial
sustainability of our suppliers and supply chains, thus impacting our ability to deliver projects on time and on budget.
A delivery and skills resource risk is also expected over the 2023‑27 regulatory period. Australia has a limited pool of
skilled labour for large electricity infrastructure investments, and there is a potentially significant period of transmission
work to occur across the NEM. This is particularly the case if proposed projects in the 2020 ISP proceed as planned, in
addition to the replacement of older transmission network infrastructure that needs to occur in the next decade. This
will coincide with major infrastructure investment across the economy.
This work is in addition to existing capital and operating expenditure work. We have engaged with other Transmission
Network Service Providers (TNSP) as to how this risk can be managed, which could include:
y development of project timelines and resource requirements by skill sets;
y management of the balance between internal and external resources, as well as augmentation versus replacement
works; and
y identification of the need for increased levels of specific skills, which can be addressed by apprenticeships and training
programs.
Competition for scarce resources may influence the cost of our projects, in particular capital projects, and we will need
to manage this impact if it arises.
2.7 Government policy and regulation
This section outlines potential changes in our regulatory environment and the potential impact of government policies
on our Revenue Proposal.
2.7.1 Energy market regulation
Key regulatory consultations underway that could significantly impact the provision of electricity transmission services
include the Coordination of Generation and Transmission Investment reforms, the Energy Security Board’s Post 2025
Market Design, Transmission Ring-Fencing Review and the Energy Security Board’s consultation on planning rules for
Renewable Energy Zones (REZs). The outcome of the AER’s review of its regulatory treatment of inflation is also
important as it will impact our revenue and prices within the regulatory period.
The outcomes of these regulatory reforms could have material impacts on our operations, such as changes to funding
models for future network investment and the way revenue is collected. Until the outcomes from these reviews are
finalised, it is unclear how they may impact our regulatory and other obligations going forward. For example, the
AER’s review of its Transmission Ring-Fencing Guideline could fundamentally impact the way in which we deliver our
transmission services.
Until such time as we know the scope and scale of any changes to the existing arrangements, it will be difficult to estimate
the cost impacts on the business. As a result, we have not allowed for this in our operating expenditure forecast (refer
Chapter 6 Forecast Operating Expenditure). If material costs are likely to be incurred, we may seek a cost pass through
within the regulatory period (refer Chapter 12 Pass Through Events).
2.7.2 Federal and Queensland Government policies
Government energy policies establish broad frameworks that can have important implications for market participants
and customers (e.g. the Queensland Government’s 50% Renewable Energy Target or the Federal Government’s Low
Emissions Technology Statement 2020). Key policies and decisions that may impact our Revenue Proposal are outlined in
the following section.
13
Queensland Budget 2020-21, Queensland Government, December 2020, page 40.
14Powerlink Queensland
Chapter 2 Business and Operating Environment
2023-27 Revenue Proposal
Federal Government
There are two Federal Government policies that have been considered as part of our Revenue Proposal:
y the progressive increase to the Superannuation Guarantee rate which is currently targeted to reach 12% from
1 July 2025, which could impact our labour costs and WPI forecasts (refer Chapter 7 Escalation Rates and Project
Cost Estimation); and
y the Security Legislation Amendment (Critical Infrastructure) Bill 2020, which was introduced to Parliament in
December 2020 but has not yet passed, would establish a new security and resilience regulatory regime on operators
of critical infrastructure. We anticipate additional security (including cyber security) obligations for critical infrastructure
providers as a result of this new legislation (refer Chapter 6 Forecast Operating Expenditure).
Queensland Government
The Queensland Government has committed to a 50% Renewable Energy Target (RET) by 2030 and has made recent
energy policy announcements that focus on regional development, investment to support energy security and COVID-19
economic recovery. This includes potential investment in transmission infrastructure, such as:
y support for Genex’s 250MW Kidston pumped storage hydro project14;
y support for Copperstring 2.0, which would connect the North West Minerals Province to the national grid15; and
y other projects that will contribute to the achievement of the Queensland Government’s 50% RET. This includes its
$145m announcement to unlock three renewable energy corridors in North, Central and South West Queensland16
and a further $500m to support Renewable Energy Zone (REZ) Development17.
These initiatives largely rely on market-based responses and do not directly impact our Revenue Proposal. If these
investments proceed, they may trigger a need for investment in the prescribed network in the future. However, we have
not included any associated expenditure in our forecasts.
We are working with the Queensland Government to understand and progress these initiatives as appropriate
and required.
2.8 Environment drivers
Extreme weather events such as cyclones, bushfires and floods create challenges for the operation of the transmission
network. The nature, frequency and impact of these events remain extremely difficult to predict and the risks vary across
our network. Our approach is to design and construct our assets to be resilient against forecast risks, consistent with
prevailing standards and to an extent that is prudent and efficient.
Our network has not been materially impacted to date by recent bushfires or other severe weather events like networks
in New South Wales, Victoria and South Australia. We have not forecast capital expenditure to address general
weather-related risks over the 2023‑27 regulatory period.
In relation to operating expenditure, extreme weather events in Australia and across the world have placed upward
pressure on our insurance premiums. We engage directly with insurance underwriters to ensure they understand the
circumstances related to our business to advise appropriate insurance policies, excess levels and premiums. We have also
consulted on this with our customers and the AER in the development of our Revenue Proposal. Further information on
our proposed approach to insurance is provided in Chapter 6 Forecast Operating Expenditure.
2.9 Summary
We are operating in an environment of uncertainty, driven by significant changes in the energy market, the COVID‑19
pandemic and potentially long-lasting effects on the national economy. Our customers remain concerned about
affordability, and so do we.
We have had regard to our external environment in the development of our capital and operating expenditure forecasts,
and the financial elements of our Revenue Proposal. We have actively engaged with our customers to understand their
needs, priorities and concerns, and these are reflected in our business and operating environment.
14
Statements/88279, Queensland Government, https://statements.qld.gov.au/statements/88279.
15
Statements/89847, Queensland Government, https://statements.qld.gov.au/statements/89847.
16
Queensland Renewable Energy Zones, Department of Natural Resources, Mines and Energy,
https://www.dnrme.qld.gov.au/energy/initiatives/queensland-renewable-energy-zones.
17
Statements/90683, Queensland Government, https://statements.qld.gov.au/statements/90683.
15You can also read