CATS: Measuring Clouds and Aerosols from the International Space Station
←
→
Page content transcription
If your browser does not render page correctly, please read the page content below
National Aeronautics and Space Administration

CATS: Measuring Clouds and Aerosols
from the International Space Station
Acknowledgements

 CATS
 cats.gsfc.nasa.gov

 The CATS instrument is funded by the International Space Station NASA Research
 Office with supplemental funding for research from NASA’s Earth Science Division. A
 special thanks is given to both parties and to the CATS science team for making this
 publication possible.

 Content: Heather Hanson, Matt McGill, John Yorks
 Design: Debbi McLean
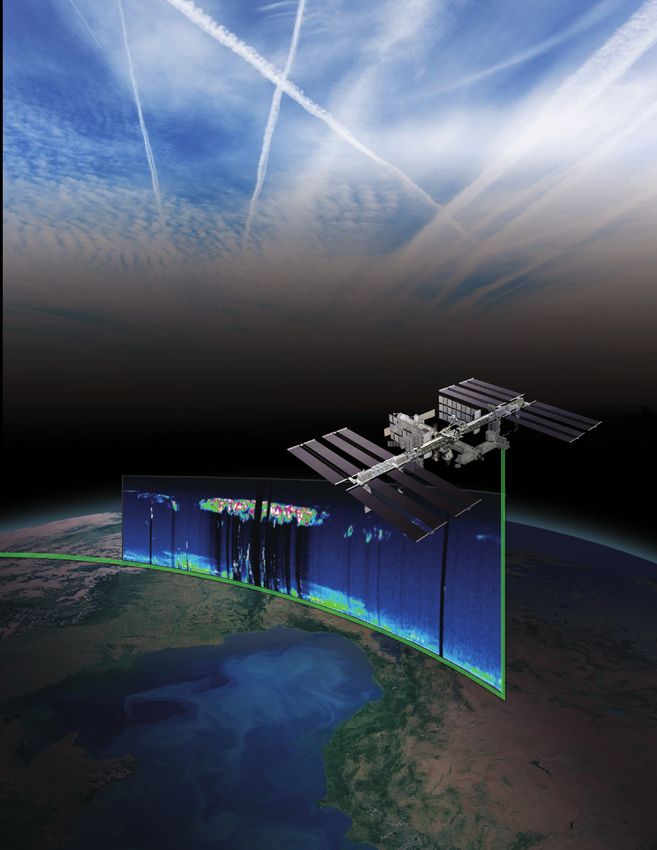
Table of Contents

  Clouds, Aerosols, and Earth’s Climate ............................................... 2

  Measuring Clouds and Aerosols ........................................................ 4

  Mission Overview .............................................................................. 6

  Instrument Overview ........................................................................ 8

  Launch and Installation ................................................................... 10

  Benefits to Society and Technology ................................................ 12
Clouds, Aerosols,
and Earth’s Climate
From space, streaks of white clouds can be seen
swirling across Earth’s surface. In addition to
clouds, other tiny solid and liquid particles, invis-
ible to our eyes, called aerosols are also swirling
Clouds and aerosols reflect
around in Earth’s atmosphere. Aerosol particles
about a quarter of the sun’s are both natural and man-made, and include
energy back to space; however windblown dust from deserts, sea salt, smoke
from wildfires, sulfurous particles from volcanic
their impact on Earth’s global eruptions, and sulfurous and carbonaceous par-
energy budget and climate is ticles produced by fossil fuel combustion.
not yet fully understood due to Clouds and aerosols play an important role in
Earth’s climate system because they reflect and
complex interactions between
absorb radiation from the sun differently. For
clouds and aerosols. example, when the sun’s energy reaches the top of
the atmosphere, clouds tend to reflect incoming
sunlight, cooling Earth’s surface. However, clouds
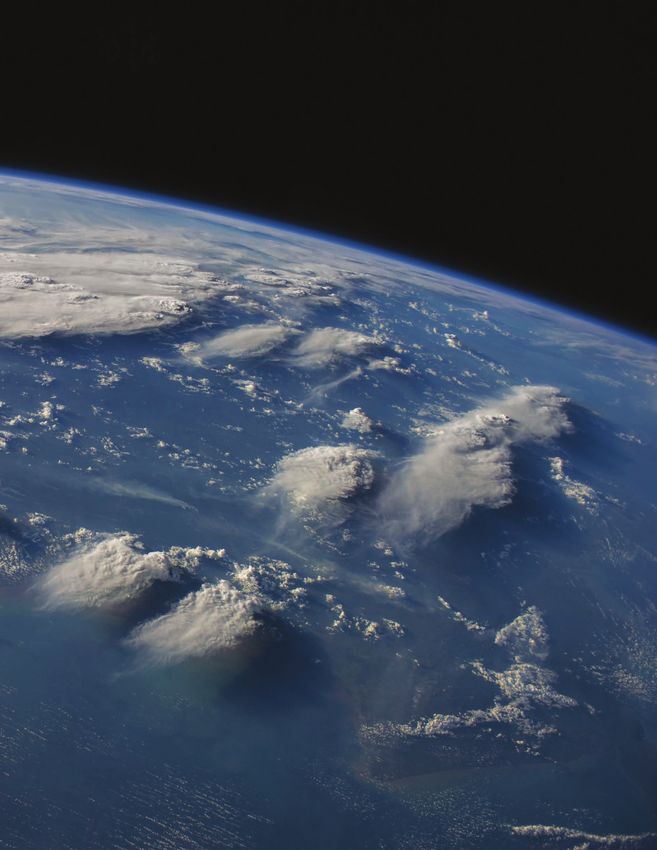
The interactions between clouds and aerosols are
also tend to absorb heat emitted from the surface
illustrated in this image, taken by retired astronaut
and re-radiate it back down, warming Earth’s
Chris Hadfield onboard the International Space
surface. Therefore, the amount of warming or Station, showing contrails produced by aircraft (bright
cooling is heavily dependent on the height, thick- streaks) over the ocean. In the absence of aircraft
ness, and structure of clouds in the atmosphere. exhaust, natural aerosols are required to seed upper
Aerosols—depending upon their size, type, and tropospheric ice cloud particles. Image credit: NASA/
location—can also either cool the surface, or Chris Hadfield
Why Do We Need
12 km
Vertical Information?
Aircraft Contrails
Different types of clouds and
9 km
aerosols can be found at varying Ash
heights in the atmosphere and
depending on their properties 6 km Clouds
and location, they can have
Smoke
varying radiative effects on from
3 km
Earth’s climate system. To Fires
improve climate, weather,
aerosol, and air quality models,
scientists need to better
understand these properties
and cloud and aerosol vertical
distribution in the atmosphere.
2 CATS: I Measuring Clouds and Aerosols from the International Space Station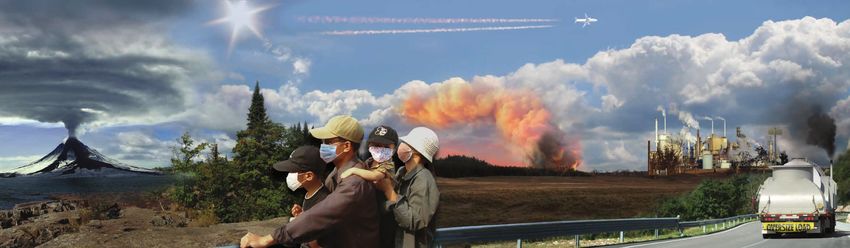
warm the atmosphere. In general, dark-colored
                                                                              aerosols such as black carbon from fossil fuel
                                                                              combustion absorb radiation, heating Earth’s at-
                                                                              mosphere, while bright-colored aerosols such as
                                                                              sulfates from volcanic eruptions reflect radiation,
                                                                              acting to cool Earth’s atmosphere.

                                                                              Constantly in motion, different types of clouds
                                                                              and aerosols can be found at varying heights
                                                                              throughout the atmosphere and while they have
                                                                                                                                      Image credit: Sydney Oats
                                                                              relatively short lifetimes, they often have complex
                                                                              interactions when mixed together. For example,
                                                                              aerosol particles can affect the formation and
                                                                              properties of clouds (e.g., by activating early
                                                                              growth of cloud droplets and by changing the
                                                                              albedo, or reflectivity, of clouds). The relationship
                                                                              between clouds and aerosols and the resulting
                                                                              influence on Earth’s climate is therefore multi-
                                                                              faceted, with impacts on Earth’s energy balance,
                                                                              hydrologic cycle, and atmospheric circulation.

       Although most aerosols reflect sunlight, some also                     Aerosols, both natural and man-made, also affect        Image credit: US Forest Service Gila National
                                                                                                                                      Forest/Kari Greer
       absorb it. An aerosol’s effect on light depends                        air quality. Near Earth’s surface, aerosol particles
       primarily on the composition and color of the                          are pollutants that can exacerbate poor air quality
       particles. Broadly speaking, bright-colored or                         conditions harmful to our health. For example,
       translucent particles tend to reflect radiation in all                 small aerosols can enter the human lungs and
       directions and back towards space. Darker aerosols                     blood, where they can cause respiratory issues
       can absorb significant amounts of light. Pure sulfates
                                                                              and even heart attacks. Higher in the atmosphere,
       and nitrates reflect nearly all radiation they encounter,
                                                                              aerosols ejected from volcanoes can disrupt air
       cooling the atmosphere. Black carbon, in contrast,
       absorbs radiation readily, warming the atmosphere
                                                                              traffic—as was dramatically demonstrated during
       but also shading the surface. Image credit: NASA                       the 2010 eruption of the Eyjafjallajökull volcano
                                                                              in Iceland, which caused an estimated $1.7 bil-
                                                                              lion dollar loss for the airline industry.              Image credit: Thawt Hawthje

                                                                              To predict changes in Earth’s climate and air
                                                                              quality scientists use measurements of clouds
                                                                              and aerosols to simulate forecasts using com-
                                                                              puter models. However, due to the complexities
                                                                              mentioned here, there are large uncertainties in
                               Factory                                        the way models handle clouds and aerosols and
                              Emissions
                                                        Vehicle
                                                                              their radiative properties. Therefore, obtaining
                                                        Exhaust               a better understanding of cloud and aerosol
                                                                              coverage, distribution, and type throughout all
                                                                              vertical layers of the atmosphere is critical for
                                                                              understanding and predicting Earth’s climate as         Image credit: Bojan Rantaša

                                                                              well as air quality conditions.
                                                                                                                                      Some aerosols close to the surface,
                                                                                                                                      such as dust, smoke from wildfires,
                                                                                                                                      and harmful pollutants, can cause
Composite image created from photographs by: Patrick Byrne, Carolyn Conner,                                                           air quality issues and impact
Peggy Davis, Daniel Fogg, John Newman, Cyrus Reed, and Gayle Trautman
                                                                                                                                      human health.

                        CATS: I Measuring Clouds and Aerosols from the International Space Station                              3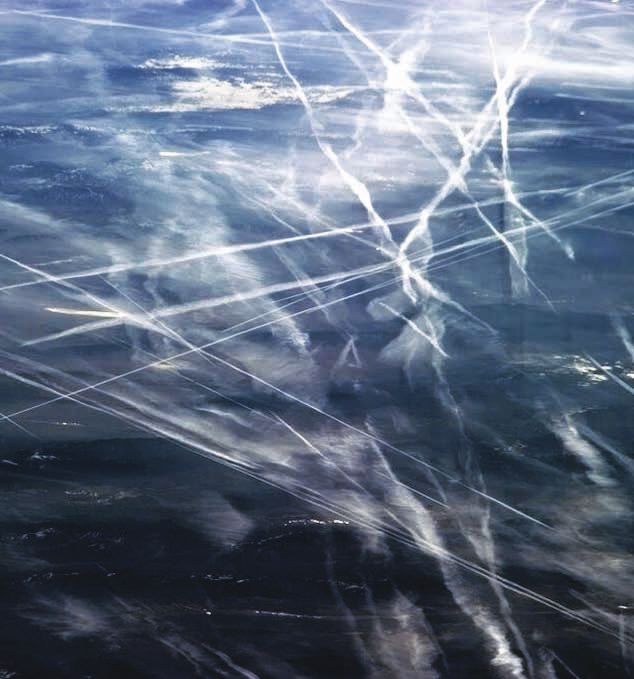
Measuring Clouds
                                            and Aerosols
                                            Today scientists use an array of satellite, aircraft,      infer other properties, such as the composition of
                                            and ground-based instruments to measure and                clouds, the abundance and sizes of aerosols, and
                                            monitor clouds and aerosols. For many years                the altitudes of cloud and aerosol layers.
                                            scientists have observed clouds and aerosols using
                                            passive remote sensors that measure the amount             In 1999 NASA developed an airborne lidar sys-
                                            of radiation reflected and emitted by Earth. These         tem called the Cloud Physics Lidar, or CPL, for
                                            sensors are important for providing information            use on the high-altitude ER-2 aircraft. Still used
                                            about aerosol and cloud concentrations over large
                                            areas but are not commonly used for distin-
                                            guishing differences in height or type. To better
                                            observe the vertical structure of clouds and aero-
                                            sols, scientists turn to another tool: active remote
                                            sensing instruments, which include lidar.

                                            Lidar works by using a laser to send a pulse of
                                            energy through the atmosphere towards a distant
                                            object (i.e., a cloud droplet or aerosol particle).
   Active lidar remote sensing
                                            Once the energy reaches the object, some of
   instruments provide information
                                            the energy is reflected back to the lidar receiver.
   about the three-dimensional                                                                         The primary capability for CATS was adapted from
                                            Scientists can calculate the distance between the
   distribution of clouds and                                                                          the CPL design. Pictured here, the Cloud Physics
   aerosols by emitting a laser
                                            lidar instrument and the object (i.e., its location
                                                                                                       Lidar was designed and built by scientists and
   pulse of light and measuring the         in the atmosphere) based on the time it takes the
                                                                                                       engineers at NASA’s Goddard Space Flight Center.
   elapsed time of the return signal.       reflected energy to return to the receiver. The in-        Image credit: NASA
   Image credit: NASA                       tensity of this return pulse also allows scientists to

                                                      CPL 532 nm Attenuated Backscatter Profiles
                20                                                                                                                         1 x 10⁻⁵

                15                                                                                                                         8 x 10⁻⁶   attenuated backscatter
altitude (km)

                                                                                                                                           6 x 10⁻⁶          (m-1 sr-1)
                10
                                                                                                                                           4 x 10⁻⁶
                 5
                                                                                                                                           2 x 10⁻⁶
                 0                                                                                                                         0
                  7:00   17:20     17:42      18:03        18:24      18:46     19:07          19:28       19:49      20:11       20:32
                                                            Flight Time (hours, UTC)        Saharan dust
                               subvisual cirrus        cirrus                                                               boundary layer aerosol
                            low-level cumulus                                           convective clouds
  This vertical profile from the airborne CPL lidar instrument shows different cloud and aerosol types and concentrations at various heights in the
  atmosphere. Measurements of the vertical distribution of clouds and aerosols are useful in many diverse scientific disciplines such as climate studies,
  weather research and prediction, atmospheric geochemistry, aerosol impacts on the biosphere, as well as satellite and model calibration and validation.
  Image credit: NASA

                                              4       CATS: I Measuring Clouds and Aerosols from the International Space Station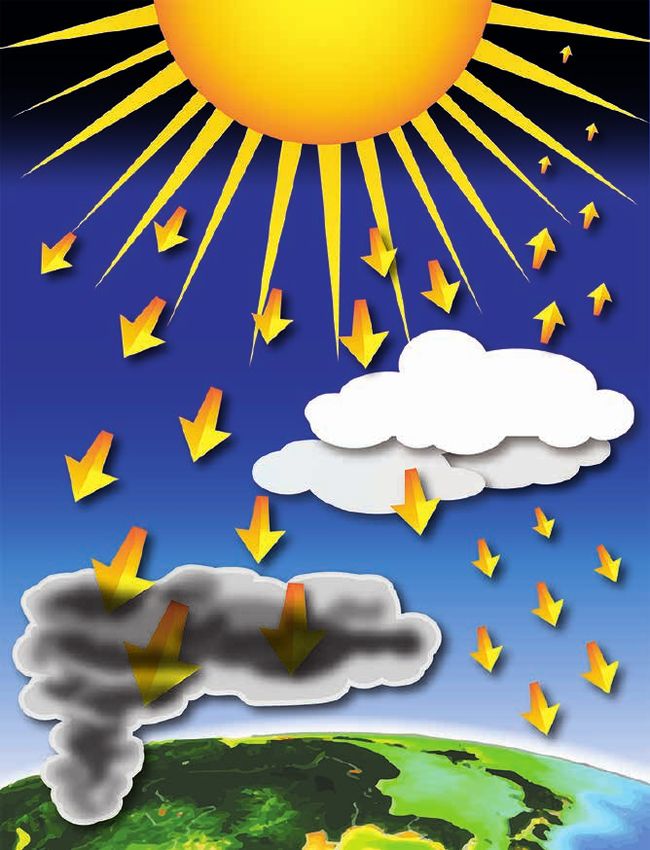
today, the CPL uses a high-repetition-rate laser      extend the CALIPSO data record for continuity
to provide atmospheric profile measurements of        of lidar climate observations. Ideally, CALIPSO
clouds and aerosols. The ER-2 typically flies at      will still be operational when CATS becomes
approximately 65,000 feet (20 kilometers) above       active allowing for a period of intercomparison
the Earth’s surface, which allows the instruments     between CATS and CALIPSO data, and likewise
onboard to function as spaceborne instrument          CATS would be operational long enough to get
simulators. While the CPL provides valuable data      EarthCARE up and running.
to the research community and has done so for
many years, it does not provide continuous, near-
global coverage like satellites can.

In 2006 NASA launched the Cloud-Aerosol
Lidar and Infrared Pathfinder Satellite Observa-
tions, or CALIPSO, spacecraft—a joint mission
between NASA and the French Centre National
d’Études Spatiales (CNES). Similar to CPL’s lidar,
CALIPSO carries a lidar that provides vertical
distributions and properties of clouds and aerosols
along a flight track. However, the CALIPSO lidar
has exceeded its three-year prime mission and has
been using its backup laser since 2009.

It is critical to continue the measurement
                                                      To study aerosols, researchers from NASA’s Global Modeling and Assimilation Office ran a
capabilities of CALIPSO to better assess the          simulation of the atmosphere using the Goddard Earth Observing System Model Version 5, or
climatological impacts of clouds and aerosols         GEOS-5, that captured how winds transport aerosols around the world. This image represents
through the use of computer models. To do so,         how sea salt (blue) and dust (orange) swirl inside cyclones, sulfates (white) stream from
these measurements are required over time scales      surface emissions and volcanoes, and carbon (green) bursts from fires. Such simulations
that are much longer (~20-30 years) than typical      allow scientists to better understand how these tiny particulates travel in the atmosphere and
mission lifetimes (~5-10 years). The next satellite   influence weather and climate. Image credit: NASA’s Scientific Visualization Studio
mission with a lidar onboard is scheduled to
launch in 2018—a joint European and Japanese
spacecraft called the Earth Clouds, Aerosols,
and Radiation Explorer, or EarthCARE. NASA
also plans to launch the Aerosols, Clouds,
and Ecosystems (ACE) mission; however, it is                                                Launch December 2014
planned for a post-2020 launch date. As a result,                                           6 month requirement
                                                                                            3 year goal              HSRL/UV
the cloud and aerosol research community faces                                                                       demonstration
                                                                                                                     for ACE Mission
a significant data gap in terms of continuing the
CALIPSO data record.                                  2005                      2010                     2015                        2020

However, a unique opportunity to fill the
potential data gap presented itself in 2011 when
the International Space Station (ISS) NASA                                                                                                   ACE
Research Office offered scientists at NASA’s God-                                              Bridge data gap                              Space-
                                                                                               between CALIPSO                              based
dard Space Flight Center a mounting location                 Launched in 2006                  and EarthCARE        HSRL likely to          mission to
onboard the space station for a new lidar instru-            Using 2nd laser                                        launch in 2018          launch
                                                             since 2009                                                                     2020s
ment called the Clouds and Aerosol Transport
System, or CATS. Scheduled for launch in
                                                      The CATS mission will help extend the CALIPSO data record to ensure continuity of lidar
December 2014, CATS will serve as a “bridge”          climate observations. Image credit: NASA
between CALIPSO and EarthCARE, helping to

            CATS: I Measuring Clouds and Aerosols from the International Space Station                  5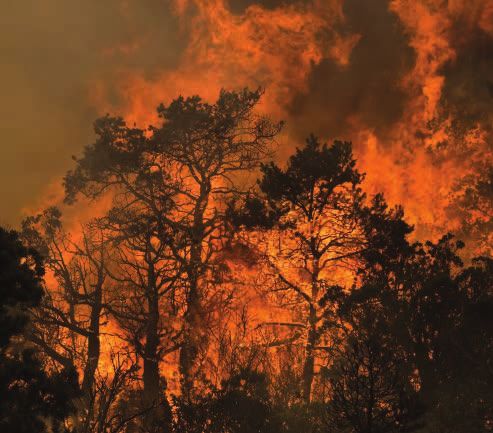
Mission Overview
                                Several aspects of CATS make the mission                and 435 kilometers (~270 miles) above Earth’s
                                extraordinarily unique. To start, the CATS              surface at a 51-degree inclination with nearly a
                                instrument was to be designed and built in only         three-day repeat cycle. This unique orbit path
                                two years and on a much smaller budget than tra-        will allow the CATS instrument to observe the
This mission provides           ditional satellite missions. Given this two-year de-    same spot on Earth at different times each day,
                                sign time—which is very short compared to most          providing far more comprehensive coverage of
a unique opportunity to
                                spaceborne missions—scientists and engineers            the tropics and mid-latitudes (between 51.6
demonstrate ISS-based           at NASA’s Goddard Space Flight Center needed            degrees north and south latitude) than sun-syn-
operational science             to work quickly. To do so they leveraged existing       chronous orbiting satellites (like CALIPSO) that
                                instrument designs from the CPL and Airborne            observe the same Earth scene at the same local
capabilities as well as an      Cloud-Aerosol Transport System, or ACATS,               time each day. This will allow scientists to, for
opportunity to demonstrate      and used commercial parts where possible. In            the first time ever, study diurnal (day-to-night)
                                particular, Fibertek, Inc. provided the laser units     changes in cloud and aerosol effects from space.
new technologies for future
                                and the avionics/communications package and
Earth science missions (e.g.,   Design Interface, Inc. provided mechanical              CATS will also provide a continuous stream of
                                design services.                                        data from the ISS and, unlike CALIPSO and
NASA’s ACE mission) at a                                                                other Earth-observing satellites, does not rely on
relatively low cost.            Designed to operate for at least six months—            ground stations to downlink data once or twice
                                with a goal of three years, and the possibility to      daily. In addition, this mission provides a unique
                                operate as long as five years—CATS will provide         opportunity to demonstrate ISS-based operational
                                vertical profiles of cloud and aerosol proper-          science capabilities as well as an opportunity to
                                ties at three wavelengths (1064, 532, and 355           demonstrate new technologies for future Earth
                                nanometers). Onboard the space station, CATS            science missions (e.g., NASA’s ACE mission) at a
                                will orbit between 375 kilometers (~230 miles)          relatively low cost.

                                                         Artist’s rendition of CATS collecting a swath of data from the ISS. Image credit: NASA

                                  6     CATS: I Measuring Clouds and Aerosols from the International Space Station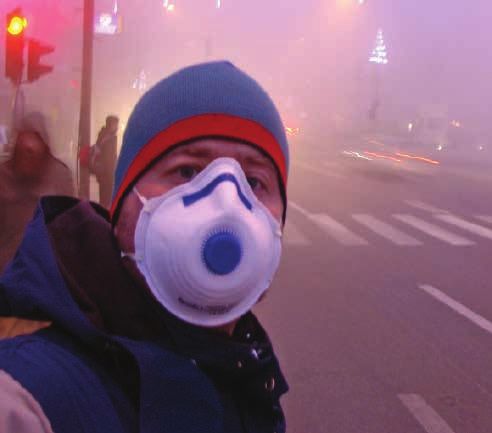
Science Goals
1. CATS will help extend
the global lidar data record
for continuity of climate
observations. In particular,
CATS will:
• Continue the data record
of vertical profiles of
cloud/aerosol properties;
• Improve our understand-
ing of aerosol and cloud
properties and interac-
tions; and
• Improve model estimates
of climate forcing and
predictions of future
climate change.
2. Data from CATS will
improve operational aerosol
forecasting programs. In
particular, the data will:
Onboard the ISS, CATS will provide a continuous stream of data that can be used for research applications
such as studying cloud and aerosol properties and detecting wildfires. CATS will also provide data that can be • Improve model perfor-
used in near real-time for several forecasting applications including plume tracking and air quality monitoring. mance through assimila-
Image credit: NASA tion of near-real-time
cloud/aerosol data;
Due to the unique
orbit path of the ISS, • Enhance air quality moni-
CATS will observe the toring and prediction
same spot on Earth at capabilities by providing
different times each day. vertical profiles of pollut-
In addition, the low-
ants; and
inclination orbit permits
extensive measurements • Improve strategic and
over aerosol source and hazard-warning capabili-
aerosol transport regions.
ties of events in near real-
Image credit: NASA
time (e.g., dust storms
and volcanic eruptions).
The space station CATS-ISS Monthly Coverage: September 2012 (0-24 hrs local time)
revisits the same latitude 3. The CATS payload will
60
at slightly different local 20 serve as a technology demon-
18
Overpasses (max 44)
times on each orbit.
Approx. Number of
Latitude (degrees)
30 16 stration for future space-
In general, this means 14 based lidar missions. In
it covers all points on 12
0 10 particular, the payload will:
Earth’s surface between
51.6 degrees north 8
6 • Demonstrate High
and south latitude at all -30 4 Spectral Resolution Lidar
times of day in roughly 2
(HSRL) aerosol retrievals
two months. Image -60
credit: NASA -180 -120 -60 0 60 120 180 and 355 nanometer (ul-
traviolet) data for future
mission development.
CATS: I Measuring Clouds and Aerosols from the International Space Station 7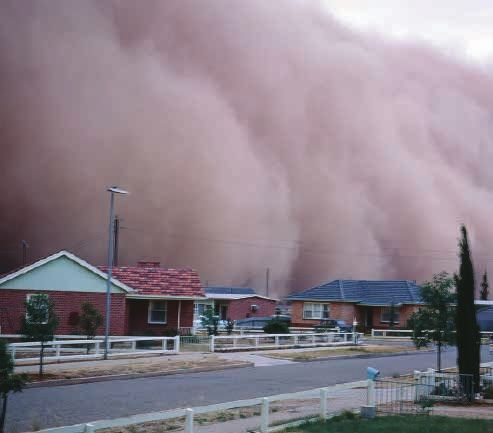
Instrument Overview
                                      The CATS instrument can operate in three dif-                   for future missions (e.g., ACE). Mode 1, also
    Mode 1: Multi-Beam                ferent modes and uses two high-repetition-rate                  referred to as the multi-beam mode, splits the
Backscatter: 532, 1064 nm             lasers. Data from CATS will be used to derive a                 energy from the first laser into two wavelengths
No HSRL
Depolarization: 532, 1064 nm          variety of properties of cloud and aerosol                             that represent near infrared radiation (1064
Science Goals: 1, 2                   layers including: backscatter, layer                        T                   nanometers) and visible light (532
                                                                                            OL RAN
                                                                                        OS                SP
                                      height, layer thickness, ex-                 A ER                       OR               nanometers)—similar to
                                                                                D-                                TS
                                                                             OU                                      YS
                                      tinction (how much light           C L                                            T E M    CALIPSO. This two-wave-

                                                                                       A T
                                      is lost due to scattering                                                                   length mode is necessary
                                      and absorption), optical                                                                    for determining layer type
                                      depth (the total loss of                                                                     (i.e., cloud and aerosol
                                      light through a layer),
                                      and at least a coarse                 C                                  S
                                                                                                                                    composition) since dif-
                                                                                                                                     ferent particles reflect
                                      discrimination of                                                                               the two wavelengths
                                      aerosol and cloud type                                                                          differently. For example,
                                      (e.g., smoke, dust, pol-                                                                       water particles tend to
                                      lution, water droplet, ice                                                                  scatter more “light” at
    Mode 2: HSRL Demo
                                      crystal) using a technique                                                                1064 nanometers than at 532
Backscatter: 532, 1064 nm
HSRL: 532 nm
                                      called depolarization-based               NASA GSFC - ISS National Laboratory
                                                                                                                              nanometers,   while aerosols tend
Depolarization: 1064 nm               discrimination of particle type.                                                    to scatter more at 532 nanome-
Science Goals: 1, 3                                                                                                   ters than at 1064 nanometers. Ice
                                      CATS will operate in Mode 1 for the major-                      particles, on the other hand, tend to scatter the
                                      ity of the mission, as Modes 2 and 3 will be                    same amount of light at both wavelengths.
                                      used intermittently to test new technologies

      Mode 3: UV Demo
Backscatter: 355, 532, 1064 nm
No HSRL
Depolarization: 532,1064 nm
Science Goals: 1, 2, 3

                                      Engineers at NASA’s Goddard Space Flight Center assemble the CATS payload inside the cleanroom. The
                 Image credit: NASA   instrument payload weighs 494 kilograms (~1100 pounds). Image credit: NASA

                                        8       CATS: I Measuring Clouds and Aerosols from the International Space Station
Primary Power Supply
Other Detector Boxes
Payload Interface
Unit (PIU)
HSRL Detector Box
Telescope
Current climate models
Laser 1 do not accurately predict
Telescope
Cover the vertical distribution of
clouds and aerosols or their
Instrument parts are labeled in this diagram of the CATS payload. (Note, Laser 2 does not layer type. To reduce these
appear in this view and is therefore not labeled in this image.) Image credit: NASA
uncertainties, scientists will
use lidar data from CATS to
initialize forecast models,
Determining layer type is important because dif- precise measurements. In particular, Mode 2 will
ferent clouds and aerosols have different radiative provide better estimates of extinction, which subsequently producing
properties that impact Earth’s radiative balance is extremely important for model applications
more accurate results.
in a variety of ways. Current climate models do since it is an important variable in determining
not accurately predict the vertical distribution of the radiative effects of clouds and aerosols on the
clouds and aerosols or their layer type. To reduce climate system.
these uncertainties, scientists will use lidar data
from CATS to initialize forecast models, sub- Mode 3 also uses the second laser and in addi-
sequently producing more accurate results. Ad- tion to operating at 1064 and 532 nanometers,
ditionally, determining layer type is important for adds a third wavelength at 355 nanometers.
forecasting air quality conditions. In particular, The shorter wavelength of 355 nanometers lies
aerosol types that consist of small particles, such in the ultraviolet region of the electromagnetic
as sulfates and carbons, are more dangerous to spectrum and will therefore interact with par-
human health than larger aerosols such as dust. ticles differently than 1064 and 532 nanometer
wavelengths. Scientists are eager to learn more
Operational Mode 2 uses the second laser and about the use of this new wavelength and look
will demonstrate a new technology called High forward to what this new capability might mean
Spectral Resolution Lidar (HSRL). This new for future space-based lidar mission develop-
technique uses a narrower wavelength interval ment, especially the EarthCARE mission.
at 1064 and 532 nanometers to provide more
CATS: I Measuring Clouds and Aerosols from the International Space Station 9Launch and Installation
The CATS instrument is scheduled to launch or SSRMS, controlled by ground controllers at
on the SpaceX Cargo Resupply-5, or SpaceX-5, NASA, will then extract the instrument from
mission to the ISS in December 2014. SpaceX-5 the trunk and pass it to a second robotic arm
consists of a Dragon cargo spacecraft mounted called the Japanese Experiment Module Remote
atop a Falcon-9 launch vehicle. Prior to launch, Manipulator System, or JEMRMS, controlled by
the CATS instrument will be strategically the Japan Aerospace Exploration Agency that will
mounted inside the Dragon’s unpressurized attach the instrument to the JEM-EF.
trunk, which will provide power to the payload’s
survival heaters from launch until it is removed Once the instrument is successfully attached
for installation to the ISS. to the JEM-EF, all onboard operations will be
conducted through ground control at NASA’s
Once launched, the instrument will be installed Goddard Space Flight Center using real-time
on the International Space Station’s Japanese commands. Onboard the space station, CATS is
Experiment Module – Exposed Facility (JEM- intended to operate continuously, or as near-con-
EF)—the first NASA-developed payload to ever tinuously as possible, except during periods when
fly on the JEM-EF. When it reaches the space the instrument needs to be turned off for safety
station, the Dragon spacecraft will be robotically reasons such as during an extra-vehicular activity
berthed. A robotic arm on the space station called (i.e., a spacewalk).
the Space Station Remote Manipulator System,
Image credit: NASA/Tony Gray and Tim Powers
SpaceX Dragon cargo spacecraft. Image credit: NASA
10 CATS: I Measuring Clouds and Aerosols from the International Space StationOnboard the space station,
CATS is intended to operate
continuously, or as near-
continuously as possible,
except during periods when the
instrument needs to be turned
off for safety reasons such
as during an extra-vehicular
activity (i.e., a spacewalk).
Prior to launch, the CATS
instrument will be strategically
mounted inside the Dragon
trunk on SpaceX. Image
courtesy: SpaceX
Pictured here, CATS will be fully
exposed to the space environment
once mounted on the JEM-EF.
Image credit: NASA
Image credit: NASA
CATS: I Measuring Clouds and Aerosols from the International Space Station 11Benefits to Society and
Technology
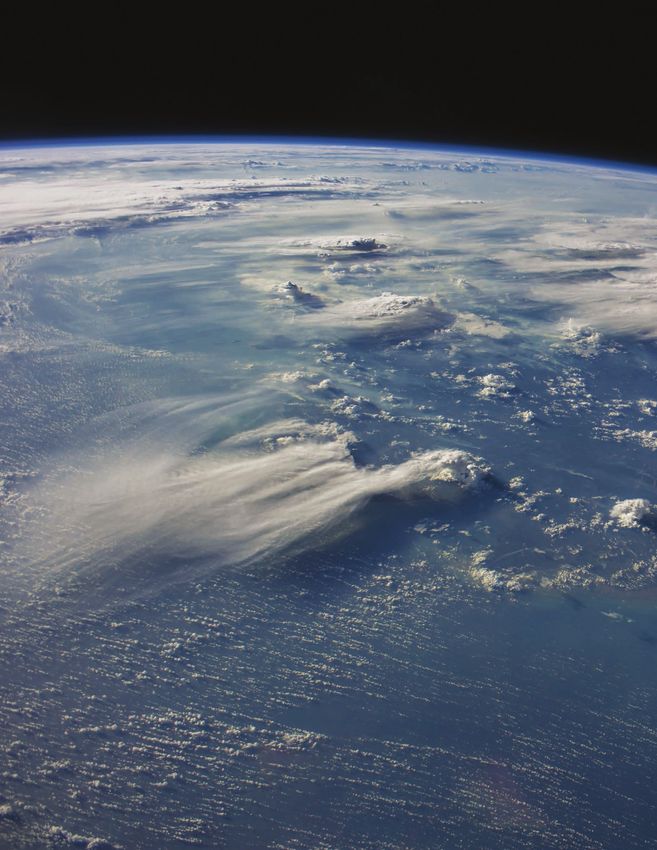
In this image from the Sea- Air, or the atmosphere, is essential for life on Provided here are just a few examples of recent
Earth. It protects life by absorbing ultraviolet events where air quality impacted daily life. Data
Viewing Wide Field-of-View solar radiation, warming the surface through from CATS can make a difference in predict-
Sensor (SeaWiFS), a large heat retention (greenhouse effect), and reducing ing, responding to, and mitigating the impact of
temperature extremes between day and night. In similar events in the future.
dust storm moves across addition to protecting us, the quality of Earth’s
• Volcanic Eruptions. On June 4, 2011,
the Atlantic Ocean off the air, or air quality, impacts the health of all living
things from humans to plants. the Puyehue-Cordón Caulle volcano in
coast of Africa on February Chile experienced its first major eruption
26, 2000. Dust storms such Air quality fluctuates from day to day for a in decades. The volcano sent an ash plume
number of reasons. Most obviously, air qual- eastward, disrupting air traffic, threatening
as this one are common in ity changes if more pollutants are put into the water supplies, and even dropping golf ball-
this area and can lift dust a atmosphere. Large events such as dust storms, sized pumice on parts of Argentina. Volcanic
wildfires, volcanic eruptions, and days with high- ash (very different from ash from ordinary
few kilometers high in the energy demands can dramatically influence air fires) is made of tiny, jagged particles of rock
atmosphere, where it inter- quality and impact human health and activities. and glass that are very abrasive and slightly
corrosive, and can even conduct electric-
acts with clouds—called the Currently, scientists get a broad picture of air ity when wet. In addition to disrupting air
Saharan Air Layer. Scientists quality conditions in the atmosphere and gener- traffic, it can irritate respiratory systems, coat
ate air quality forecasts by combining satellite, vegetation and leave it inedible to wildlife
at NASA are studying these aircraft, and ground-based data with sophisticated and livestock, and destroy machinery.
waves of westward-traveling computer models. However, most datasets do not
provide information about the vertical structure of • Dust Storms. In mid-October 2012, the
dust to better understand clouds and aerosols and their layer type. Incorpo- Great Plains of the United States endured
their impact on tropical rating the near real-time vertical data that CATS a widespread dust storm due to months of
will produce is expected to improve our ability to drought and searing heat. Severe winds blew
storm and hurricane forma-
track different cloud and aerosol types at all layers soil and sediment across hundreds of miles
tion. Credit: NASA/SeaWiFS of the atmosphere. These datasets will be used to causing near blackout conditions in some
Ocean Color Team improve strategic and hazard-warning capabilities places. Authorities had to close portions of
of events in near real-time (e.g., plume tracking Interstate 35 in Kansas and Oklahoma, as
for dust storms, volcanic eruptions, and wildfires), well as Interstate 80 in Wyoming, due to
which ultimately impact our daily lives. accidents and poor visibility. More common
Coarse Particulate Matter (PM10)
Human Hair
Particles 10 µm in diameter, (e.g., Particles in
dust, pollen, and mold) PM10 Coarse Fine, airborne particulate matter (PM) that is
the Air
particles enhaled
are filtered by
smaller than 2.5 microns (about one thirtieth
Fine Particulate Matter
the nose and the width of a human hair) is considered
(PM2.5) Particles 2.5 µm in
mouth dangerous because it is small enough to
diameter or smaller, (e.g.,
sulfates and carbon) enter the passages of the human lungs. Most
Magnified PM2.5 Fine particles travel PM2.5 aerosol particles come from the burning
Human Hair to the lungs, aggravating of fossil fuels and biomass (wood fires and
50 to 70 µm in asthma, causing difficulty
breathing and decreased agricultural burning).
diameter
lung function.
Image adapted from EPA and SCMP
12 CATS: I Measuring Clouds and Aerosols from the International Space StationVolcanic Eruptions
are dust storms that originate over large
deserts such as the Gobi and Taklimakan. Puyehue-Cordón Caulle This image shows the volcanic plume
coming from Puyehue-Cordón Caulle in
• Pollution Outbreaks. Residents of Beijing Chile on June 4, 2011 shortly after the
and many other cities in China are used to eruption began. The brown ash plume
reaches high above the clouds and casts
having their lives impacted by poor air qual- a shadow towards the southeast. Along
ity. Like many times before, a thick layer of the leading edge of the plume, it appears
haze blanketed the North China Plain on that heavier material has fallen out of the
ash cloud, while finer particles remain
October 9, 2014. That same day, measure- suspended in the atmosphere. Credit:
ments from ground-based sensors at the NASA’s Earth Observatory
U.S. Consulate in Beijing reported PM2.5
20 km
measurements of 334 micrograms per cubic N
meter of air. The World Health Organization Dust Storms
considers PM2.5 to be safe when it is below
25 micrograms per cubic meter of air. NASA’s Aqua satellite captured this
natural-color image of dust storms in the
• Forest Fires. Smoke from the California prairies of the United States on October
Rim Fire in September 2013 choked Yo- 18, 2012. Gale-force northwest winds blew
semite National Park during the busy Labor Dust along the western edge of a storm system
that stretched from the Canadian border to
Day weekend. The fire started on August Kansas. High winds carried dust and dirt
17, 2013, and was the third largest wildfire as much as 900 to 1200 meters (3000 to
in California’s history. The smoke caused 4000 feet) into the atmosphere, according
to local weather reports. Credit: NASA’s
poor air quality from Yosemite National Park Earth Observatory
to the San Joaquin Valley and people were 100 km
advised to avoid strenuous outdoor activity N
or to remain indoors since smoke can irritate Pollution Outbreaks
the eyes and respiratory system and aggravate
chronic heart and lung disease. Fog
NASA’s Terra satellite acquired this
In addition to anticipated improvements to opera- natural-color image of northeastern
China on October 9, 2014. The image
tional forecasting programs, CATS will also dem- shows extensive haze, low clouds, and
onstrate new technologies for observing and mea- fog over the region. The haze obscured
suring clouds and aerosols. The HSRL technique Haze Bohai many features usually visible in satellite
Sea imagery of the area, including China’s
(described in the Instrument Overview section) is
largest city, Beijing. Credit: NASA’s
expected to provide more precise measurements Earth Observatory
from space than ever before. Scientists will also get Clouds
a first-ever, space-based look at cloud and aerosol 100 km
retrievals in the ultraviolet—355 nanometers. N
Forest Fires
In summary, the CATS mission seeks to build on
the CALIPSO data record, provide observational
Officially contained on Thursday,
lidar data to improve research and operational October 24, 2013, the California Rim
modeling programs, and demonstrate new lidar Clouds Fire burned approximately 257,314
acres (~402 square miles)—the largest
retrievals of clouds and aerosols from space. These Yosemite wildfire on record in the Sierra Nevada.
technologies and the science gained from the CATS Valley NASA’s Aqua satellite acquired this
mission will be used to design future missions that view of the fire on August 31, 2013. The
will study clouds and aerosols and their affects on California smoke is brown and smooth in texture
Smoke compared to the bright white clouds.
Earth’s climate and air quality for years to come. Credit: NASA’s Earth Observatory
Data from CATS will be freely available at 20 km
cats.gsfc.nasa.gov. N
CATS: I Measuring Clouds and Aerosols from the International Space Station 13National Aeronautics and Space Administration www.nasa.gov NP-2014-10-209-GSFC
You can also read