Census independent population estimation using representation learning
←
→
Page content transcription
If your browser does not render page correctly, please read the page content below
www.nature.com/scientificreports
OPEN Census‑independent population
estimation using representation
learning
Isaac Neal1, Sohan Seth1*, Gary Watmough1 & Mamadou S. Diallo2
Knowledge of population distribution is critical for building infrastructure, distributing resources,
and monitoring the progress of sustainable development goals. Although censuses can provide
this information, they are typically conducted every 10 years with some countries having forgone
the process for several decades. Population can change in the intercensal period due to rapid
migration, development, urbanisation, natural disasters, and conflicts. Census-independent
population estimation approaches using alternative data sources, such as satellite imagery, have
shown promise in providing frequent and reliable population estimates locally. Existing approaches,
however, require significant human supervision, for example annotating buildings and accessing
various public datasets, and therefore, are not easily reproducible. We explore recent representation
learning approaches, and assess the transferability of representations to population estimation in
Mozambique. Using representation learning reduces required human supervision, since features are
extracted automatically, making the process of population estimation more sustainable and likely
to be transferable to other regions or countries. We compare the resulting population estimates
to existing population products from GRID3, Facebook (HRSL) and WorldPop. We observe that our
approach matches the most accurate of these maps, and is interpretable in the sense that it recognises
built-up areas to be an informative indicator of population.
Accurate population maps are critical for planning infrastructure and distributing resources, including public
health interventions and disaster relief, as well as monitoring well-being e.g. through the fulfillment of sustainable
development goals1. Censuses provide a ‘gold standard’ population map by surveying every individual household
nationally. However, this is an extremely expensive endeavor, and therefore they are typically conducted every
10 years2. During the intercensal period, projections of the population are available at a coarser enumeration
level that is estimated either using birth, death, and migration r ates3,4, or through combining sample household
surveys using small area estimation2. Estimating finer-resolution intercensal population, e.g., over a 100 m grid,
has received significant interest in the last decade, and several population maps, e.g. WorldPop5, High-Resolution
Settlement Layer (HRSL)6,7 and GRID38, have been made available publicly to aid humanitarian initiatives. These
approaches primarily use satellite imagery as a predictor, and can be broadly categorized as census-dependent
and census-independent based on their use of census as response variable9.
Census-independent population estimation approaches (section “Census-independent population estima-
tion”) using microcensus (survey data) are gaining prominence since they can improve the spatial and temporal
resolution of census-dependent approaches (section “Deep learning for intercensal population estimation”). How-
ever, finding census-independent methods that are sustainable and transferable, and informative data sources that
are reliable and easy to procure remain active areas of research. Existing approaches rely heavily on hand-crafted
features that often require manual curation, and the features used in modelling vary significantly between publi-
cations and countries where population is being estimated, making them less sustainable for repeated use, and less
transferable to other regions and countries. For example, these approaches often use objects in satellite imagery,
e.g., buildings and c ars10, and distribution of services, e.g., school d
ensity11 and road n
etworks9, as indicators of
population. Detecting building footprints usually requires manual annotation and curation while information
on road networks and school density can be incomplete, unreliable, and difficult to procure.
Recent advances in representation learning have demonstrated that features, or representations, automati-
cally extracted from images through end-to-end training of a deep neural network can significantly improve
the performance in many computer vision tasks in a sustainable manner by removing the need for hand-crafted
features12. Additionally, transfer learning can leverage features learned from a vast amount of annotated data from
1
University of Edinburgh, Edinburgh, UK. 2United Nations Children’s Fund (UNICEF), New York, USA. *email:
sseth@ed.ac.uk
Scientific Reports | (2022) 12:5185 | https://doi.org/10.1038/s41598-022-08935-1 1
Vol.:(0123456789)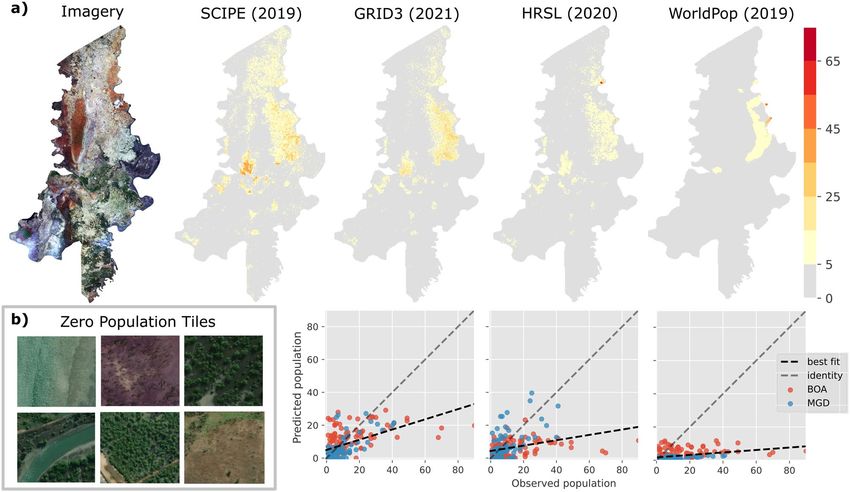
www.nature.com/scientificreports/
Figure 1. The figure illustrates our approach of sustainable census-independent population estimation, or
SCIPE, using representation learning. Satellite images of surveyed grid tiles are mapped to vector representations
through a pre-trained deep neural network, and a regression model is trained on the representation space to
estimate population using microcensus. The pre-trained network can also be fine-tuned with microcensus to
learn better representation indicative of population.
a separate task to improve performance on tasks lacking sufficient annotated data13. Furthermore, explainable
AI has provided meaningful insight from these, so called ‘black box’, models to explain the decisions made by
them, enhancing their transparency14. Representation learning can vastly simplify the problem of estimating
population from satellite imagery by removing the need for handcrafted features, manual data procurement, and
human supervision, thus improving the sustainability and transferability of the process. Additionally, transfer
learning removes the need for large scale training data, allowing fine-tuning on limited microcensus with mini-
mal computational resources. Finally, these methods provide interpretation of model outcome, promoting trust
around the estimated population among the end-users.
We assess the utility of representation learning in census-independent population estimation from very-high-
resolution (≤ 5 m) satellite imagery using a retrospective microcensus in two districts of Mozambique. To the
best of our knowledge, we are the first to explore the potential of such approach, and in using both very-high (50
cm spatial) resolution satellite imagery and microcensus in this manner. We observe that the proposed approach
is able to produce a reliable medium-resolution (100 m) population density map with minimal human supervi-
sion and computational resources. We find that this approach performs similar to the more elaborate approach
of using building footprints to estimate population, and outperforms techniques using only public datasets to
estimate population in our ROIs (more details in Table 3 in section “Results”). It also completely avoids manual
annotation of satellite images and manual access to public datasets making it potentially more transferable
to other countries using only very-high-resolution satellite imagery and gridded microcensus. Additionally, we
observe that this approach learns to predict population in a reasonable manner by using built-up area as an
indicator of population. We refer to this approach as Sustainable Census-Independent Population Estimation or
SCIPE (see Fig. 1 for an illustration), with our core motivation being developing population estimation methods
that are easy to use, computationally efficient, and that can produce frequent and explainable population maps
with associated uncertainty values. This will help humanitarian organizations extrapolate local microcensus
information to regional level with ease, and provide more confidence in using the estimated population map in
conjunction with existing ones.
Background
The traditional method for mapping population is the use of census enumeration. The time and cost of such
surveys means that most are conducted once a decade. National Statistics Offices (NSOs) can provide updated
population counts regularly through registration of births and deaths. However, many NSOs are under-funded
and poorly resourced, limiting the ability to provide regular, fine-spatial resolution population c ounts9,17,18. There
have been several approaches in recent years to provide more frequent and higher-spatial resolution population
estimations using blended datasets such as census, household surveys, earth observation (EO) satellite data
and mobile phone records9. Further, there is an increasing interest in using EO data to estimate socioeconomic
changes in time periods between census and s urveys19–21. These approaches seek to identify relationships between
socioeconomic conditions and metrics extracted from geospatial data such as particular land cover characteristics
related with local l ivelihoods22. However, these approaches all rely on a priori knowledge of population location
and counts. This information is not updated frequently enough using traditional statistical a pproaches17. In this
section, we provide a detailed overview of the existing literature on census-independent population estimation
(section “Census-independent population estimation” and Table 1) and the application of deep neural networks
in intercensal census-dependent population estimation (section “Deep learning for intercensal population esti-
mation” and Table 2).
Census‑independent population estimation. Census-dependent population estimation, also known as
population disaggregation or top-down estimation, either uses census data to train a predictive model that can
estimate population of a grid tile directly1, or to train a model to estimate a weighted surface that can be used
to distribute coarse resolution projected data across a finer resolution grid23. Census-independent population
estimation, also known as bottom-up estimation, instead relies on locally conducted microcensuses to learn a
predictive model that can estimate population at non-surveyed grid tiles.
Scientific Reports | (2022) 12:5185 | https://doi.org/10.1038/s41598-022-08935-1 2
Vol:.(1234567890)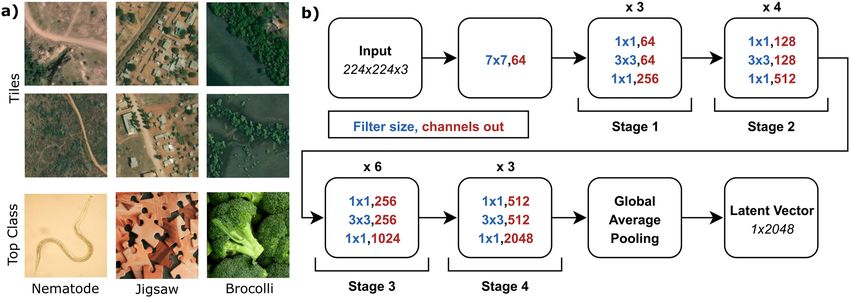
www.nature.com/scientificreports/
Performance
ROI Input resolution Output resolution Input data cost Validation MeAPE R2
Kano and Kaduna, Nigeria15 0.5 m (Maxar) 90 m High (Maxar) Survey (same region) – 0.98
10 10 m (Object shape data) 12–30 m (Set-
Sri Lanka Village level Free (Landsat) High (Maxar) Train/test split 28 0.58
tlement Layer) 750 m (Night time Lights)
16
Bo, Sierra Leone 30 m (Landsat) City district level Free (public data) LOOCV 11 –
11 0.5 m (Maxar), 100 m (WorldPop), vari-
Nigeria 100 m Free (OSM, WorldPop) High (Maxar) Train/test split – 0.26
ous (OSM school density, household size)
Table 1. Summary of recent literature on census-independent population estimation. Note: ROI is region of
interest, LOOCV is leave one out cross validation, MeAPEis median absolute percent error.
Performance
ROI Input shape Input resolution Output resolution Input data cost Validation %RMSE MAPE R2
23
Tanzania 32 × 32 × 8 250 m (Landsat) 8 km Free Train/test split 51.5 – –
USA1 74 × 74 × 7 15 m (Landsat) 1 km Free Future census – 49.8 0.94
20 m (Landsat)
4.5 km (village
India24 224 × 224 × 3 20 m (Sentinel-1 Free Train/test split 24.3 21.5 0.93
level)
radar)
Table 2. Summary of recent literature on deep learning driven census-dependent intercensal population
estimation. NOTE: Input Resolution indicates the spatial resolution of imagery input to model (i.e. after
reprojection and resizing). %RMSE is percent root mean squared error, MAPE is mean absolute percent error.
Weber et al.15 used very-high-resolution satellite imagery to estimate the number of under-5s in two states in
northern Nigeria in three stages: first, by building a binary settlement layer at 8 m resolution using support vector
machine (SVM) with “various low-level contextual image features" , second, by classifying “blocks" constructed
from OpenStreetMap data using “a combination of supervised image segmentation and manual correction
of errors" in 8 residential types (6 urban, 1 rural and 1 non-residential) , and finally, by modelling population
count of each residential type with separate log-normal distributions using microcensus. The predictions were
validated against a separate survey from the same region, and were found to be highly correlated with this data.
Engstrom et al.10 used LASSO regularized Poisson regression and Random Forest models to predict village
level population in Sri Lanka. The authors used a variety of remote sensing indicators at various resolutions as
predictors, both coarser-resolution publicly available ones such as night time lights, elevation, slope, and tree
cover, and finer-resolution proprietary ones such as built up area metrics, car and shadow shapefiles, and land
type classifications . The authors observed that publicly available data can explain a large amount of variation
in population density for these regions, particularly in rural areas, and the addition of proprietary object foot-
prints further improved performance. Their population estimates were highly correlated with census counts at
the village level.
Hillson et al.16 explored the use of 30 m resolution Landsat 5 thematic mapper (TM) imagery to estimate
population densities and counts for 20 neighborhoods in the city of Bo, Sierra Leone. The authors used 379
candidate Landsat features generated manually, which was reduced to 159 covariates through “trial-and-error"
and removal of highly correlated (Pearson’s ρ > 0.99) pairs, and finally, an optimal regression model was learned
using only 6 of these covariates. These estimates were then validated through leave-one-out cross-validation on
the districts surveyed. The approach estimated population density at the coarse neighborhood level with low
relative error for most neighborhoods.
Leasure et al.11 used a hierarchical Bayesian model to estimate population at 100 m resolution grid cells
nationally in Nigeria, and focused on “provid[ing] robust probabilistic estimates of uncertainty at any spatial
scale". The authors used the same settlement map as Weber et al.15 to remove unsettled grid cells prior to popu-
lation density estimation, and used additional geospatial covariates, including school density, average house-
hold size, and WorldPop gridded population estimates. WorldPop population estimates were generated using
a census-dependent approach, so the proposed method in some sense integrates information from census into
otherwise census-independent population predictions. The predicted population estimates, however, were not
highly correlated with the true population counts.
Deep learning for intercensal population estimation. There are several recent approaches that apply
deep learning methods to intercensal population estimation using free and readily available high-resolution
satellite imagery as opposed to relatively expensive very-high resolution imagery, and census as opposed to
microcensus, potentially due to the prohibitive cost of collecting sufficient microcensus for training a custom
deep neural network from scratch. HRSL uses very-high resolution imagery to focus on building footprint iden-
tification using a feedforward neural network and weakly supervised learning, and redistributes the census pro-
portionally to the fraction of built-up area7, but does not use census as the response variable.
Scientific Reports | (2022) 12:5185 | https://doi.org/10.1038/s41598-022-08935-1 3
Vol.:(0123456789)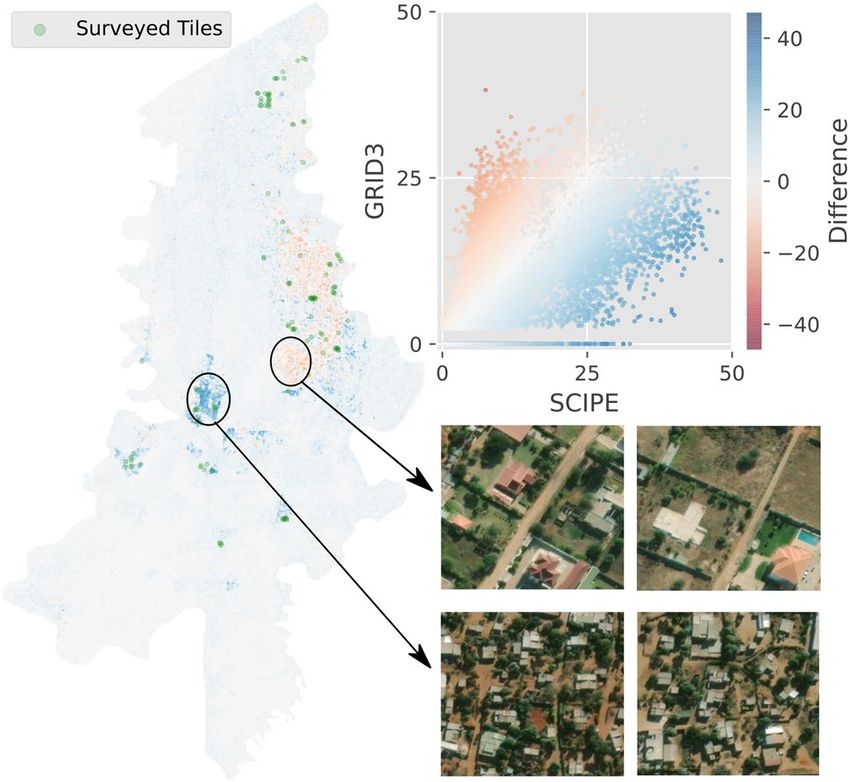
www.nature.com/scientificreports/
Figure 2. ResNet-50 ImageNet predictions and architecture. (a) ImageNet class predictions for very-high-
resolution satellite image tiles. Although the classes are irrelevant, the network shows an intrinsic understanding
of the difference between built-up area, vegetation, and road. (b) Diagram of ResNet-50 encoder. Residual
blocks between Input and Global Average Pooling are comprised of convolutional layers with interleaved batch
normalization layers.
Doupe et al.23 used an adapted VGG25 convolutional neural network (CNN) trained on a concatenation of low
resolution Landsat-7 satellite images (7 channels) and night-time light images (1 channel). The VGG network
was trained on observations generated from 18,421 population labeled enumeration areas from the 2002 Tan-
zanian census, and validated on observations generated from 7,150 labeled areas from the 2009 Kenyan census.
The authors proposed using the output of the VGG network as a weighted surface for population disaggregation
from regional population totals. This approach significantly outperformed AsiaPop (a precursor to WorldPop)
in RMSE, %RMSE, and MAE evaluation metrics.
Robinson et al.1 trained an adapted VGG25 CNN on Landsat-7 imagery from the year 2000 and US data from
the year 2004, and validated it on Landsat and data from the year 2010. The authors split the US into 15 regions,
and trained a model for each with around ∼ 800,000 training samples in total. Instead of predicting popula-
tion count directly, the authors classified image patches into log scale population bands, and determined final
population count by the network output weighted average of band centroids. Existing approaches for projecting
data outperformed the final network when validated against the 2010 US census, however, the fitted model was
interpretable as evidenced through examples of images that were confidently assigned to a particular population
band with sparsely populated areas being assigned to a lower population band and more urbanized areas being
assigned to progressively higher population bands.
Hu et al.24 generated population density maps at the village level in rural India using a custom VGG CNN
based end-to-end learning. The authors used freely available high-resolution Landsat-8 imagery (30 m resolu-
tion, RGB channels only) and Sentinel-1 radar imagery (10 m resolution, converted to RGB) images of villages as
predictor, and respective population from the 2011 Indian census as response. The training set included 350,000
villages and validation set included 150,000 villages across 32 states, and the resulting model outperformed
two previous deep learning based approaches1,23. The authors observed that the approach performed better at a
coarser district level resolution than a finer village level resolution.
Both census-dependent and census-independent approaches have their advantages and drawbacks. While
census-dependent estimation is cheaper to perform using existing data, the results can be misleading if the
projected intercensal population count is inaccurate, and due to the limited resolution of both data and publicly
available satellite imagery, these approaches exclusively predict population at a coarser spatial resolution. Census-
independent estimation uses microcensus, which can be collected more frequently and is available at a finer scale,
and although this data can be relatively expensive to collect in large enough quantities, it provides ‘ground truth’
information at a finer scale which is not available for census-dependent approaches.
Methods and data
In this section we discuss some recent advancements in the principles and tools for self-supervised learning,
partly in the context of remote sensing (section “Representation and transfer learning”), provide details of SCIPE,
and the datasets used, i.e., satellite imagery and microcensus.
Representation and transfer learning. Representation Learning learns a vector representation of an
image by transforming the image, for example, using deep neural network, such that the corresponding rep-
resentation can be used for other tasks such as regression or classification using existing tools13. The learned
representation can be used for transfer learning, i.e., using the transformation learned from a separate task, e.g.,
ImageNet classification, for a different one, e.g., population e stimation12. Intuitively, this happens since a pre-
trained network, although designed for a separate task, can extract meaningful features that can be informative
for population estimation (see for example Fig. 2a).
Scientific Reports | (2022) 12:5185 | https://doi.org/10.1038/s41598-022-08935-1 4
Vol:.(1234567890)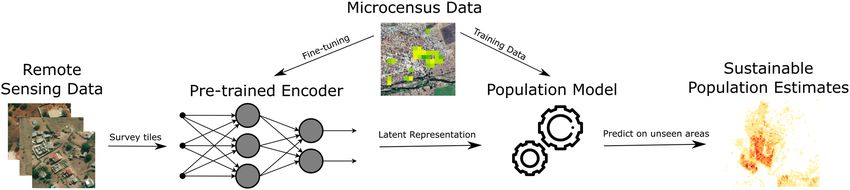
www.nature.com/scientificreports/
Supervised pre-training is a common approach for representation learning where a network is trained in a
supervised learning context with a vast amount of annotated training data such as ImageNet. Once the network
has been trained on this task, the output of the penultimate layer (or a different layer) of this pre-trained network
can be used as a vector representation of the respective input image, and can be used as a predictor for further
downstream analysis12. This approach works well in practice but its performance is inherently limited by the size
of the dataset used for supervised learning which can be ‘small’26. To mitigate this issue, representation learn-
ing using unsupervised methods such as Tile2Vec27, and in particular, self-supervised approaches have become
popular. Compared to supervised learning which maximizes the objective function of a pre-defined task such
as classification, self-supervised learning generates pseudolabels from a pretext task in the absence of ground
truth data, and different algorithms differ in the way they define the pretext t asks28.
In the context of population estimation, we focus on methods that either assume that the latent representa-
tions form c lusters26 or make them invariant to certain class of distortions29. Our intuition is that grid tiles can be
grouped together based on population. This is a common practice in census-independent population estimation,
i.e., to split regions in categories and model these categories separately, e.g., s ee11 and23. We also observe this
pattern in the representation space where built-up area separates well from uninhabited regions (see Fig. 5b).
Additionally, we expect the population count of a grid tile to remain unchanged even if, for example, it is rotated,
converted to grayscale, or resized.
DeepCluster26 (and DeepClusterV2) jointly learns parameters of a deep neural network and the cluster
assignments of its representations. It works by iteratively generating representations using an encoder model
that transforms the image to a vector, clustering these representations using a k-means clustering algorithm,
and using these cluster assignments as pseudo-labels to retrain the encoder. The intuition behind this being
that CNNs, even without training, can find partially useful representations, and therefore clusters, due to their
convolutional structure. This weak signal can be exploited to bootstrap a process of iterative improvements to
the representation and cluster quality.
SwAV30 clusters the representation while simultaneously enforcing consistency between cluster assignments
produced for different distortions. This involves applying augmentations to each image, yielding two different
views of the image, which are then fed through the model, clustered, and compared to train the model. In par-
ticular, to enforce consistent cluster assignments between the views of the image, the cluster assignment of a
view is predicted from the representation of another view of the same image. SwAV applies horizontal flips, color
distortion and Gaussian blur after randomly cropping and resizing the image. Cropping affects the population
of a grid tile, however, since satellite imagery alone can estimate population with some uncertainty, we assume
that cropping will change population within this level of uncertainty. Although cropping is used as a data aug-
mentation step in the existing pre-trained network, we avoid cropping as data augmentation when fine-tuning
the network to predict population in section “Models and training”.
Barlow Twins29 also works by applying augmentations to each image, yielding two views of the image, which
are then fed through the model to produce two representations of the original image. To avoid trivial constant
solutions of existing self-supervised learning approaches aiming to achieve invariance to distortions, Barlow
Twins considers a redundancy-reduction approach, i.e., the network is optimized by maximizing the correla-
tion along the main diagonal of the cross correlation matrix in the representation space to achieve invariance,
while minimizing the correlation in all other positions to reduce redundancy of representations. Barlow Twins
applies cropping, resizing, horizontal flipping, color jittering, converting to grayscale, Gaussian blurring, and
solarization as distortions.
Satellite imagery and microcensus. Satellite imagery. We used proprietary 50cm resolution satellite
imagery (Vivid 2.0 from Maxar, WorldView-2 satellite) covering 7773 km2 across two districts in Mozambique:
Boane (BOA) and Magude (MGD). The Vivid 2.0 data product is intended as a base map for analysis. It has
worldwide coverage and is updated annually with priority given to the low cloud coverage images, and hence im-
ages can be from different time periods and different sensors in the Maxar constellation. The product is provided
already mosaicked and colour-balanced, increasing the transferability of any methods/algorithms developed
using this data. The data are provided in a three-band combination of red, green and blue. The NIR band is not
provided as part of the VIVID 2.0 data product. The procured data was a mosaic of images, mostly from 2018
and 2019 (83% and 17% for BOA and 43% and 33% for MGD, remainder from 2011 to 2020).
Microcensus. We used microcensus from 2019 conducted by SpaceSUR and GroundWork in these two dis-
tricts, funded by UNICEF. The survey was conducted at a household level (with respective GPS locations avail-
able), and households were exhaustively sampled over several primary sampling units (PSUs) where PSUs were
defined using natural boundaries, such as roads, rivers, trails etc. A total of 3011 buildings were visited in the
two districts with 1334 of the buildings being inhabited, housing 4901 people. Survey data was collected in
accordance with experimental protocol which was approved by UNICEF. Ethical approval was obtained from the
Ministry of Health in Mozambique. Oral consent was obtained from the household head, spouse or other adult
household member. We aggregated the household survey data to a 100 m grid to generate population counts
producing 474 labelled grid tiles.
Non‑representative tiles. Since the imagery and microcensus were not perfectly aligned temporally, and the
PSUs had natural boundaries, many tiles contained either unsurveyed buildings or surveyed buildings absent in
the imagery. Thus, the dataset contained both developed tiles (i.e. with many buildings) labeled as low popula-
tion, or undeveloped tiles labeled as high population. Although such ‘outlier’ tiles can be addressed with robust
training, they cannot be used for validation. We, therefore, manually examined each grid tile by comparing the
Scientific Reports | (2022) 12:5185 | https://doi.org/10.1038/s41598-022-08935-1 5
Vol.:(0123456789)www.nature.com/scientificreports/
Figure 3. Regional population map comparison and zero population tiles. (a) Gridded population count
estimates over Boane (top), and comparison against microcensus (bottom). Year indicates target year for
estimation where known, otherwise when estimates were published. We do not compare our results on the
microcensus as this was our training and validation data. (b) Examples of zero population tiles from section
“Satellite imagery and microcensus”.
GPS location of surveyed buildings with those appearing in the imagery, and excluded those with a mismatch,
leaving 199 curated tiles (CT).
Zero‑population tiles. Since the microcensus was conducted in settled areas, we had no labels for uninhabited
tiles. Although this does not pose a problem when comparing the performance of different models on the avail-
able microcensus (Table 2), the models do not learn to predict zero population when applied to an entire district
which will include many uninhabitated areas. To resolve this, we identified 75 random tiles (50 from BOA, 25
from MGD) with zero population (ZT) guided by HRSL, i.e., from regions where HRSL showed zero population.
We selected more ZTs from BOA to improve regional population estimates (see Fig. 3b). Thus, we had 274 grid
tiles in total.
Models and training. We use a ResNet-5031 CNN architecture to estimate population from grid tiles. The
model architecture is shown in Fig. 2b with 224 × 224 × 3 dimensional input and 49 convolutional layers fol-
lowed by a Global Average Pooling layer which results in a 2048 dimensional latent representation. We used the
pre-trained ResNet-50 models trained on ImageNet using methods described in section “Representation and
transfer learning” after resizing the grid tiles of size 200 × 200 × 3 (100 m RGB) to 224 × 224 × 3, and used
these (representation, population) pairs to train a prediction model using Random Forest. The hyperparameters
of the model were chosen using a grid search over num_estimators ∈ {100, 200, . . . , 500}, min_samples_
split ∈ {2, 5} and min_samples_leaf ∈ {1, 2}. A linear regression head can also be trained to predict
population in an end-to-end manner. This yields several advantages: rapid inference on GPUs, a simple pipeline,
and a simple method for determining uncertainty. However, we observed that the Random Forest model outper-
formed the linear regression head.
Pre‑trained model. We used pre-trained ResNet50 models described in section “Representation and transfer
learning” to extract representations, and also fine-tuned these models with microcensus.
Fine‑tuning. We fine-tuned the pretrained models using a combination of curated and zero grid tiles after
attaching a linear regression head following the global average pooling layer and minimizing the ℓ2 loss between
observed and predicted population. Given the labelled grid tiles (number of grid tiles vary depending on experi-
mental set-up), we randomly split them into training and validation sets (80–20%). Due to the limited number of
tiles in the dataset, we apply random dihedral transformations (i.e. reflections and rotations) to tiles to augment
Scientific Reports | (2022) 12:5185 | https://doi.org/10.1038/s41598-022-08935-1 6
Vol:.(1234567890)www.nature.com/scientificreports/
the training set, avoiding transformations that could affect the validity of the population count e.g. crops that
could remove buildings. We use Adam optimizer to minimize the loss function which takes about 1 minute with
a batch size of 32 on a single Nvidia GTX 1070 with 8GB of VRAM. During training, first, the network was fro-
zen (i.e., the weights were kept fixed) and only the regression head was trained for 5 epochs with a learning rate
of 2 × 10⁻³, and second, the entire network was trained using a discriminative learning rate32, where the learning
rate is large at the top of the network, and is reduced in the earlier layers, avoiding large changes to the earlier
layers of the model which typically extract more general features, and focusing training on the domain-specific
later layers. The base learning rate at the top of the network was 1 × 10⁻³, and it was decreased in the preceding
stages to a minimum of 1 × 10⁻⁵. We used early stopping to halt training when validation loss plateaued (i.e., no
improvement for 2 or more epochs) to avoid overfitting.
Evaluation metrics and cross‑validation. Evaluation metrics. We compare the different methods
against several evaluation metrics, i.e., R-squared, median absolute error (MeAE), median absolute percentage
error (MeAPE), and aggregated percentage error (AggPE) (to capture average error at regional levels character-
ised by A), as follows,
R2 = 1 − (yi − ŷ)2 / (yi − ȳ)2 MeAE = median |yi − ŷi |
i i
MeAPE = median |yi − ŷi |/yi AggPE = medianA
yi − ŷi
/ yi
i∈A i∈A i∈A
These evaluation metrics capture different aspects of the prediction, and each has different significance. For
example, R2 may be dominated by large population counts while MeAPE may be dominated by small popula-
tion counts.
Null model. As ‘null model’ we predict population as the mean of the training set irrespective of feature values.
We used this as an initial baseline to ensure any perceived performance when transferring features from Ima-
geNet is not trivial.
Baseline. To properly assess the performance of automatic feature extraction, we compared to results when
using hand-crafted features and public datasets to predict population that is more common for census-inde-
pendent population estimation. We took a variety of public features (Landsat imagery, land cover classification,
OSM road data, night-time lights), along with building footprints automatically extracted from each image tile
using a U-Net model pre-trained on SpaceNet and fine-tuned with ‘dot-annotation’ from non-surveyed build-
ings, and using these features to train a Random Forest model.
Cross‑validation. We compare the different approaches to population estimation using cross-validation. For
each region, we partitioned the data into four subsets spatially, and formed validation folds by taking the union
of these subsets across the two regions. We reported the evaluation metrics over pooled predictions from the
four validation folds covering the entire microcensus. When fine-tuning, we trained one network for each fold
separately (to avoid data leakage) resulting in four networks.
Results
In this section, we compare the performance of several self-supervised learning frameworks using cross-valida-
tion, apply the best performing model to predict a regional map of Boane, and compare it against existing maps
from GRID3, HRSL and WorldPop where all of these methods take a census-dependent approach to popula-
tion estimation within our ROIs, and cannot be regarded as ‘ground-truth’. We show the interpretability of the
framework using uncertainty quantification and activation maps.
Model selection. Table 3 shows the cross-validation results for population estimation using Random Forest
regression on representations extracted using ResNet-50 model with curated tiles only. We observe that, (1) rep-
resentations extracted using any pre-trained network outperformed estimation using publicly available features
in all but MeAE metric, (2) fine-tuning any of the representation learning frameworks with microcensus, besides
DeepCluster, resulted in an improvement of the performance of the framework, (3) although all of the represen-
tation learning framework (best MeAE = 3.91) outperformed than the null model (MeAE = 7.57), the baseline
models trained with building footprint area (best MeAE = 3.75) as a feature still outperformed them in R2 and
MeAE, and (4) Barlow Twins overall had lower error metrics and the second largest R2 metric among the fine-
tuned models, so we consider this model for further analysis. We did not evaluate the performance of Tile2Vec
since the available pre-trained model required an NIR band for input data, which Vivid 2.0 lacks.
Regional population estimation. We use representations learned with a ResNet50 architecture pre-
trained on ImageNet using Barlow Twins and fine-tuned using curated and zero grid tiles (with 80-20 random
train/validation split of all tiles, no cross-validation) to extract representations for our survey tiles. These repre-
sentations are used to train a Random Forest model (section “Models and training”), which is used to produce
a population map for Boane district. The map is shown in Fig. 3a along with three existing population maps
from WorldPop, HRSL and GRID3. We observe that, with respect to our ‘ground truth’ microcensus, (1) GRID3
Scientific Reports | (2022) 12:5185 | https://doi.org/10.1038/s41598-022-08935-1 7
Vol.:(0123456789)www.nature.com/scientificreports/
Figure 4. Clockwise from left: Difference between SCIPE and GRID3 population maps for Boane, the
respective scatter plot, and examples of survey tiles from regions where they differ.
Features used R2 MeAPE MeAE (%) IQR AggPE (%)
Hand-crafted features
Public only − 0.22 57.8 5.05 8.60 21.5
Footprint only 0.47 44.5 3.75 5.86 02.2
Public + Footprint 0.46 48.8 4.63 5.11 07.6
Representation learning
Supervised 0.20 54.7 5.36 7.97 02.0
Supervised (FT) 0.33 52.9 4.72 6.23 05.5
SWAV 0.34 51.6 6.60 4.33 00.8
SWAV (FT) 0.41 46.9 5.83 4.35 03.5
DeepCluster 0.26 50.3 4.60 6.03 06.7
DeepCluster (FT) 0.13 62.5 5.98 8.32 06.8
Barlow Twins 0.27 51.9 5.40 6.65 02.8
Barlow Twins (FT) 0.39 44.0 3.91 6.32 01.1
Null model
None − 0.12 76.45 7.57 10.0 01.7
Existing maps
GRID3 0.22 51.7 4.25 7.11 26.7
HRSL − 0.12 70.7 5.04 7.94 46.8
WorldPop − 0.41 86.8 5.85 8.18 77.9
Table 3. Population model validation performance for (top) manually and automatically extracted features,
along with (bottom) test performance of existing maps. See section “Results” for metric definitions. IQR is
interquartile range of absolute errors. Bold indicates best in category. FT fine-tuning.
provides a more accurate population map of Boane than HRSL and WorldPop, but usually underestimates popu-
lation, (2) WorldPop lacks the finer details of the other population maps, and underestimates population, (3)
although the settlement map provided by HRSL matches that of SCIPE and GRID3 well, its similarity with
SCIPE is less than that of GRID3, and (4) SCIPE and GRID3 provide visually similar settlement map, and the
population estimates are also more similar in scale compared to HRSL and WorldPop.
Census. We additionally compare the aggregated population estimate in Boane with the 2019 census projec-
tion of the 2017 census, and we observe that SCIPE overestimates population by 29%. Although projected census
is not the ground truth, the discrepancy in estimated population is potentially due to SCIPE not modelling zero
population explicitly, i.e., zero population grid tiles can be assigned a small population. This issue can potentially
Scientific Reports | (2022) 12:5185 | https://doi.org/10.1038/s41598-022-08935-1 8
Vol:.(1234567890)www.nature.com/scientificreports/
be addressed by creating a binary mask to set small population to hard zero values, or training SCIPE with more
negative samples, i.e., grid tiles with zero population that are collected in a more principled manner, to better
model these zero values. We leave this as future work.
Since GRID3 provides a more accurate population map than HRSL and WorldPop, we compare it against
SCIPE in more detail. Figure 4 shows the difference in population maps produced by these two approaches. We
observe that, (1) the estimated population of these approaches matched well quantitatively (Spearman’s ρ 0.70,
Pearson’s ρ 0.79), (2) there are regions where SCIPE underestimated population compared to GRID3, and these
are areas where microcensus was not available, and (3) there are regions where GRID3 underestimated popula-
tion, and they usually coincided with regions where microcensus was available and SCIPE could potentially
provide better estimates. Therefore, there is a high level of agreement between the two products and they provide
similar estimates, and discrepancies appear in regions that lack microcensus for training. A more detailed com-
parison of these two population maps will be valuable, and may lead to both improved population estimation
through ensemble learning and better microcensus data collection through resolving model disagreements.
However, this is beyond the scope of this work.
Uncertainty. To further assess the quality of the estimated population map, we quantify the uncertainty
and qualitatively assess their ‘explanations’. We can assess the uncertainty of predictions in several ways either at
the level of the representation learning or at the level of the Random Forest population model. For the former,
we can apply Monte Carlo dropout33 by placing dropout layers ( p = 0.1) after each stage of the ResNet models,
and predicting multiple population value for each grid tile. For the latter, the uncertainty can be quantified from
the output of the individual decision trees in the Random Forest model without perturbing the representation.
Figure 5c shows Random Forest model predictions on fine-tuned Barlow Twins features and their associated
uncertainties. We observe that the estimated uncertainty matches the intuition of higher estimated population
having higher uncertainty. We expect this since there are fewer samples with large population, and we expect
more variability in population for similar satellite images in populated areas.
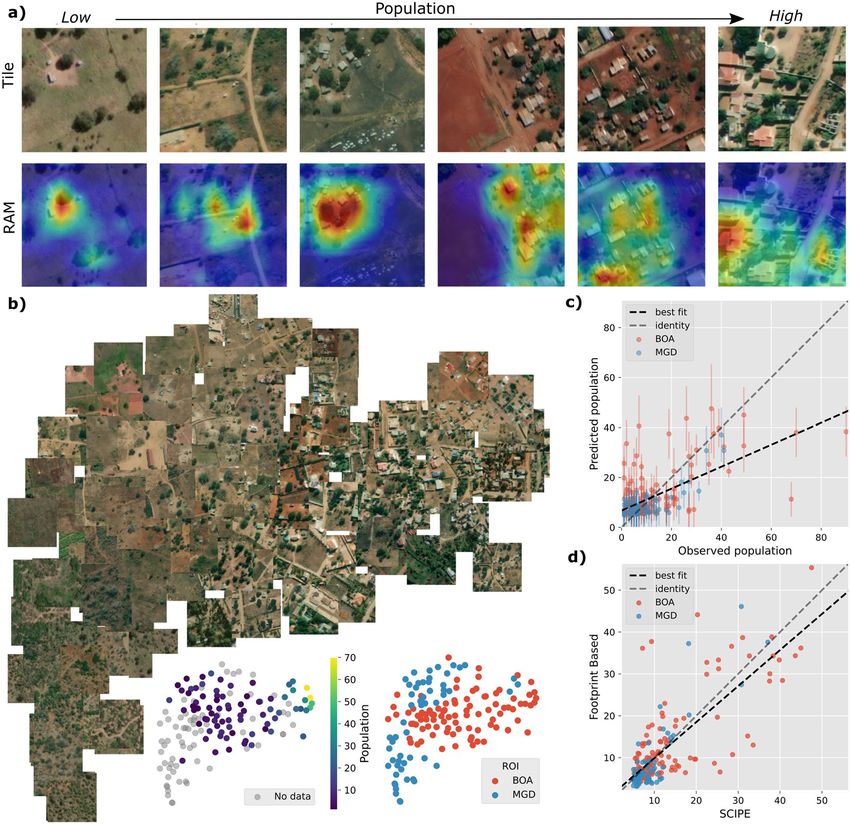
Explanation. To assess the outcome of the model, we use regression activation maps (RAMs)34 that show
the discriminative regions of input image that is informative of the outcome of the model. It is widely reported
that building footprint area is an important indicator of population, and therefore, we expect SCIPE to focus on
buildings when predicting population. We observe that a fine-tuned Barlow Twins model produces RAM plots
that show a clear focus on built-up area, which agrees with our expectation (see Fig. 5a). To further explore if
SCIPE focuses on built-up area to estimate population, we observe that population estimates using SCIPE and
that using building footprints (as presented in Table 3) show high correlation (Spearman’s ρ 0.68, Pearson’s ρ 0.74
over Boane region) (see Fig. 5d) corroborating this observation.
Embedding. Finally, we visualize the representations available from the fine-tuned Barlow Twins model to
assess if they meaningfully separate in terms of population, and we observe that this is indeed the situation (see
Fig. 5b).
Discussion
We find representation learning to be an effective tool for estimating population at a medium-resolution from
limited local microcensus. Although this approach did not outperform building footprint area based estimations;
it is fast, does not require human supervision, and only relies on very-high-resolution satellite images, making
it sustainable and transferable in the sense that users can extrapolate their own local microcensus with relative
ease, and also quantify uncertainty and capture explanations.
There is likely a hard limit to the predictive power of satellite imagery alone, owed to the difficulty of dis-
tinguishing inhabited and uninhabited areas in some contexts. For example, Robinson et al.1 gave the example
of Walt Disney World which is built to look like a settled area but has 0 population. To address this issue, an
interesting extension of SCIPE will be to use multiple data sources, such as night-time light, land-cover data,
altitude and slope information, location of services, of possibly different resolutions in the model alongside
very-high-resolution imagery without changing its core focus, i.e., of using pre-trained network and fine-tuning
them with limited amount of microcensus. Additionally cellphone data can be used to assess where people live
compared to places people just visit. This can potentially improve the prediction of population in areas that are
uninhabited. We have also used a Random Forest model which effectively treats grid tiles as independent and
identically distributed samples which they are not. Considering the spatial arrangement of grid tiles can improve
estimation further by using broader contextual information around it, for example to establish the socioeconomic
status or land use of the surrounding areas. Given a micro-census is conducted over a small region, it is likely
that any census-independent approach will make errors in regions that are far away from the sampling area and
potentially have different semantic characteristics, such as different building architecture or different land types.
This issue, however, can potentially be mitigated through conducting micro-census in areas where are the model
makes errors, and using this information to iteratively update the model.
Ideally, we would like to use self-supervised learning framework directly on satellite images to learn appropri-
ate representation, rather than relying on pre-trained networks and fine-tuning. This will, however, require a vast
quantity of training data, and has not been the focus of this work. In this work we have focused on sustainability,
both in terms of human annotation and computational resources which prohibits training from scratch, and
have shown that existing tools can be used to produce reliable population estimates. The proposed framework
should also be validated externally on a larger scale. We explored population of a single district in Mozambique
while existing population maps are available over the whole of Africa. Assessing the utility of SCIPE better would
Scientific Reports | (2022) 12:5185 | https://doi.org/10.1038/s41598-022-08935-1 9
Vol.:(0123456789)www.nature.com/scientificreports/
Figure 5. Activation maps, embedding visualization, and comparison of SCIPE with microcensus data and
footprint based estimates. (a) Tiles and their associated regression activation maps (RAMs) from fine-tuned
Barlow Twins model. (b) Plot of t-SNE embeddings of representations from Barlow Twins for 75 random tiles
and 75 microcensus tiles from Boane and Magude (main), with embeddings coloured by population (bottom
left) and region (bottom right). (c) Predicted over observed plot over microcensus with prediction uncertainty.
(d) Comparison between SCIPE estimates and building footprint based estimates on the microcensus grid tiles.
require further large scale validation both in different regions of Mozambique (which is our immediate focus),
and in other countries (which is our long term goal), to make population maps more frequent, accessible, reli-
able and reproducible.
SCIPE avoids several typical bottlenecks associated with census-independent population estimation. While
some methods require tedious manual annotation of built up area or potentially incomplete public features,
SCIPE extracts features automatically using only satellite images. SCIPE is extremely fast, requires negligible
GPU time, and provides meaningful population estimates. Microcensus data may not be available in all countries
or regions, and can be expensive to gather, but this cost is far lower than that of conducting census on a regular
basis. Very-high-resolution satellite imagery can also be expensive, but has become more accessible in recent
years when used for humanitarian purposes10. Given that many development agencies benefit from subsidised
access to the Maxar very-high-resolution imagery these population maps could be produced relatively quickly
for specific regions of focus, for example, when vaccination programmes are being planned. This approach,
therefore, would contribute towards the UNs stated need for a data revolution35 by allowing regularly updated
estimates of population between census enumeration periods supporting a range of humanitarian activities as
well as general governmental and NGO planning and allocation of resources.
Data availability
The satellite data that support the findings of this study are available from Maxar, but restrictions apply to the
availability of these data, which were used under license for the current study, and so are not publicly avail-
able. Data are however available from the authors upon reasonable request and with permission of Maxar. The
Scientific Reports | (2022) 12:5185 | https://doi.org/10.1038/s41598-022-08935-1 10
Vol:.(1234567890)www.nature.com/scientificreports/
microcensus data was used to generate gridded population counts at 100 m grid tiles. This data is demographic
in nature but is spatially aggregated. The gridded population count at a set of pre-defined grid tiles that support
the findings of this study are available upon request from UNICEF but restrictions apply to the availability of
these data.
Received: 5 October 2021; Accepted: 3 March 2022
References
1. Robinson, C., Hohman, F. & Dilkina, B. A deep learning approach for population estimation from satellite imagery. In Proceedings
of ACM SIGSPATIAL Workshop on Geospatial Humanities (2017).
2. Shearmur, R. Editorial—A world without data? The unintended consequences of fashion in geography. Urban Geogr.https://doi.
org/10.2747/0272-3638.31.8.1009 (2010).
3. United Nations, Department of Economic and Social Affairs and Population Division. World population prospects Highlights, 2019
revision Highlights, 2019 revision. OCLC: 1110010089 (2019).
4. Ezeh, A., Kissling, F. & Singer, P. Why sub-Saharan Africa might exceed its projected population size by 2100. Lancet 396, 1131–
1133. https://doi.org/10.1016/S0140-6736(20)31522-1 (2020).
5. Linard, C., Gilbert, M., Snow, R. W., Noor, A. M. & Tatem, A. J. Population distribution, settlement patterns and accessibility across
Africa in 2010. PLoS One. https://doi.org/10.1371/journal.pone.0031743 (2012).
6. Lab, F. C. & for International Earth Science Information Network CIESIN Columbia University, C. High resolution settlement
layer (HRSL) (2016).
7. Tiecke, T. G. et al. Mapping the world population one building at a time. https://doi.org/10.1596/33700. arXiv:1712.05839 (2017).
8. Bondarenko, M., Jones, P., Leasure, D., Lazar, A. & Tatem, A. Gridded population estimates disaggregated from Mozambique’s
fourth general population and housing census (2017 census), version 1.1. https://doi.org/10.5258/SOTON/WP00672 (2020).
9. Wardrop, N. et al. Spatially disaggregated population estimates in the absence of national population and housing census data.
PNAS. https://doi.org/10.1073/pnas.1715305115 (2018).
10. Engstrom, R., Newhouse, D. & Soundararajan, V. Estimating small-area population density in Sri Lanka using surveys and geo-
spatial data. PLoS One 15, e0237063. https://doi.org/10.1371/journal.pone.0237063 (2020).
11. Leasure, D. R., Jochem, W. C., Weber, E. M., Seaman, V. & Tatem, A. J. National population mapping from sparse survey data: a
hierarchical Bayesian modeling framework to account for uncertainty. PNAS. https://doi.org/10.1073/pnas.1913050117 (2020).
12. Razavian, A. S., Azizpour, H., Sullivan, J. & Carlsson, S. CNN features off-the-shelf: An astounding baseline for recognition. In
Proceedings of CVPR Workshops, 512–519. https://doi.org/10.1109/CVPRW.2014.131 (2014).
13. Bengio, Y., Courville, A. & Vincent, P. Representation learning: A review and new perspectives.https://d oi.o
rg/1 0.1 109/T
PAMI.2 013.
50 (2013).
14. Linardatos, P., Papastefanopoulos, V. & Kotsiantis, S. Explainable AI: A review of machine learning interpretability methods.
Entropy. https://doi.org/10.3390/e23010018 (2020).
15. Weber, E. M. et al. Census-independent population mapping in northern Nigeria. Remote Sens. Environ. https://doi.org/10.1016/j.
rse.2017.09.024 (2018).
16. Hillson, R. et al. Estimating the size of urban populations using Landsat images: a case study of Bo, Sierra Leone, West Africa. Int.
J. Health Geogr.https://doi.org/10.1186/s12942-019-0180-1 (2019).
17. MacFeely, S. & Nastav, B. You say you want a [data] revolution: A proposal to use unofficial statistics for the SDG Global Indicator
Framework. Stat. J. IAOS 35, 309–327. https://doi.org/10.3233/SJI-180486 (2019).
18. Ye, Y., Wamukoya, M., Ezeh, A., Emina, J. B. O. & Sankoh, O. Health and demographic surveillance systems: a step towards full
civil registration and vital statistics system in sub-Sahara Africa?. BMC Public Health 12, 741. https://doi.org/10.1186/1471-2458-
12-741 (2012).
19. Hargreaves, P. K. & Watmough, G. R. Satellite Earth observation to support sustainable rural development. Int. J. Appl. Earth
Observ. Geoinf. 103, 102466. https://doi.org/10.1016/j.jag.2021.102466 (2021).
20. Watmough, G. R. et al. Socioecologically informed use of remote sensing data to predict rural household poverty. Proc. Natl. Acad.
Sci. 116, 1213–1218. https://doi.org/10.1073/pnas.1812969116 (2019).
21. Steele, J. E. et al. Mapping poverty using mobile phone and satellite data. J. R. Soc. Interface 14, 20160690. https://doi.org/10.1098/
rsif.2016.0690 (2017).
22. Watmough, G. R., Atkinson, P. M. & Hutton, C. W. Exploring the links between census and environment using remotely sensed
satellite sensor imagery. J. Land Use Sci. 8, 284–303. https://doi.org/10.1080/1747423X.2012.667447 (2013).
23. Doupe, P., Bruzelius, E., Faghmous, J. & Ruchman, S. G. Equitable development through deep learning: The case of sub-national
population density estimation. In Proceedings of ACM DEV, 1–10. https://doi.org/10.1145/3001913.3001921 (2016).
24. Hu, W. et al. Mapping missing population in rural India: A deep learning approach with satellite imagery. In Proceedings of
AAAIhttps://doi.org/10.1145/3306618.3314263 (2019).
25. Simonyan, K. & Zisserman, A. Very deep convolutional networks for large-scale image recognition. In Proceedings of ICLR (2015).
26. Caron, M., Bojanowski, P., Joulin, A. & Douze, M. Deep clustering for unsupervised learning of visual features. In In Proceedings
of the ECCV. https://doi.org/10.1007/978-3-030-01264-9_9 (2018).
27. Jean, N. et al. Tile2vec: Unsupervised representation learning for spatially distributed data. In Proceedings of the AAAI. https://
doi.org/10.1609/aaai.v33i01.33013967 (2019).
28. Jing, L. & Tian, Y. Self-supervised visual feature learning with deep neural networks: A survey. IEEE Trans. Pattern Anal. Mach.
Intell.https://doi.org/10.1109/TPAMI.2020.2992393 (2020).
29. Zbontar, J., Jing, L., Misra, I., LeCun, Y. & Deny, S. Barlow twins: Self-supervised learning via redundancy reduction. arXiv:2103.
03230 (2021).
30. Caron, M. et al. Unsupervised learning of visual features by contrasting cluster assignments. In Proceedings of NeurIPS (2020).
31. He, K., Zhang, X., Ren, S. & Sun, J. Deep residual learning for image recognition. In Proceedings of CVPR. https://doi.org/10.1109/
CVPR.2016.90 (2016).
32. Howard, J. & Gugger, S. Deep Learning for Coders with fastai and PyTorch (O’Reilly Media, 2020).
33. Gal, Y. & Ghahramani, Z. Dropout as a Bayesian approximation: Representing model uncertainty in deep learning. In Proceedings
of ICML, 1050–1059. https://doi.org/10.5555/3045390.3045502 (PMLR, 2016).
34. Wang, Z. & Yang, J. Diabetic retinopathy detection via deep convolutional networks for discriminative localization and visual
explanation. In Proceedings of AAAI Workshops. https://doi.org/10.1109/ICVRV.2018.00016 (2018).
35. Independent expert advisory group on a data revolution for sustainable development. A world that counts: Mobilising the data
revolution for sustainable development. https://doi.org/10.7551/mitpress/12439.003.0018 (2014).
Scientific Reports | (2022) 12:5185 | https://doi.org/10.1038/s41598-022-08935-1 11
Vol.:(0123456789)www.nature.com/scientificreports/
Acknowledgements
The project was funded by the Data for Children Collaborative with UNICEF.
Author contributions
S.S., G.W. and M.S.D. conceived the study. I.N. and S.S. designed the study. I.N., S.S. and G.W. acquired the
remote sensing data. M.S.D. initiated the microcensus data collected. I.N. implemented the methods. I.N. and
S.S. analysed the data. I.N., S.S., G.W., and M.S.D. interpreted the results. I.N. and S.S. wrote the manuscript.
G.W. revised the manuscript. I.N., S.S., G.W. and M.S.D. approved the manuscript.
Competing interests
The authors declare no competing interests.
Additional information
Correspondence and requests for materials should be addressed to S.S.
Reprints and permissions information is available at www.nature.com/reprints.
Publisher’s note Springer Nature remains neutral with regard to jurisdictional claims in published maps and
institutional affiliations.
Open Access This article is licensed under a Creative Commons Attribution 4.0 International
License, which permits use, sharing, adaptation, distribution and reproduction in any medium or
format, as long as you give appropriate credit to the original author(s) and the source, provide a link to the
Creative Commons licence, and indicate if changes were made. The images or other third party material in this
article are included in the article’s Creative Commons licence, unless indicated otherwise in a credit line to the
material. If material is not included in the article’s Creative Commons licence and your intended use is not
permitted by statutory regulation or exceeds the permitted use, you will need to obtain permission directly from
the copyright holder. To view a copy of this licence, visit http://creativecommons.org/licenses/by/4.0/.
© The Author(s) 2022
Scientific Reports | (2022) 12:5185 | https://doi.org/10.1038/s41598-022-08935-1 12
Vol:.(1234567890)You can also read