Computers, Environment and Urban Systems
←
→
Page content transcription
If your browser does not render page correctly, please read the page content below
Computers, Environment and Urban Systems 87 (2021) 101619
Contents lists available at ScienceDirect
Computers, Environment and Urban Systems
journal homepage: www.elsevier.com/locate/ceus
Urban function classification at road segment level using taxi trajectory
data: A graph convolutional neural network approach
Sheng Hu a, Song Gao b, Liang Wu a, c, *, Yongyang Xu a, Ziwei Zhang a, Haifu Cui a, Xi Gong a
a
School of Geography and Information Engineering, China University of Geosciences, Wuhan 430074, China
b
GeoDS Lab, Department of Geography, University of Wisconsin-Madison, Madison, WI, USA
c
National Engineering Research Center of Geographic Information System, Wuhan 430074, China
A R T I C L E I N F O A B S T R A C T
Keywords: Extracting hidden information from human mobility patterns is one of the long-standing challenges of urban
Traffic interaction patterns studies. In addition, exploring the relationship between urban functional structure and traffic spatial interaction
Urban functions pattern has long been of interest. Recently, vehicle GPS trajectory data emerged as a popular data source for
Vehicle GPS trajectory data
revealing human mobility patterns and urban functions. However, few studies have fully leveraged traffic
Semantic embedding
Graph convolutional neural network
interaction information that is hidden in human mobility patterns to identify urban functions at the road segment
level. To address this issue, a geo-semantic analysis framework was introduced in this study to model the
relationship between traffic interaction and urban functions at the road segment level. First, a Road-Trajectory
corpus was built and trained to obtain the semantic embedding representation of road segments. Then,
considering topological connections between road segments, we used a graph convolutional neural network
model to process the contextual and topological information to classify social functions along streets. A case
study in Beijing, China, using a large volume of real-world taxi trajectories data, was conducted. The results show
that our proposed methods, with relative less loss and high accuracy, outperform other comparative methods for
classifying urban functions at the road segment level. This work contributes to the assessment of urban functional
structure, and further aiding urban planners in designing better urbanization strategies with regard to traffic
interaction and urban space structure.
1. Introduction characterizing the activity of a city and getting a sense of its urban dy
namics (Liu et al., 2015).
Extracting hidden information from human mobility and activity The proliferation of crowdsourcing technology and location-based
data is one of the long-standing challenges in the fields of urban geog services and the emergence of individual-level trajectory data create
raphy (Gonzalez, Hidalgo, & Barabasi, 2008; Huang, Li, Liu, & Ban, unprecedented opportunities for researchers to better understand
2015), land use planning (Castro, Zhang, Chen, Li, & Pan, 2013), and human mobility and the social functions of urban regions (Zheng et al.,
traffic planning (Jiang, 2009). Recently, numerous in-depth discussions 2014). Human activity trajectory data containing valuable information
have been conducted to explore urban land use and urban functions via on how urban spaces are used are generated by people in their daily
human mobility and activity information (Barbosa et al., 2018; Gao, lives. Generally, this type of trajectory data includes vehicle GPS records
Janowicz, & Couclelis, 2017; Wu et al., 2020). As one of the conceptual (Yang et al., 2018), mobile phone positioning data (Pei et al., 2014), and
and practical themes in human mobility, traffic interaction patterns are social media check-in data (Martí, Serrano-Estrada, & Nolasco-Cirugeda,
closely related to urban functions. They indicate the routes and purposes 2019). A GPS-enabled taxi is flexible and its movements are usually
of the trips that people take in cities at the individual level and the widely covered in urban regions. Such data has much higher precision
spatial interaction patterns between urban regions from the collective than other data sources. The related research scale and throughput have
perspective (Yang, Stewart, Tang, Xie, & Li, 2018; Zheng, Capra, Wolf not been limited by the accessibility of qualified data and privacy issues.
son, & Yang, 2014). The exploration of traffic interaction patterns not Due to its powerful ability to aid the monitoring of real-time traffic
only helps to understand urban structures but contributes to situations and the sensing of spatial interaction patterns, taxi GPS data
* Corresponding author at: School of Geography and Information Engineering, China University of Geosciences, Wuhan 430074, China.
E-mail address: wuliang@cug.edu.cn (L. Wu).
https://doi.org/10.1016/j.compenvurbsys.2021.101619
Received 11 October 2020; Received in revised form 10 February 2021; Accepted 17 February 2021
Available online 26 February 2021
0198-9715/© 2021 Published by Elsevier Ltd.
S. Hu et al. Computers, Environment and Urban Systems 87 (2021) 101619
has attracted much attention and it has been used with great success in Jauvin, 2003; Zhang et al., 2020), contextual and topological informa
multiple domains (Chen, Tao, Li, & Zhuo, 2016; Li et al., 2016; Siła- tion can be employed to indicate traffic interaction pattern hidden in
Nowicka et al., 2016; Yuan, Zheng, Zhang, & Xie, 2012). trajectories. Exploring this contextual and topological information is of
Attempts have also been made to understand urban structures and great significance.
social functions using taxi GPS records data. For instance, Zheng, Yan Road segments have geographical and topological association with
chi, Jing and Xing (2011) first introduced taxi GPS records to detect and other road segments, especially its neighbors. Road segment classifica
evaluate the effectiveness of urban land use planning. Liu, Wang, Xiao, tion task is dependent on both the characteristics of that road segment,
and Gao (2012) employed seven-day taxi records to depict intra-urban and its connected ones (Kwan, 2007). Therefore, a spatial prediction
land use from travel behavior patterns. This study borrowed the model is needed that can consider connections and integrate the char
“source to sink” concept from the field of ecological studies, investi acteristics of its neighbors. Moreover, vehicles moving within a city are
gating the temporal variations of pick-ups and drop-offs to characterize naturally constrained by urban roads. As a typical graph structure in
daily travel patterns and attempting to reveal their association with complex network study, urban road networks have been widely
urban land uses in the city of Shanghai, China. Yuan, Zheng, and Xie explored in urban studies and planning (Zhao et al., 2020). With
(2012) proposed a DRoF (Discovers Regions of different Functions) powerful modeling ability for graph-structured data, graph convolu
framework, which uses a topic-based inference model based on features tional neural networks (GCNN) has received much attention from re
extracted from taxi GPS trajectories data and points of interest (POIs) searchers (Defferrard, Bresson, & Vandergheynst, 2017; Yan, Ai, Yang,
data. In particular, the DRoF model featured the function of an urban & Yin, 2019; Zhu et al., 2020). By representing an urban road network as
parcel by using the temporal statistics of pick-up and drop-off locations a road graph and aggregating characteristics of neighboring nodes, the
within this parcel. Also, Liu, Gao, and Lu (2019) attempted to measure contextual and topological information hidden in roads can be explored
and incorporate spatial interaction patterns in classifying and under at a deeper level with a GCNN model. GCNN can handle the urban road
standing urban land use. In sum, these studies mainly use temporal or network, which is structured for spatial interactions among irregular
spatial variations (such as pick-up and drop-off frequencies) to highlight geographical units (Zhu et al., 2020).
the potential role of taxi GPS records in monitoring people’s travel In this study, we presented a geo-semantic analysis framework to
patterns and revealing urban functional structure. In general, a taxi investigate the traffic interaction patterns at a fine scale and evaluate the
travel route is consecutive and consists of the pick-up location, several relationship between traffic interaction and urban functions. First, by
intermediate GPS records and the drop-off location. Pick-up and drop-off analogizing road segments and taxi GPS trajectories (traffic elements) to
locations represent the travel purposes of people, while intermediate words and sentences (linguistic terms in NLP), we built a Road-
GPS records also contain valuable information, such as the movement Trajectory corpus and learned a geo-semantic embedding representa
flows and traffic states, which have not been thoroughly explored tion from training a Word2Vec model. Then we introduced a GCNN
(Zheng et al., 2014). model to classify the social functions of road segments based on the
The momentum to collect geo-spatial data at a large volume, and the extracted geo-semantic embedding features. The purpose of this study is
proliferation of new methods in machine learning and deep learning to address these issues:
bring unprecedented opportunities to explore the implicit information
from geo-enriched trajectory data. By converting from original vehicle • Classifying urban functions at the road segment level using traffic
route GPS records into consecutive tracking sequences, several in-depth interaction information extracted from taxi GPS trajectories data;
studies have been conducted to leverage the route records to explore • Presenting a GCNN model with geo-semantic embedding represen
sequential information on trajectories, which have a significant corre tation to improve the performance of urban function prediction task.
lation with traffic interaction. For example, taking language as an
analogy and regarding the mobile user anchor sequence (mobile user The remainder of this paper is organized as follows. The presented
trajectory) as sentence and areal research unit as word, Li, Fei, and framework, including study materials and methods, is introduced in
Zhang (2019) introduced a novel regionalization approach based on Section 2. The implementation and findings are then discussed in Sec
Word2Vec model, a representation learning model in the field of natural tion 3. Discussion and potential limitations of this work are outlined in
language processing (NLP), for portioning and grouping spatial parcels Section 4. The conclusions are drawn in Section 5.
in an urban area. Embracing the same idea, Zhang et al. (2020) proposed
the Traj2Vec model to classify urban land use type and measured the 2. Framework
degree to which urban land use is mixed. However, different with mo
bile user trajectories analysis on areal units, vehicle movements are 2.1. Overview
carried along the streets and constrained by urban road networks (Liu,
Gao, & Lu, 2019; Zhu, Wang, Wu, & Liu, 2017). Therefore, many re In this study, a geo-semantic analysis framework to investigate the
searchers have attempted to investigate traffic interaction at the road linkage between traffic interaction patterns among road segments and
segment level along the urban road network (Chu et al., 2014; Zhang urban functions is proposed (Fig. 1). Geo-semantic analysis takes
et al., 2016). advantage of semantic embedding technology (Bengio, Courville, &
In an urban road network, roads are not isolated but connected. Vincent, 2013; Mikolov, Chen, Corrado, & Dean, 2013) in the field of
Existing studies usually assume that roads within a certain spatial or NLP, analogizing traffic (or spatial) elements to NLP terms and then
topological distance are correlated with each other. However, the building high dimension embedding vectors to quantitatively represent
studies in spatial heterogeneity of traffic impacts are still insufficient, the traffic elements, thereby investigating potential information in
and their potential remains to be tapped (Cheng, Haworth, & Wang, geographical data (Liu, Pelechrinis, & Labrinidis, 2019; Yao et al., 2017;
2012; Wang, Wei, He, Gong, & Wang, 2014; Zou, Yue, Li, & Yeh, 2012). Zhai et al., 2019). We start with collecting multi-sourced datasets,
For example, upstream road traffic flows usually do not spread uni including taxi trajectory data, urban road network data, and POIs data
formly to its neighborhood roads (e.g., downstream and bidirected within the research area. Then, we build geo-semantic embedding fea
roads), but are concentrated in specific directions. The operation of a tures/vectors and obtain urban functions a road segment perspective by
large number of motor vehicles in the urban road network generates using the auxiliary data of POIs. Specifically, we build a Road-Trajectory
traffic flow, while the different driving behavior of different vehicles corpus based on the geo-semantic analogizing assumption and employ a
result in diverse traffic interaction patterns. Since roads are adjacent and Skip-gram based Word2Vec model to learn geo-semantic embedding
topologically connected, referring to the contextual relationship be features. At the last step we introduce a GCNN model and evaluation
tween words and documents in NLP (Bengio, Ducharme, Vincent, & metrics using the features constructed.
2
S. Hu et al.                                                    Computers, Environment and Urban Systems 87 (2021) 101619

               Fig. 1. An overview of the proposed framework.

                                     3
S. Hu et al. Computers, Environment and Urban Systems 87 (2021) 101619
2.2. Feature construction includes the pick-up location, drop-off location, and intermediate GPS
points. By means of a map matching algorithm (C. Yang & Gidofalvi,
2.2.1. Building the road-trajectory corpus 2018), GPS records were mapped to urban road segments. Each taxi
In the field of NLP, based on a large-scale semantic corpus, we can travel route can be represented as the sequence of unduplicated and
effectively train the language model and mine the potential semantic consecutive road segments (Fig. 2). Using these sequences, the final
representations or relationships. This corpus typically contains many documents of the Road-Trajectory corpus for the geo-semantic training
documents and each document consists of many words (Stefanowitsch & area were constructed. Note that we excluded vacant GPS data from this
Gries, 2007). Similarly, a geographical contextual corpus can be built in study.
the research field of geo-semantic mining (Hu et al., 2020; Yao et al.,
2017). In this study, we assumed that the traffic interaction pattern re 2.2.2. Training geo-semantic embedding model
flects the characteristics of the travel activities of urban people and that The geo-semantic mining method transforms the geographical (or
this pattern is closely related to the urban spatial structure. A Road- spatial) elements (such as urban functional parcels, POIs) to NLP ele
Trajectory corpus was developed on that basis. We divided the city’s ments, and then represents the spatial relationship or patterns between
main roads into road segments based on the significant traffic nodes elements as semantic information, to support various geographic ap
(such as intersections and T-junctions) within the road network. We plications. Word embedding is a popular geo-semantic representation
analogized road segments to NLP words, the trajectories (or routes) of method that represents spatial elements as high-dimensional semantic
vehicles to documents, and the study area to a corpus. The aim of embedding vectors and is widely applied to geographical clustering and
building such a corpus was to mine the traffic interaction patterns and classification studies. Word embedding has proved to be an effective and
potential contextual semantic relationships between road segments. It is practical approach in geographical semantic representation and urban
worth noting that semantic relationship is expressed in two ways in the functional structure mining (Yuan et al., 2014; Zhang et al., 2020). In
NLP: one is the co-occurrence relationship between words, such as this study, we introduced the Word2Vec model for the semantic repre
phones and laptops, which often appear concurrently in technical doc sentation of spatial elements. Specifically, we took the Road-Trajectory
uments; the other is the semantic similarity relationship between words, corpus as an input; by training the Skip-gram based Word2Vec model
such as laptops and desktops, which typically have identical semantics (Goldberg & Levy, 2014), contextual information and traffic interaction
(Katukuri, Raghavan, & Xie, 2013). In this study, the spatial semantic patterns can be investigated, and each road segment symbolizes a high-
relationship referred to co-occurrence relationships. A strong similarity dimensional feature vector. By entering the documents composed of
between two road segments suggests that both segments typically co- road segment sequences, the optimization goal of the Word2Vec model
occur along travel routes or that they share either upstream or down is to minimize the information loss function; that is, to maximize the
stream segments along the travel routes (Liu et al., 2017). probability of the occurrence of a trajectory route that connects those
As an essential mode of transportation for urban people, taxis oper road segments. The likelihood function of the Skip-gram model is as
ate in the urban road network. Taxi routes hold valuable information follows:
about human activity and the traffic flow. For one taxi route, it usually
Fig. 2. Mapping raw GPS records to a road segments sequence.
4
S. Hu et al. Computers, Environment and Urban Systems 87 (2021) 101619
∏
N ∏ ( ) Table 2
L(θ) = p ri | ri−i+ss (1) Mapping POI categories to the social functions of road segments.
i=1 − m≤s≤m,j∕
=0
No. POI category Count Social function
Where N refers to the number of road segments, s denotes the win
1 Car service 10,821 Traffic
dow size, and ri+s i− s represents context road segments of target road 2 Daily life service place 68,240 Public
segment ri. The conditional probability of generating the context road 3 Sports/recreation 19,308 Public
segments for the given target road segment p(ri| ri+s i− s) can be obtained by 4 Public facility 19,370 Public
5 Corporate business/factory 48,416 Commercial
performing a softmax operation:
6 Medical service 17,426 Public
( ) 7 Road facility 2387 Traffic
( ) exp ri , ri−i+ss
p ri | ri−i+ss = 1 ∑N i+s
(2) 8 Governmental and public organizations 45,848 Public
N i=1 exp(ri , ri− s ) 9 Residential 21,148 Public
10 Science and education 49,655 Public
Finally, we characterize each road segment in the road network as a 11 Shopping mall 116,345 Commercial
high-dimensional geo-semantic embedding vector. This vector implic 12 Transportation facilities 69,473 Traffic
itly contains deep traffic interaction information. The implementation of 13 Business building 34,911 Commercial
Word2Vec relies on the tools of genism (Rehurek & Sojka, 2010) in 14 Bank/financial 24,275 Commercial
15 Tourist attraction 8628 Public
Python. 16 Food and beverage place 56,989 Commercial
2.2.3. Obtaining urban functions from a road segment perspective
Because POIs can be used to infer areas of land with complex func inverse data frequency. Note that a greater value of wrj indicates the
tions and have a high availability from map services, such data is of POIs category j is more important in a road segment r.
practical significance in the study of urban spatial and social structures
(Zheng et al., 2014). Inspired by prior studies that employed POIs data to
investigate urban functional structure (Gao et al., 2017; Hu et al., 2020; 2.3. GCNN prediction model
Zhai et al., 2019), our method assumes that social functions at the road
segment level, such as residential, commercial, and transportation In the above steps, a road segment in the road network is charac
(Table 1), can be represented by the auxiliary data of POIs. As indicated terized as a geo-semantic embedding feature, which can be used to es
by existing studies, POIs data has become a promising source to repre timate the association between traffic interaction and urban functions at
sent urban functional structure in the absence of urban functional a street level. Road segments are not isolated in the urban road network
ground truth, especially in China (Wu et al., 2020; Zhang et al., 2020; but are linked topologically to each other. The estimation of a road
Zhang & Du, 2015). segment, therefore, depends on the features of both this road segment
Specifically, to classify the social functions of each road segment, the and its connected road segments. Considering the influence of topo
functions depending on the associated POI categories were grouped into logical adjacency of road segments, this study introduced a well-
three categories: commercial, public, and transportation (Table 2). established semi-supervised classification neural network model
Then, the Term Frequency-Inverse Document Frequency (TF-IDF) (GCNN) (Bruna, Zaremba, Szlam, & LeCun, 2013; Zhu et al., 2020) to
method (Ramos, 2003) was employed to calculate the weight of POI classify the social function of road segments based on high-dimensional
categories inside the buffer area of one road segment (in this paper, 100 embedding vectors.
m was employed as the buffer size). TF-IDF is an effective metric to First, we used the road network to construct a bidirectional dual
identify semantics and urban functions (Liu et al., 2020). The urban graph G ≡ (V, E), consisting of a set of vertexes V that connect edges E
function of a road segment can be subsequently identified by POI cate (Porta, Crucitti, & Latora, 2006). Vertexes V refers to road segments and
gories with a high weight. edges E refers to the topological connection between adjacent road
segments (Fig. 3). Each vertex k has a feature vector xk, which is sum
wrj = tf rj × idf rj (3) marized in a vector matrix Xn*d . where n represents the number of
vertexes, and d represents the dimensions of the feature vector.
Where wrj denotes the weight of POI category j for the road segment
Furthermore, the graph structure is described in a binary adjacency
r; tfrj= nr, j/nr means the term frequency; idfrj = log (N/Nj) means the
matrix A.
Second, the GCNN model was constructed based on an urban road
graph G (Zhao et al., 2020). The GCNN model is designed as a multilayer
Table 1
Functional Terminologies used in this study. neural network structure referred from traditional convolutional neural
networks (CNNs). However, since graph structure is structured in the
Terminologies Meaning
irregular spatial domain, CNNs cannot directly handle the urban road
Traffic roads Traffic roads are used to handle the link between the various graph. For the road graph structure, the most straightforward way to
functional parcels in the city and their connection with the city’s
construct a neural network is to expand all the nodes, with each node
external transportation hub. They are distinguished by high
traffic speed, wide lanes and few pedestrians. acting as a neuron processing unit, using the same weights and opera
Commercial Commercial roads are made up of shops on one side or both, and tions as in the multilayer perceptron (MLP) neural network. But infor
roads are the most common type of shopping space. Diversified roles, mation about the connections between nodes in the road graph, i.e., the
protection, comfort and facilitation of pedestrian activities road topology, is missing. To address this issue, Graph convolutional
characterize them.
Residential Residential roads are primarily linked to residential clusters for
filter is introduced to transform urban road graph to the spectral domain
roads walking bicycles and some motor vehicles, and a quiet and therefore the convolutional network structure is applied to handle
environment should be preserved by such roads. According to with complex network issues. Fig. 4 displays the proposed architecture
the concept of pedestrian priority, the spatial environment of GCNN with geo-semantic embedding.
should be organized, conducive to human activity and able to
In this work, The GCNN model was introduced to classify urban
facilitate people contact.
Public roads Public roads are designed to meet the needs of living activities functions at the road segment level using geo-semantic embedding
within the functional areas of the city, which are characterized features. GCNN has a typical three-level network architecture: an input
by low traffic speed. The lane can be slightly narrower, and both layer, two hidden layers and an output layer. Given an urban road graph
sides are usually configured for public buildings, parking lots, G, the GCNN model inputs G with geo-semantic embedding vector ma
and living services.
trix Xn*d , iteratively forward propagation operates with graph con
5

S. Hu et al. Computers, Environment and Urban Systems 87 (2021) 101619
Fig. 3. An example of converting road network sample to a dual graph representation.
volutional filter in hidden layers, and finally outputs the node-level road complementary indicator for model comparison.
graph G with the probability distribution of social functions Р. The
hidden layer can be described as a non-linear function: 3. Implementation and results
( )
H l+1 = f H l , A (4)
3.1. Study area and data description
l th 0
where H denotes the l neural network layer, especially H = Xn*d is the
China’s capital, the city of Beijing is the center of politics, culture,
input layer, and HL = Р is the output layer, l being the number of layers.
science, technology, and international exchange. Beijing has the largest
Specifically, the GCNN follows a layer-wise propagation rule f(∙, ∙),
urban built-up area and road traffic system in China. In recent years,
which can be expressed as:
with the acceleration of urbanization, new requirements have been put
( − 1/2 )
( )
̂ − 1/2 H l W l forward for road spatial planning and urban functional structure. The
f Hl , A = σ D ̂ ̂D
A (5)
study area was the central urban area within the 5th Ring Road of Bei
where σ(∙) denotes the non-linear activation function. In this paper, jing (Fig. 5.a), characterized by a diverse urban morphology and
a Rectified Linear Unit (ReLU) was adopt to introduce nonlinearity into elevated mixed land use rates. Taxis play an important role in intra-
urban transportation in Beijing. The dataset, collected GPS trajectories
the hidden layers (Glorot, Bordes, & Bengio, 2011). D ̂ − 1/2 A
̂D̂ − 1/2 de
of more than 12,000 taxis from November 1, 2011–November 14, 2011
notes the normalized Laplacian matrix, which making GCNN taking
in Beijing. The format of a GPS record comprises of taxi ID, longitude,
advantage of neighboring characteristics and fully leveraging
latitude, timestamp, direction, speed, and status (vacant or occupied).
geographical information. Wl is the weight matrix for the lth layer. More
The sampling frequency of the GPS track is about 30 s.
details about the GCNN model can be found in Kipf’s work (Kipf &
The primary road network and POIs data of the study area were
Welling, 2016).
collected from the Beijing City Lab (https://www.beijingcitylab.com/),
which is an innovative research community that exploring urban dy
2.4. Evaluation indictors namics quantitively and offering new insights for urban planning and
governance for sustainable urban development in China. The lab also
We compared the cross-entropy loss and prediction accuracies of actively shared and released valuable urban geographical datasets,
different methods. The evaluation indictors are defined as follow: which have been widely used in many types of research (Long, 2016). In
this study, the road network data covers the main roads in the study area
2.4.1. Cross-entropy loss: (Fig. 5.b), including primary, secondary, and other driven roads.
Meanwhile, due to the complexity of urban functional structure and the
∑
M
loss = − yc log(pc ) (6) lack of urban land use ground truth, we employed the POIs data as
c=1 auxiliary data to obtain the social function of each road segment. Fig. 5.c
maps the kernel density distribution of POIs data. In these POI records,
where M is the number of social function class c (In this paper, M = 3,
in addition to the basic information (e.g., POI name, address,
i.e., commercial road, public road, and traffic road). y is the binary in
geographical coordinates, and district name), multilevel category in
dicator, y = 1 if road segment is correctly classified, otherwise y = 0. p is
formation, including top-level category, second-level category and
predicted probability calculated by Softmax function.
third-level category is also included. The top-level category allowed us
to infer urban functions. In this study, WGS84 geographic coordinate
2.4.2. Accuracy:
system was adopted.
1 ∑N
acc = yc (7)
N n=1
Where N is the size of the test set. Note that the prediction accuracy is
the major evaluation metric and the cross-entropy loss is only used as a
6
S. Hu et al. Computers, Environment and Urban Systems 87 (2021) 101619
Fig. 4. The proposed architecture of GCNN.
3.2. Geo-semantic embedding representation segment can be represented as a high-dimensional vector, which con
tains important traffic interaction information and can be easily used in
3.2.1. Parameters setting in Word2Vec the downstream neural network models.
In this study, we extracted the main traffic roads in the study area The parameter sensitivities of Word2Vec have been widely discussed
and divided them into 1514 road segments. By inputting the Road- in recent exploratory studies. Considering the computational cost of the
Trajectory corpus and training the Word2Vec model, each road Word2Vec model and the volume of the real taxi GPS trajectory data,
7
S. Hu et al.                                                                                                     Computers, Environment and Urban Systems 87 (2021) 101619

Fig. 5. Study area and data schema. (a) Study area – the central urban area of Beijing City. (b) The primary road network in the study area. (c) Kernel density
distribution of POIs data.

most of the parameters were set to recommended or default values.                       to 128 and the scanning window was 6. However, an uncertain
Inspired by existing exploratory studies (Liu et al., 2017; Yan, Janowicz,              parameter still existed, namely the number of iterations k, which may
Mai, & Gao, 2017), the vector dimension in the Word2Vec model was set                   have an impact on the final results. This uncertain parameter is usually

Fig. 6. Change of the testing accuracy of prediction assessment with increases in the number of iterations in Word2Vec. The box plot in each iteration dedicates the
distribution of test accuracy of 20 times running, while the blue dot line dedicates the change of the mean value of test accuracy. (For interpretation of the references
to colour in this figure legend, the reader is referred to the web version of this article.)

                                                                                    8
S. Hu et al. Computers, Environment and Urban Systems 87 (2021) 101619
determined by different geo-semantic tasks. In this study, a few trials dynamics of the number of taxi pick-ups or drop-offs (Liu et al., 2012;
were performed to determine the appropriate k value in the Word2Vec Pan, Qi, Wu, Zhang, & Li, 2013). For comparison purpose, we extracted
model, which was achieved by running the GCNN prediction task with similar features at the road segment level, i.e., the number of pick-ups
different numbers of iterations (ranging from 10 to 150 with intervals of per hour, the number of drop-offs per hour, and the difference be
10, each iteration running 20 times to ensure the stable accuracy) and tween these two numbers from the real taxi GPS trajectory data set.
evaluating the testing accuracy. As depicted in Fig. 6, the mean value of Then, we concatenated the above features and generated a 72-dimen
testing accuracy peaked at about 0.76 when the number of iterations sional Origin-Destination (OD) feature vector. All compared methods
was set as 20, 40, 100, and 120. However, the box plots show that the are listed as follow:
distribution of test accuracy was uneven, and outliers existed when k =
40 and k = 120. Therefore, we set the number of iterations to 20 and 100 a) semantic embedding features with k = 20 + GCNN model (SE20 +
respectively in the following analysis. GCNN);
b) semantic embedding features with k = 20 + MLP model (SE20 +
3.2.2. Correlation analysis MLP);
In order to verify the effectiveness of the geo-semantic embedding c) semantic embedding features with k = 100 + GCNN model (SE100 +
vector of a road segment, we selected a road segment of interest: the GCNN);
FuCheng Road in Xidan district to visually estimate its traffic interaction d) semantic embedding features with k = 100 + MLP model (SE100 +
and similarity among neighboring roads. We obtained the semantic MLP);
embedding vector of FuCheng Road and its neighboring road segments. e) pick-up and drop-off features + GCNN model (OD + GCNN);
Then, we calculated the cosine similarity metric between them and f) pick-up and drop-off features + MLP model (OD + MLP).
explored the traffic interaction in the road network. As depicted in
Fig. 7, the cosine similarity between FuCheng Road and its neighboring In the above methods, different feature vectors were fed into the
road segments in Xidan district were spatially heterogeneous. The GCNN model and MLP model, and the urban functions of each road
maximum cosine similarity was 0.69, occurring between FuCheng Road segment were predicted. Additionally, by setting the random seed, we
and its downstream road segment, i.e., Tiyuguan South Road – road randomly split the dataset into the training dataset, the validation
segment 1 in Fig. 7. However, the similarity value between FuCheng dataset, and the testing dataset with ratios of 60%, 20%, and 20%,
Road and its adjacent road segment, i.e., West 3rd Road—road segment respectively. The validation dataset was used to validate the model at
6 in Fig. 7—was only 0.029, meaning that there was less traffic inter each epoch while the training and the testing datasets were used to
action. Meanwhile, the similarity value between FuCheng Road and its evaluate the final overall accuracy. The learning rate was set to 0.01; the
bidirected road segment—road segment 3 in Fig. 7—was also small, only number of hidden units was set to 64; and other parameters were set to
0.036. We believe that this result is primarily related to the social the default values. The maximum number of training epochs was set to
function of a road segments and/or its spatial interaction with other 1000 to fit the GCNN model sufficiently. The dropout mechanism (Sri
road segments. For example, a typical taxi trip would not include vastava, Hinton, Krizhevsky, Sutskever, & Salakhutdinov, 2014) and
FuCheng Road as well as road segment 3 because that would require weight decay regularization were introduced to prevent overfitting in
making a U-turn at the end of one road segment and then going to the training process. To ensure a reliable and stable estimation of the pre
opposite direction, which does not happen very often with taxi trips. diction accuracy, each model was run 20 times with different random
However, as the topological distance between FuCheng Road and its seeds.
neighboring road segments increases, the similarity value between them
becomes smaller, resulting in a weaker traffic interaction. 3.4.2. Prediction performance
In this subsection, we discuss the performance of proposed GCNN
3.3. Spatial distribution of social functions model and comparative methods on the real taxi GPS trajectory data in
Beijing. Table 3 shows the comparative results for the performance. We
Considering the weight and proportion of POI categories along and found that (1) our proposed methods (identifier a and c in the Table 3),
near each road segment, the social function of road segments was with relative less loss and high accuracies, outperform other compara
divided into three types: commercial, public and traffic. Commercial POI tive methods (identifier b, d, e and f) for classifying urban functions on a
dominated streets were the largest proportion at 37.8%, while public very large volume of real-world taxi trajectories; (2) MLP-based methods
and traffic POI dominated streets account for 36.6% and 25.6%, (b, d and f) drop behind GCNN-based methods (a, c and e) as they ignore
respectively. As is shown in Fig. 8, commercial POI dominated streets contextual information in geographic contexts in an urban road
are located in several popular business centers and market districts, such network, so compared with GCNN-based methods, MLP-based methods
as Xidan, Wangfujing, and Shijiecheng commercial streets. Traffic POI may suffer from the issue that how to fully leverage geographical in
dominated streets typically comprise ring roads, carrying the function of fluence; (3) semantic embedding based methods (identifier a, b, c and d)
transportation, such as commuting between downtown and suburban obtain much better performance than pick-up and drop-off based
areas. Public POI streets mainly comprise public services streets, methods (e and f), indicating that modeling the underlying traffic
distributed in scenic areas, public services areas, and residential areas. interaction information extracted from taxi GPS trajectories is important
for classifying urban functions at the road segment level.
3.4. Validation of GCNN prediction model To summarize, with semantic embedding features, our proposed
GCNN model is able to learn and better leverage traffic interaction in
3.4.1. Comparative methods formation extracted from taxi GPS trajectories data and significantly
A MLP neural network model (Pal & Mitra, 1992) was introduced to improve the performance of social function prediction task along road
compare with the proposed GCNN prediction model. As one of the segments in urban areas.
commonly applied feed-forward neural networks, MLP has various
characteristics, such as fast operation, ease of implementation and 4. Discussion
smaller training set requirements. In addition, for a better understanding
of the effectiveness and strength of semantic embedding features, a 4.1. Semantic embedding features and model selection
vector consisting of pick-up and drop-off features was implemented for
comparison. Researchers have verified that the urban functions of a In this study, we constructed semantic embedding features to
certain urban area can be characterized by the temporal and spatial represent traffic interaction characteristics among road segments by
9S. Hu et al. Computers, Environment and Urban Systems 87 (2021) 101619
Fig. 7. Cosine similarity between FuCheng Road and neighboring road segments in Xidan district.
10S. Hu et al. Computers, Environment and Urban Systems 87 (2021) 101619
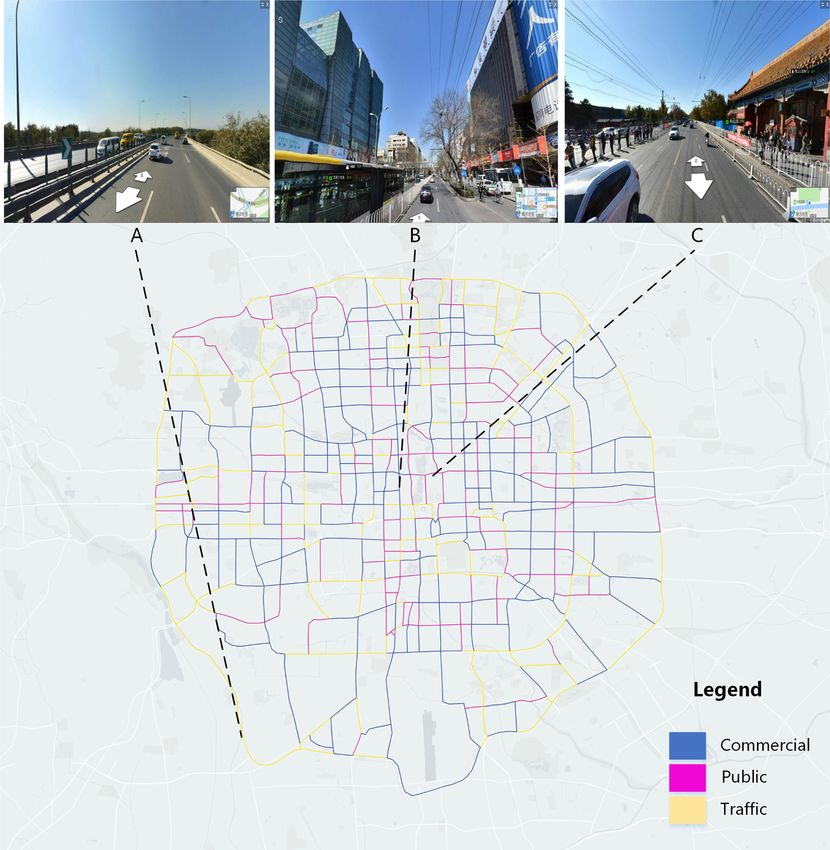
Fig. 8. The social function distribution of road segments. The three subfigures above the map are street view images of three interest road segments: A. South 5th
Road (Traffic); B. Xidan South Street (Commercial); C. Jingshan Street (Public).
Table 3
Test assessment of compared methods.
ID Method Loss Accuracy
Mean Max. Min. Std. Mean Max. Min. Std.
a) SE20 + GCNN 0.842 1.070 0.612 0.115 0.761 0.802 0.702 0.027
b) SE20 + MLP 1.116 1.609 0.953 0.197 0.528 0.571 0.452 0.036
c) SE100 + GCNN 0.786 0.988 0.664 0.084 0.759 0.802 0.710 0.026
d) SE100 + MLP 1.092 1.878 0.964 0.202 0.546 0.601 0.485 0.033
e) OD + GCNN 0.981 1.012 0.946 0.021 0.532 0.581 0.495 0.022
f) OD + MLP 1.032 1.069 0.993 0.017 0.491 0.436 0.538 0.029
Bolded score indicates relatively fit value in the corresponding column.
11S. Hu et al. Computers, Environment and Urban Systems 87 (2021) 101619
geo-semantic training in the Word2Vec model based on a Road- random forest (RF), each model was run 100 times using semantic
Trajectory corpus. Furthermore, urban function prediction results indi embedding features with k = 20 with different random seeds. Results are
cate that our proposed GCNN model outperformed traditional methods summarized in Table 4. Reported numbers denote the classification
in comparative trials. Compared with existing methods, the proposed accuracy on the test set. We found that our proposed method, overall,
method has the following advantages. First, without considering traffic outperforms other popular machine learning methods. The maximum
interaction correlations, the OD-based method merely leverages tem accuracy of our proposed method is a little bit lower than the other three
poral and spatial activity variations and frequencies to classify urban methods (KNN, SVM, and RF), but the mean accuracy and minimum
functions, which may miss the contextual and underlying spatial inter accuracy are better than the other methods, while our method has a
action information. Liu, Kang, Gong, and Liu (2016) have revealed that smaller standard deviation. This result indicates that our proposed
urban land use is intricately linked to traffic behaviors, and a lack of method has better stability and robustness using the same features for
information on spatial interaction creates a barrier for the improvement geographic knowledge discovery.
of classification accuracy in urban functional studies. Our study reso
nates with Liu’s work and shows that semantically embedding features 4.3. Contributions and limitations
considering traffic interaction patterns can significantly improve the
performance of modeling urban function prediction. The contributions of this study can be summarized as following three
Second, how to learn effective data representation automatically aspects:
becomes a key issue in machine learning and geo-semantic studies
(Bengio et al., 2013). Early representation approaches, such as features • Taxi GPS trajectory data have been widely employed in the related
extraction and features selection, both incorporate certain subjective studies of investigating urban functional structure. Extracting pick-
learning assumptions and easily ignore potential information. Geo- up and drop-off positions and then measuring the proportions in
semantic embedding features take advantage of potential information side each region is a commonly used method to characterize urban
learning and inner spatial interaction, integrating a GCNN model that functional regions. However, intermediate GPS records of each tra
considers the influence of topological adjacency of road segments, jectory also contain valuable information, such as the movement
thereby reducing manual intervention. flows and traffic states, which have not been thoroughly explored. To
Third, although geo-embedding techniques, such as topic modeling address this issue, an analogizing strategy was presented and the
and Word2Vec, have been investigated in urban road networks to Word2Vec model in NLP was employed to learned a geo-semantic
certain degree, the advances for geo-embedding representation remains embedding representation of road segment. Via geo-semantic
a key challenge, especially when integrating advanced deep learning embedding features, not only can we characterize urban traffic ele
methods with large geo-enriched movement data. Liu et al. (2017) ments using representation learning, we can quantitatively investi
presented a Road2Vec model to reveal traffic interaction pattern using gate and measure the traffic interaction between road segments by
vehicle travel routes. They used artificial neural network and support correlation analysis;
vector machine model to a short-term traffic forecasting task. The results • Vehicles moving within a city are naturally constrained by urban
showed that geo-embedding features can reveal implicit traffic rela roads. As a typical graph structure in complex network study, urban
tionship among roads and have a good performance in traffic fore road networks have been widely explored in urban studies and
casting. However, how to effectively leverage non-linear traffic planning. Road segments have geographical and topological associ
interaction information hidden in geo-semantic embedding still needs ation with other road segments, especially its neighbors. Road
further research. In this study, a semi-supervised GCNN model was segment based classifying task is dependent on both the character
introduced to integrate with geo-semantic embedding features of road istics of that road segment, and the characteristics of road segments
segments. Enabled by the unique advantages of graph convolutional to which it is connected. Therefore, a GCNN model was introduced to
neural networks in dealing with an unstructured road graph, the po classify the social functions of road segments and improve the clas
tential of geo-semantic embedding features can be further explored. Our sification accuracy;
experimental results also revealed that the GCNN model with semantic • Finally, this work makes a contribution by enhancing the under
embedding features obtains less information loss and higher prediction standing of the urban functional classification at the road segment
accuracies, and outperform comparative MLP-based methods. level in a large-scale urban environment in an automatic and effi
In addition, GCNN was selected as the machine learning model to cient way by using GCNN and taxi GPS trajectory data. This method
classify urban functions with regard to the characteristics of traffic can be done reproducibly and applicable with readily available tra
spatial interactions among road segments. Geo-embedding representa jectory data, OSM road network data and POIs data in many other
tion has been shown to be an effective property that can describe the urban areas.
uniqueness and similarity of a road segment. However, roads are con
nected but are not isolated in urban road networks. GCNN adopt an The limitations of this study should also be noted and paid more
aggregation strategy in which each road segment aggregates its topo attention to in future research. First, the social function of each road
logically neighbors’ embedding characteristics to learn the contextual segment was identified, and these were divided into only three types. A
and geographical information. Therefore, it is ideal for modeling urban real-world urban area, however, is characterized by more complex and
road networks. Our results also showed that the GCNN-based method
can perform better than other comparative methods. Table 4
Summary of results with compared machine learning methods.
4.2. Comparisons with popular machine learning methods
Method Mean Max. Min. Std.
Moreover, comparisons with popular machine learning methods LR 0.561 0.573 0.551 0.007
KNN 0.543 0.821 0.435 0.116
(Jordan & Mitchell, 2015) have also been employed to validate the SVM 0.682 0.834 0.338 0.164
performance of our proposed GCNN model. To ensure a reliable and RF 0.671 0.834 0.327 0.164
stable estimation, a powerful toolkit for hyper parameter optimization GCNN 0.759 0.802 0.710 0.026
and model compression- NNI (Neural Network Intelligence)-was utilized (Our Proposed)
to obtain the best parameters (https://github.com/microsoft/nni). For Note: LR-Linear Regression Classification, KNN-K Nearest Neighbor Classifica
comparative machine learning methods including linear regression (LR), tion, SVM-Support Vector Machine Classification, RF-Random Forest
k-nearest-neighbors (KNN), support vector machines (SVM), and Classification.
12S. Hu et al. Computers, Environment and Urban Systems 87 (2021) 101619
diverse urban functional structures and elevated mixed social functions. Defferrard, M., Bresson, X., & Vandergheynst, P. (2017). Convolutional neural networks
on graphs with fast localized spectral filtering. ArXiv Preprint ArXiv, 1606, 09375. htt
The next work on this issue is to integrate the mixture natures of urban
p://arxiv.org/abs/1606.09375.
land uses and POI data to reflect the diversity and mixture of social Gao, S., Janowicz, K., & Couclelis, H. (2017). Extracting urban functional regions from
functions. Second, future research is anticipated to use more features in points of interest and human activities on location-based social networks.
the GCNN-based prediction, such as physical characteristics from Transactions in GIS, 21(3), 446–467. https://doi.org/10.1111/tgis.12289.
Glorot, X., Bordes, A., & Bengio, Y. (2011). Deep sparse rectifier neural networks. In
remote sensing and street view data. Third, it needs to be further G. Gordon, D. Dunson, & M. DudÃk (Eds.), Vol. 15. Proceedings of the Fourteenth
explored that whether we should consider longer distance range of in International Conference on Artificial Intelligence and Statistics (pp. 315–323). JMLR
teractions rather than the directly connected neighbors when using workshop and conference proceedings. http://proceedings.mlr.press/v15/glorot11a.
html.
graph-based deep learning models to study urban functions. Goldberg, Y., & Levy, O. (2014). word2vec Explained: Deriving Mikolov et al.’s negative-
sampling word-embedding method. ArXiv Preprint ArXiv:1402.3722.
5. Conclusion Gonzalez, M. C., Hidalgo, C. A., & Barabasi, A.-L. (2008). Understanding individual
human mobility patterns. Nature, 453(7196), 779–782.
Hu, S., He, Z., Wu, L., Yin, L., Xu, Y., & Cui, H. (2020). A framework for extracting urban
In this study, we proposed a novel framework for sensing the rela functional regions based on multiprototype word embeddings using points-of-
tionship between traffic interaction patterns and urban functions from a interest data. Computers, Environment and Urban Systems, 80, 101442. https://doi.
org/10.1016/j.compenvurbsys.2019.101442.
road segment perspective. Considering traffic interaction information, Huang, W., Li, S., Liu, X., & Ban, Y. (2015). Predicting human mobility with activity
geo-semantic embedding features can be learned from the proposed changes. International Journal of Geographical Information Science, 29(9), 1569–1587.
Road-Trajectory corpus by training the Skip-gram Word2Vec model. https://doi.org/10.1080/13658816.2015.1033421.
Jiang, B. (2009). Street hierarchies: A minority of streets account for a majority of traffic
Moreover, the social function of each road segment can be identified by
flow. International Journal of Geographical Information Science, 23(8), 1033–1048.
integrating the auxiliary data of POIs and the TF-IDF weighting method. Jordan, M. I., & Mitchell, T. M. (2015). Machine learning: Trends, perspectives, and
Finally, because road segments are topologically connected, we intro prospects. Science, 349(6245), 255–260.
duced a GCNN to classify the urban functions of road segments. This Katukuri, J. R., Raghavan, V. V., & Xie, Y. (2013). Semantic relationship extraction, text
categorization and hypothesis generation (Google Patents).
work was implemented using extensive taxi GPS trajectory data in Bei Kipf, T. N., & Welling, M. (2016). Semi-supervised classification with graph
jing. The result shows that our proposed GCNN model with geo-semantic convolutional networks. ArXiv Preprint ArXiv, 1609, Article 02907.
embedding features outperform other comparative methods. We sub Kwan, M.-P. (2007). Mobile communications, social networks, and urban travel:
Hypertext as a new metaphor for conceptualizing spatial interaction. The Professional
sequently discussed the advantages of geo-semantic embedding repre Geographer, 59(4), 434–446. https://doi.org/10.1111/j.1467-9272.2007.00633.x.
sentation and the potential improvement of the proposed framework. Li, J., Zhang, Y., Wang, X., Qin, Q., Wei, Z., & Li, J. (2016). Application of GPS trajectory
The framework and methods proposed in this study can be applied to data for investigating the interaction between human activity and landscape pattern:
A case study of the Lijiang River basin, China. ISPRS International Journal of Geo-
other urban areas as well, which can be done reproducibly with readily Information, 5(7), 104.
available datasets. This study contributes to urban study and GIScience Li, Y., Fei, T., & Zhang, F. (2019). A regionalization method for clustering and
literature by building a Road-Trajectory corpus using vehicle GPS tra partitioning based on trajectories from NLP perspective. International Journal of
Geographical Information Science, 33(12), 2385–2405. https://doi.org/10.1080/
jectory data and investigating social functions based on geo-semantic 13658816.2019.1643025.
embedding features from a road segment perspective using deep Liu, K., Gao, S., & Lu, F. (2019). Identifying spatial interaction patterns of vehicle
learning techniques. movements on urban road networks by topic modelling. Computers, Environment and
Urban Systems, 74, 50–61. https://doi.org/10.1016/j.compenvurbsys.2018.12.001.
Liu, K., Gao, S., Qiu, P., Liu, X., Yan, B., Lu, F., … Lu, F. (2017). Road2Vec: Measuring
Conflict of interest statement traffic interactions in urban road system from massive travel routes. ISPRS
International Journal of Geo-Information, 6(11), 321. https://doi.org/10.3390/
No potential conflict of interest was reported by the authors. ijgi6110321.
Liu, K., Qiu, P., Gao, S., Lu, F., Jiang, J., & Yin, L. (2020). Investigating urban metro
stations as cognitive places in cities using points of interest. Cities, 97, 102561.
Acknowledgments https://doi.org/10.1016/j.cities.2019.102561.
Liu, X., Kang, C., Gong, L., & Liu, Y. (2016). Incorporating spatial interaction patterns in
classifying and understanding urban land use. International Journal of Geographical
This study was supported by the National Natural Science Founda Information Science, 30(2), 334–350. https://doi.org/10.1080/
tion of China [grant number 41871311], the National key R & D pro 13658816.2015.1086923.
gram of China [No. 2017YFB0503600] and the Fundamental Research Liu, X., Pelechrinis, K., & Labrinidis, A. (2019). hood2vec: Identifying similar urban areas
using mobility networks. ArXiv Preprint ArXiv, 1907, 11951. http://arxiv.org/abs/1
Funds for National Universities, China University of Geosciences 907.11951.
(Wuhan). Liu, Y., Liu, X., Gao, S., Gong, L., Kang, C., Zhi, Y., … Shi, L. (2015). Social sensing: A new
approach to understanding our socioeconomic environments. Annals of the
Association of American Geographers, 105(3), 512–530. https://doi.org/10.1080/
References 00045608.2015.1018773.
Liu, Y., Wang, F., Xiao, Y., & Gao, S. (2012). Urban land uses and traffic ‘source-sink
Barbosa, H., Barthelemy, M., Ghoshal, G., James, C. R., Lenormand, M., Louail, T., … areas’: Evidence from GPS-enabled taxi data in Shanghai. Landscape and Urban
Tomasini, M. (2018). Human mobility: Models and applications. Physics Reports, 734, Planning, 106(1), 73–87. https://doi.org/10.1016/j.landurbplan.2012.02.012.
1–74. https://doi.org/10.1016/j.physrep.2018.01.001. Long, Y. (2016). Redefining Chinese city system with emerging new data. Applied
Bengio, Y., Courville, A., & Vincent, P. (2013). Representation learning: A review and Geography, 75, 36–48. https://doi.org/10.1016/j.apgeog.2016.08.002.
new perspectives. IEEE Transactions on Pattern Analysis and Machine Intelligence, 35 Martí, P., Serrano-Estrada, L., & Nolasco-Cirugeda, A. (2019). Social media data:
(8), 1798–1828. https://doi.org/10.1109/TPAMI.2013.50. Challenges, opportunities and limitations in urban studies. Computers, Environment
Bengio, Y., Ducharme, R., Vincent, P., & Jauvin, C. (2003). A neural probabilistic and Urban Systems, 74, 161–174. https://doi.org/10.1016/j.
language model. Journal of Machine Learning Research, 3(Feb), 1137–1155. compenvurbsys.2018.11.001.
Bruna, J., Zaremba, W., Szlam, A., & LeCun, Y. (2013). Spectral networks and locally Mikolov, T., Chen, K., Corrado, G., & Dean, J. (2013). Efficient estimation of word
connected networks on graphs. ArXiv Preprint ArXiv, 1312, 6203. representations in vector space. ArXiv Preprint ArXiv, 1301, 3781.
Castro, P. S., Zhang, D., Chen, C., Li, S., & Pan, G. (2013). From taxi GPS traces to social Pal, S. K., & Mitra, S. (1992). Multilayer perceptron, fuzzy sets, and classification. IEEE
and community dynamics: A survey. ACM Computing Surveys (CSUR), 46(2), 1–34. Transactions on Neural Networks, 3(5), 683–697.
Chen, S., Tao, H., Li, X., & Zhuo, L. (2016). Discovering urban functional regions using Pan, G., Qi, G., Wu, Z., Zhang, D., & Li, S. (2013). Land-use classification using taxi GPS
latent semantic information: Spatiotemporal data mining of floating cars GPS data of traces. IEEE Transactions on Intelligent Transportation Systems, 14(1), 113–123.
Guangzhou. Journal of Geographical Sciences, 71, 471–483. https://doi.org/10.1109/TITS.2012.2209201.
Cheng, T., Haworth, J., & Wang, J. (2012). Spatio-temporal autocorrelation of road Pei, T., Sobolevsky, S., Ratti, C., Shaw, S.-L., Li, T., & Zhou, C. (2014). A new insight into
network data. Journal of Geographical Systems, 14(4), 389–413. https://doi.org/ land use classification based on aggregated mobile phone data. International Journal
10.1007/s10109-011-0149-5. of Geographical Information Science, 28(9), 1988–2007. https://doi.org/10.1080/
Chu, D., Sheets, D. A., Zhao, Y., Wu, Y., Yang, J., Zheng, M., & Chen, G. (2014). 13658816.2014.913794.
Visualizing hidden themes of taxi movement with semantic transformation. IEEE Porta, S., Crucitti, P., & Latora, V. (2006). The network analysis of urban streets: A dual
Pacific Visualization Symposium, 2014, 137–144. https://doi.org/10.1109/ approach. Physica A: Statistical Mechanics and its Applications, 369(2), 853–866.
PacificVis.2014.50. https://doi.org/10.1016/j.physa.2005.12.063.
13You can also read