Chemistry Matters Lab Manual - Oak Meadow, Inc.
←
→
Page content transcription
If your browser does not render page correctly, please read the page content below
Chemistry
 Matters
 Lab Manual

  Oak Meadow, Inc.
    Post Office Box 615
  Putney, Vermont 05346
     oakmeadow.com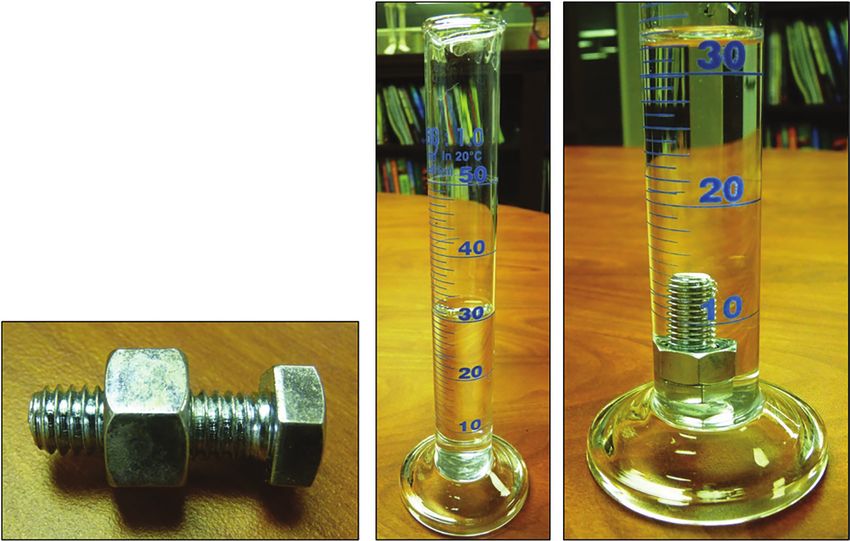
Introduction
Chemistry is the study of matter, and the best way to learn chemistry is through active explorations.
The activities and experiments included in this lab manual are a required part of Oak Meadow’s
Chemistry Matters high school course. They can also be used as a supplement to any chemistry course.
A complete materials list for the lab manual activities is found in the appendix. In addition, you will
need a box of disposable nitrile gloves to use during all inquiry and laboratory experiments.
Some of the activities in this lab manual use the textbook Living by Chemistry (W. H. Freeman, 2018).
Except for those in lesson 18, all the experiments are from Hands-On Labs (HOL) and use the materials
in the following lab kits:
       HOL Chem 1 Kit (HOL SP-3005-CK-02)
       HOL Chem 2 Kit (HOL SP-3006-CK-02)
Below is a breakdown of the labs in each kit and the corresponding lesson. Some labs are optional, as
noted in the table of contents.

Chem 1 Kit (HOL SP-3005-CK-02)

 Lab Name                                                   Corresponding
                                                            Lesson
Laboratory Techniques and Measurements                           1 and 15
Molecular Modeling and Lewis Structures                              7
Naming Chemical Compounds                                          13
pH of Common Materials                                             16
Properties of Gases                                                 11
Stoichiometry of a Precipitation Reaction                          17
The Mole Concept: Chemical Formula of a Hydrate                    14
Titration for Acetic Acid in Vinegar                               16

Oak Meadow                                                                                                vii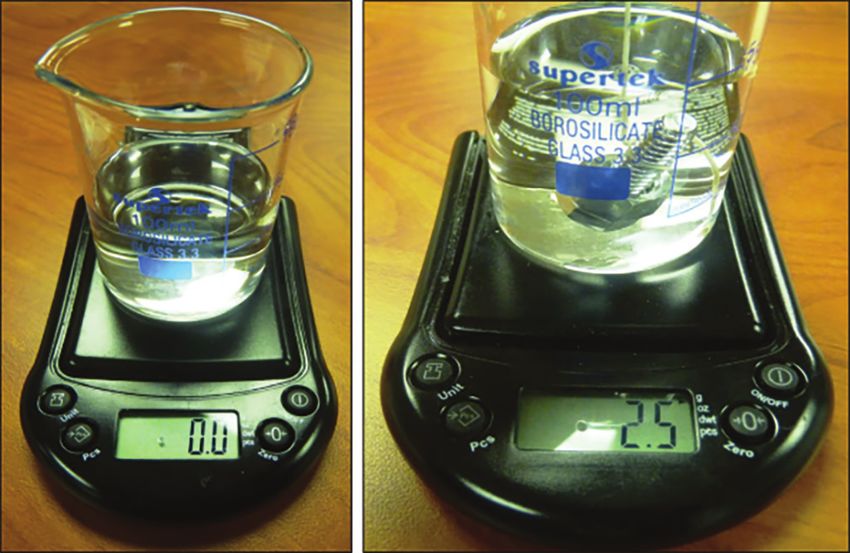
Introduction                                                                Chemistry Matters Lab Manual

Chem 2 Kit (HOL SP-3006-CK-02)

 Lab Name                                                   Corresponding
                                                            Lesson
 Antacid Analysis and Titration                             16
 Caloric Content of Food                                    19
 Colligative Properties and Molar Mass Determination        14
 Electrochemical Cells and Cell Potentials                  21
 Le Chatelier’s Principle                                   24
 Quantitative Spectroscope and Visible Light                22
 Reaction Order and Rate Laws                               20
 Using Buffers                                              23

Note: Working with chemicals can be dangerous. Please carefully follow all necessary safety protocols.

Review of Laboratory Safety
Throughout the course, you will conduct home experiments that involve the use of potentially harmful
chemicals. These labs are designed to give you a hands-on learning experience, but they need to be
done in a safe manner. As such, it is important that we begin this course with a review of safe labora-
tory techniques.
  1. Wear closed-toe shoes when working with chemicals.
  2. Keep all nonessential lab items (such as bags, papers, food, cosmetics, lotions, etc.) out of the
     work space.
  3. Never eat, drink, or chew gum when working on labs.
  4. Before every lab, read all the directions carefully. Make sure you understand the overall goal of
     the lab.
  5. Check that all equipment and supplies are clean and in working order before beginning.
  6. Gather all the equipment needed for the lab. Keep all other lab materials packaged and out of
     the work space.
  7. Always wear safety glasses and gloves. (The glasses are provided in your lab kit.)
  8. Tie back long hair and loose clothing to keep them away from chemicals and flames.
  9. Remove dangling jewelry.
10. Never touch, taste, or smell any chemical. To note odor, gently wave your hand over the opening
    of the container to direct the fumes toward your nose and smell carefully (wafting).

viii                                                                                        Oak Meadow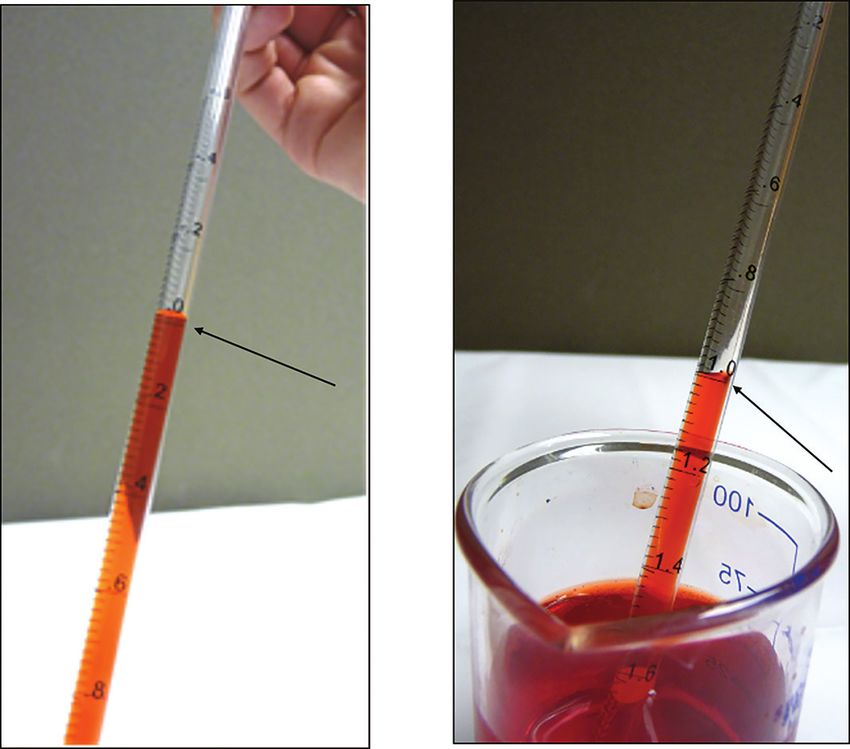
Chemistry Matters Lab Manual                                                                 Introduction

 11. Never conduct your own experiments. Follow the directions provided, and use materials only as
     intended.
12. Hot glassware does not appear hot. Carefully check before touching.
13. Dispose of any unused or spilled chemicals by soaking them up with a paper towel and placing it
    in a trash can. Never dispose of chemicals down the sink or toilet.
14. Clean up your work space and all equipment after each experiment. Dispose of materials as
    noted above, or place them back in your lab kit for future use. Since you are conducting these
    experiments at home (and possibly in your kitchen), it is critically important that you clean up
    your work space before anyone else uses the area or food is prepared.
15. Wash your hands thoroughly after each experiment!
If at any point during this course you have questions about the laboratory directions or need assis-
tance, stop working and contact your teacher immediately.

Oak Meadow                                                                                             ix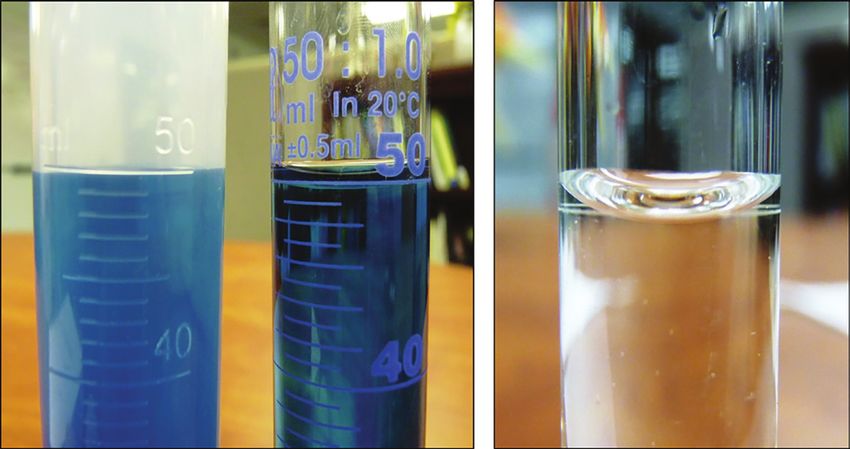
Lesson                        Introduction to

      1                       Chemistry and
                              Matter
Activities
Complete Activity A. Activity B is optional and can be done for extra credit.
  •   Activity A: Measuring and Graphing
  •   Activity B: Understanding Material Safety Data Sheets

Activity A: Measuring and Graphing
The purpose of this activity is to review and reinforce basic mathematical skills relevant to chemistry:
making accurate measurements, using scientific notation, and using graphs for making inferences
about a data set.
When performing calculations, always show your work. This applies for every activity and experiment
throughout this course.

Materials
  •   scale (included in the HOL lab kit)
  •   scientific calculator
  •   graph paper (included in the appendix)
  •   ruler
  •   pencil
  •   cardboard or stock paper
  •   scissors

Before You Begin
  1. Write one paragraph explaining the following. Properly cite any references you use.
        •     Describe how to create a meaningful line graph. What titles, labels, and notations would you
              include?
        •     What is the general equation for a line? Define all variables.

Oak Meadow                                                                                                 1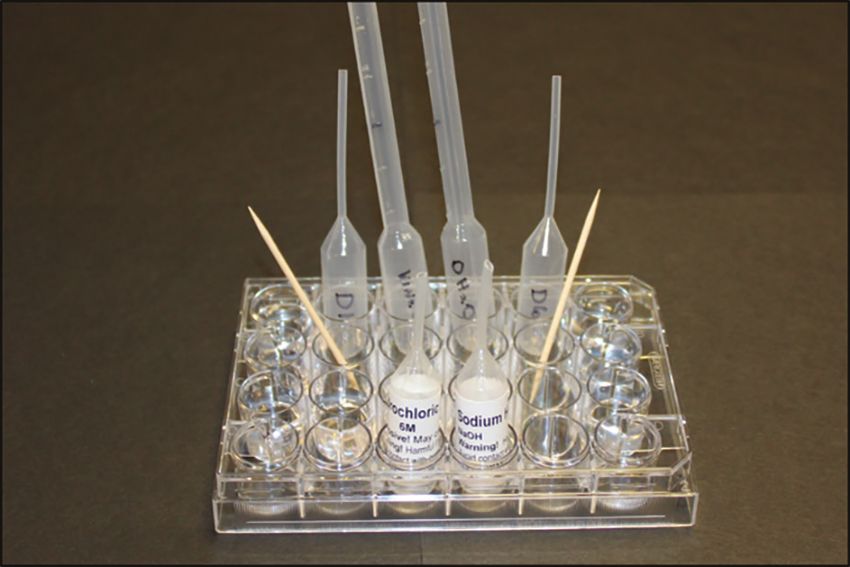
Lesson 1: Introduction to Chemistry and Matter                                Chemistry Matters Lab Manual

         •   What is the equation for determining the slope of a line?
         •   Optional extra credit: Define and explain interpolation and extrapolation as it relates to the
             slope of a line.

Procedure, Part One: Data Collection
    1. Using cardboard or thick paper, cut out four squares. Each square must be a different size. Label
       the squares A, B, C, and D.
    2. Using the same cardboard or thick paper, cut out one irregular shape (such as a star, heart,
       squiggle, etc.). Label this shape E.
    3. Measure the length and width of the cardboard squares (A, B, C, and D) to the nearest 0.1 cm. Do
       not attempt to measure the length and width of the irregular shape.
    4. Convert each measurement to scientific notation (SN).
    5. Calculate the area of each square using regular notation (RN) and scientific notation. Try to recall
       the formula for finding the area of a square. Look it up if you can’t remember.
    6. Using the electronic balance (scale), determine the mass of each square and the irregular shape E
       to the nearest 0.01 grams.

Data Table: Measurement of Shapes

     Shape        Length       Length         Width        Width        Area         Area          Mass
                 (RN) (cm)    (SN) (cm)     (RN) (cm)    (SN) (cm)    (RN) (cm2)   (SN) (cm2)       (g)

A

B

C

D

E

2                                                                                               Oak Meadow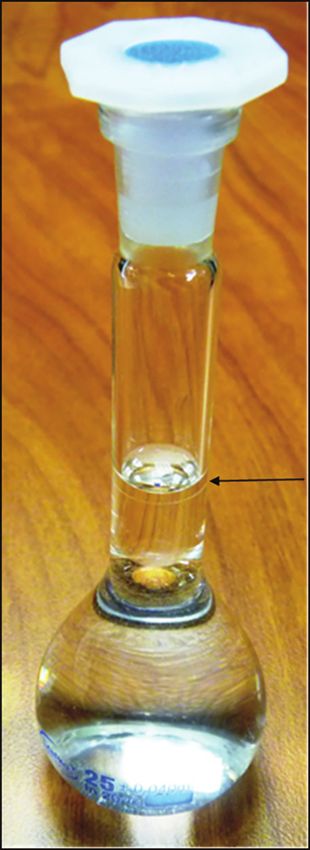
Chemistry Matters Lab Manual                                Lesson 1: Introduction to Chemistry and Matter

Procedure, Part Two: Graphing Data to Produce a Line of Best Fit
Create your graph, either by hand using graph paper or digitally using Excel, Google Sheets, or another
online graphing tool.
  1. Graph the relationship between mass (g) and area (cm2) for squares A, B, C, and D.
 2. Place mass on the y-axis and area on the x-axis. Remember to include the appropriate units when
    labeling your axes. Be sure to give your graph a descriptive title.
 3. Draw a line of best fit. Your line of best fit must, by definition, come as close to as many points as
    possible and originate at the coordinate (0,0).

                                 Graphing the Line of Best Fit
             Need help with the line of best fit? Check out these videos:
                     “Line of Best Fit Equation”
                     www.youtube.com/watch?v=DmGLQkUm-4g
                     “Excel Basics—Linear Regression—Finding Slope & Y Intercept”
                     www.youtube.com/watch?v=KwQsV77bYDY
                     “Linear Regression T184 (Line of Best Fit)”
                     www.youtube.com/watch?v=0as2Jh_eDwg
             Note: The last video shows how to use a graphing calculator. A graphing cal-
             culator is not required for this course, but you may have one from your previ-
             ous math courses and already be familiar with using it. The last video is
             included for those students who prefer working by hand and like using a
             graphing calculator to support their results.

Analysis
  1. Using your graph, calculate the slope of your line of best fit. Show your work.

Oak Meadow                                                                                               3
Lesson 1: Introduction to Chemistry and Matter                               Chemistry Matters Lab Manual

    2. Using the constructed graph, determine the area of the irregular shape E. Include the correct
       units in your answer.
       a. Area of shape E =
       b. Was this task completed through interpolation or extrapolation? Explain.

    3. How was this graph useful when obtaining information? Was it more accurate than trying to
       make direct measurements? Explain.

Activity B: Understanding Material Safety Data Sheets
(This activity is optional and can be done for extra credit.)
Material Safety Data Sheets (MSDS) are required by OSHA (Occupational Safety and Health
Administration) to be maintained by any facility storing or using chemicals of any nature or quantity.
Chances are you will, at some point, work at a facility that stores hazardous materials. You should
know how to find information on chemicals and understand an MSDS.
Review OSHA’s MSDS requirements. They have standardized the information that must be available on
MSDSs and made that information publicly available here:
          “Hazard Communication Standard: Safety Data Sheets”
          www.osha.gov/Publications/OSHA3514.html
Next, review the MSDS linked below for the concentrated version of vinegar, a common household
item, and use this to answer the following questions.
          “Flinn Scientific Safety Data Sheet (SDS): Acetic Acid Solution 4.3 M–6 M”
          www.flinnsci.com/sds_5.2-acetic-acid-solution-4.3-m---6-m/sds_5.2/
    1. What does MSDS stand for?
    2. What is the name of your chemical?
    3. What is its formula?
    4. Identify three important types of information found on an MSDS and provide that information
       for this compound.

4                                                                                           Oak Meadow
Chemistry Matters Lab Manual                              Lesson 1: Introduction to Chemistry and Matter

Experiments
Complete the following lab experiment.

Laboratory Techniques and Measurements
The materials for this experiment are found in the HOL Chem 1 Kit.
Note: You will be completing Exercise 1: Length, Temperature, and Mass and Exercise 2: Volume and
Density in this lesson. Exercise 3: Concentration, Solution, and Dilution will be covered in lesson 15.
Include photos of your lab setup and results. Complete all the required lab questions. You will generate
data tables to be included with your lab.

Oak Meadow                                                                                            5

Experiment

Laboratory Techniques
and Measurements
Learning Objectives
 • Perform measurements with a graduated cylinder, volumetric flask, graduated pipet, ruler,
      digital scale, and thermometer.
  •   Perform the water displacement method for measuring the volume of an irregularly shaped
      object.
  •   Calculate experimental error.
  •   Practice basic math and graphing skills.

Exploration
Explore International System of Units (SI)
Chemistry is the science of matter and its changes. In order to study matter and its changes, scientists
make qualitative and quantitative observations. Quantitative observations, or measurements, always
consist of a numerical value and a unit of measurement. Scientists use the International System of
Units (SI), which is derived from the metric system, as the standard system of measurement. Table 1
shows the basic SI units to measure the five fundamental properties of length, mass, time, tempera-
ture, and amount of substance. The sixth property shown, volume, is considered a derived unit, as it is
the cubic (3D) version of length. As shown in Table 1, the SI system and the metric system are closely
related, differing only in the size of the fundamental unit. Table 1 also includes the units more likely to
be used in the laboratory, where very small quantities are used.

                         www.HOLscience.com            7        © Hands-On Labs, Inc.
Experiment Laboratory Techniques and Measurements
Measurement International System Metric System Common Laboratory
(SI) Units
Length meter (m) meter (m) centimeter (cm)
Mass kilogram (kg) gram (g) gram (g)
Time second (s) second (s) second (s)
Temperature Kelvin (K) Celsius (°C) Celsius (°C)
Amount of Substance mole (mol) mole (mol) mmole (mmol)
Volume cubic meter (m ) 3
liter (L) milliliter (mL)
Table 1. Comparison of units used to measure fundamental properties
US customary units require conversion to metric/SI units for scientific reporting. Table 2 illustrates the
relationships (conversion factors) between US customary units and metric/SI units.
Property Factor Factor
Length 1 in = 2.54 cm 1 mi = 1.609 km
Mass 1 lb = 454 g 1 kg = 2.206 lb
Volume 1 qt = 0.946 L 1 L = 1.06 qt
Temperature °F = (°C × 1.8) + 32 K = °C + 273.15
Table 2. Metric-US conversions
Table 3 lists the meanings of the prefixes used in the metric and SI systems. Each prefix is a multiplica-
tion factor for the base unit. For example, the prefix kilo means 1,000, so 1 kilogram is equivalent to
1,000 grams.
Prefix Symbol Meaning Exponential Notation
mega M 1,000,000 106
kilo k 1,000 103
hecto h 100 102
deka da 10 101
deci d 0.1 10–1
centi c 0.01 10–2
mili m 0.001 10–3
micro µ 0.000001 10–6
Table 3. Prefixes used in the SI and metric systems
www.HOLscience.com 8 © Hands-On Labs, Inc.Experiment Laboratory Techniques and Measurements
Explore Length
Length is defined as the distance (amount of space) of an object from end to end. The SI system unit of
length is the meter (m) and was originally intended to represent one ten-millionth of the distance
between the North Pole and the Equator. However, over time the definition of the meter changed. The
current definition, which has been in place since 1983, is that a meter equals the distance that light
1
travels in a vacuum in 299,792,458 seconds. There are many tools to measure length, including a caliper,
a calibrated ruler, a tape measure, and even a laser. See Figure 1. Each of these different measuring
devices measures length to a different degree of accuracy and precision.
Figure 1. Common equipment used to measure length. A. Vernier caliper B. Tape measure C. Calibrated ruler.
(Image A copyright Paul Paladin, 2013. Image B copyright Jiri Hera, 2013. Image C copyright
Quang Ho, 2013. All images used under license from Shutterstock.com.)
Did You Know . . . ?
A ruler is a tool used to measure length. However, a ruler (rule) is actually
defined as an instrument used to rule (create) straight lines. A calibrated
ruler is a ruler that contains measurements to measure length along a
straight line.
Explore Temperature and Time
Temperature is defined as a measure of the average kinetic energy of a system. The SI system unit of
1
temperature is the kelvin (K), and the standard value (0 K) is defined as 273.16 of the temperature when
water exists as a solid, liquid, and gas at 1 atmosphere of pressure. This point in which water co-exists
as a solid, a liquid, and a gas is called the triple point. While the SI unit for temperature is the kelvin,
the majority of thermometers are calibrated to degrees Celsius (°C or C) and/or degrees Fahrenheit
www.HOLscience.com 9 © Hands-On Labs, Inc.Experiment Laboratory Techniques and Measurements
(°F or F). Today, scientific measurements are
commonly taken in the Celsius scale.
Converting between Fahrenheit, Celsius, and
Kelvin scales is common and can be performed
with one of the following conversion formulas:
TK = TC + 273.15
TF = (1.8)TC + 32
TF – 32
TC = 1.8
A comparison of common temperatures
between the three different scales (K, °C, °F) is
shown in Figure 2.
The second (s) is the basic SI unit of time and is
defined as the duration of 9,192,631,770 cycles
of radiation in an energy level change of the
cesium atom. While smaller quantities of time
than the second are described using the stan-
dard SI prefixes (Table 1), quantities of time Figure 2. Comparison of common temperatures
on the three different scales
larger than a second (minute, hour, day, week)
are not SI units. Time is measured using
watches (clocks), which are calibrated to atomic clocks. Atomic clocks are extremely precise clocks that
are regulated by the vibrations (resonance frequencies) of cesium atoms.
Explore Volume
Volume is defined as the amount of space occupied by a
three-dimensional object or area of space. The SI unit for vol-
ume is the cubic meter (m3), which is equal to the volume of a
cube measuring 1 meter on each side (1 m × 1 m × 1 m). See
Figure 3. The units for volume most commonly used in science
laboratories include the liter (L) and the milliliter (mL). A liter is
equal to the volume of a cube, with sides of 0.1 m (0.1 m × 0.1 m
1
× 0.1 m = 0.001 m3 = 1 L). A milliliter is 1,000 of a liter, and it is
also equal to a cubic centimeter (1 mL = 1 cm3). Figure 3. Volume of a cube. A cube that is
1 meter in length on all sides has a
1 L = 1,000 mL = 1,000 cm3 volume of 1 m3 or 1,000 L.
In addition to the milliliter, the microliter (μL), which is one
millionth of a liter, is also a common unit of volume used by scientists. When measuring the volume of
a liquid, common laboratory equipment options include a graduated cylinder, volumetric flask, and
graduated pipet.
www.HOLscience.com 10 © Hands-On Labs, Inc.Experiment Laboratory Techniques and Measurements
Explore Graduated Cylinder, Meniscus,
Volumetric Flask, and Graduated
Pipet
A graduated cylinder is a slender container that is
calibrated by specific volumetric amounts, such
as milliliters or liters, and can measure a range of
volumes depending on its capacity. See Figure 4.
When reading a graduated cylinder made of
glass, or any measuring device for volume that is
made of glass, it is important to read the volume,
at eye level, from the bottom of the meniscus. A
meniscus is the curve that forms between the liq-
uid and the surface of the container as the result
of surface tension, cohesion, and adhesion. See
Figure 5.
While graduated cylinders are designed to mea-
sure a variety of volumes, a volumetric flask is
calibrated to measure only one volume, and is
often used to prepare a specific volume of solu- Figure 6. Volumetric flask,
25 mL. The line on the
tion. A volumetric flask has a bulb-shaped bot-
Figure 4. Graduated flask, as noted by the
cylinder. A 50-mL tom and a very long slender neck. Each flask is black arrow, marks 25 mL
graduated cylinder calibrated with a mark on that slender neck, calibrated measurement.
made of glass. Note the allowing for very careful and accurate measure-
markings along the ments. See Figure 6.
cylinder, which
represent milliliters.
Figure 5. Meniscuses. A. Colored water in a graduated cylinder
made of plastic (left). Note that the liquid forms a straight, non-
curved, line at the 50 mL mark. Colored water in a graduated
cylinder made of glass (right). Note that the liquid forms a curved
line. B. When reading the volume from a meniscus, the volume is
read from the bottom of the curve.
www.HOLscience.com 11 © Hands-On Labs, Inc.Experiment Laboratory Techniques and Measurements
For smaller volumes, scientists use graduated pipets (also referred to as serological pipets) to measure
liquids. Just as for graduated cylinders, graduated pipets can be used to measure a range of volumes
depending on the capacity of the pipet. Similar to volumetric flasks, the calibrated measurement area
of graduated pipets is very narrow, allowing for very precise measurements. Graduated pipets use a
suction mechanism to fill and release liquid. See Figure 7. A pipet is designed to dispense or deliver a
specific volume of solution to a container.
Figure 7. Graduated pipet. Shown is a 2 mL graduated pipet, calibrated to 0.1 mL.
The red bulb on the right end of the pipet is used to fill and release the liquid from the pipet.
The order of markings on a graduated pipet is opposite from the order of markings on a graduated cyl-
inder. When a 50 mL graduated cylinder contains 50 mL of liquid, the liquid is at the 50 mL marking.
However, when using a 2 mL graduated pipet, when liquid reaches the marking labeled “0,” it means
that the pipet will deliver 2 mL of liquid. There are many different types of graduated pipets, and each
has their own mechanism for dispensing liquid. For the graduated pipet that will be used in this exper-
iment, to dispense the full 2 mL from the pipet the liquid is completely released from the pipet.
Likewise, to dispense only 1 mL from the pipet the liquid is released from the “0” marking to the “1.0”
marking. See Figure 8.
Figure 8. Measuring with a graduated pipet.
Notice the “0” and “1.0” markings, both noted with black arrows.
Just as with graduated cylinders, graduated pipets are available in a variety of sizes, allowing for mea-
surements as small as 0.1 μL.
www.HOLscience.com 12 © Hands-On Labs, Inc.Experiment Laboratory Techniques and Measurements
Did You Know . . . ?
The majority of liquids in glass will form a concave-shaped meniscus.
However, some liquids, such as mercury, will form a convex meniscus. In the
case of a convex meniscus, the volume is read from the top of the curve
rather than the bottom.
Explore Measuring the Volume of a Solid
There are multiple techniques to measure the volume of a solid, three of which are discussed here. For
a solid with defined edges, such as a cube, a box, or a sphere, the length, width, and height or the
radius of the object can be measured and used to calculate volume. See Figure 9.
Volume = 4.0 cm × 12 cm × 1.5 cm ()
3 ()
Volume = 4 πr 3 = 4 π(4.0 cm3)
3
Volume = 72 cm or 72 mL
3
Volume = 270 cm3 or 270 mL
Figure 9. Calculating the volume of solid objects with defined edges
When measuring the volume of an irregularly shaped object, there are two common methods: the
water displacement method and Archimedes’s method. In the water displacement method, the irregu-
larly shaped object is placed into a known amount of water in a graduated cylinder. The increase in
water volume, as measured by the graduated cylinder, is equal to the volume of the irregularly shaped
object. See Figure 10.
Figure 10. A. Irregularly shaped object.
B. Graduated cylinder with known
amount of water. C. Graduated cylinder
with irregularly shaped object. The
difference (increase) in volume from
30.0 mL to 32.5 mL is equal to the
volume of the irregularly shaped object.
www.HOLscience.com 13 © Hands-On Labs, Inc.Experiment Laboratory Techniques and Measurements
Archimedes’s method incorporates buoyancy into the water displacement method. Buoyancy is the
upward force that a fluid places onto an object, which is equal to the weight of the displaced fluid. Put
simply, when an object is submerged and suspended in water (1 mL of water = 1 gram of water), the
change in mass as the result of the object being submerged is equal to the volume of the object. See
Figure 11.
Figure 11. Archimedes’s method. A. Water in a beaker on a
tared scale. B. Irregularly shaped object is submerged in
the water, creating a buoyant force equal to 2.5 grams.
As 1 mL of water has a mass of 1 gram, the volume of
displaced water is 2.5 mL, which is equal to the
volume of the irregularly shaped object.
Did You Know . . . ?
Archimedes, a Greek mathematician and scientist, was asked by King Hiero
II to determine if a crown made for him was composed of pure gold or con-
tained a mixture of gold and silver. As Archimedes could not damage the
crown, he had to find a way to determine its composition. It is from this
challenge that he developed what is now known as Archimedes’s Principle.
Knowing that density is a physical property that does not change,
Archimedes could determine if the density of the crown was equal to the
density of pure gold. As the densities of the crown and pure gold did not
match, he concluded that the crown was not made from pure gold.
Explore Mass and Density
Mass is defined as the measure of the amount of matter contained in a physical body. The SI unit of
mass is the kilogram (kg) and is standardized (equal) to the mass of the International Prototype
Kilogram (IPK). The IPK is composed of a platinum-iridium alloy and is stored at the International
Bureau of Weights and Measurements in Sevres, France. See Figure 12.
www.HOLscience.com 14 © Hands-On Labs, Inc.Experiment Laboratory Techniques and Measurements
It is important to note that the terms mass and weight are often
used interchangeably but are not the same thing. Mass is a quan-
tifiable measure of matter, while weight refers to the gravita-
tional force of attraction exerted on an object. The SI system
uses mass measurements, yet the verb weigh is the common verb
used to describe or obtain the mass of an object. In the labora-
tory, scientists usually work with the gram (g), which represents
one thousandth of a kilogram, and the milligram (mg), which
equals one thousandth of a gram. Mass is measured using an
instrument called a balance, which is commonly referred to as a
scale.
Density is defined as mass per unit of measure, which is most
often volume. It is a way to describe how heavy something is for Figure 12. International Prototype
its size. Like volume, density is not a fundamental SI unit of mea- Kilogram. The IPK is kept under
two bell jars. (Image courtesy of
sure, but is derived from the SI units for mass and volume. The
the U.S. Federal Government)
density of a liquid is usually reported as grams per milliliter
(g/mL), while the density of a solid is usually reported as grams
per cubic centimeter (g/cm3). The density of water is 1 g/mL. Substances with a density greater than
1 g/mL will sink when placed in water, while objects with a density less than 1 g/mL will float when
placed in water. The density of an object is determined with the following equation:
Mass
Density = Volume
Explore Significant Figures and Percent Error
Significant figures are a combination of the cer-
tain and first uncertain digit of a measurement.
The number of significant figures in a measure-
ment is dependent on the precision of the
instrument. Measurements may be estimated
to one additional place beyond the markings on
the device. This would be considered the one
allowed, uncertain digit. For example, if a ruler
is calibrated to the millimeter length, a measure-
ment may be taken to a tenth of a millimeter.
Likewise, if a ruler is calibrated to the centime-
ter length, a measurement may only be taken
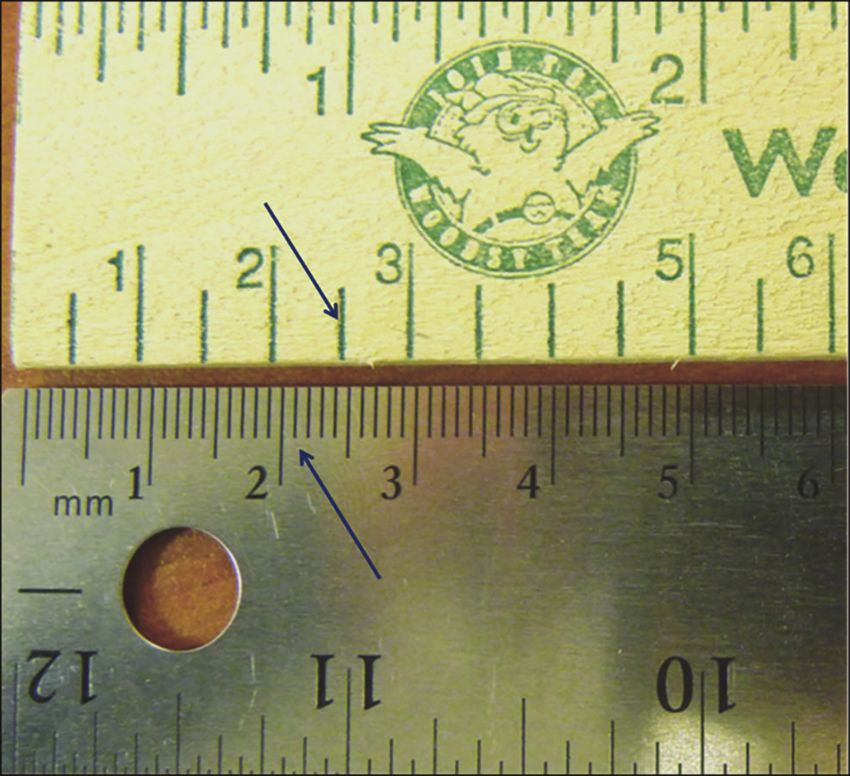
to the tenth of a centimeter. See Figure 13.
The two rulers depicted in Figure 13 can be used Figure 13. Significant figures in measurements. The
to conduct measurements with different upper ruler is calibrated to 0.5 cm, whereas the
bottom ruler is calibrated to 0.1 cm.
www.HOLscience.com 15 © Hands-On Labs, Inc.Experiment Laboratory Techniques and Measurements
significant figures. The top ruler is calibrated to 0.5 cm. If a piece of string was measured, and its
length was between 2 cm and 2.5 cm, the total length might be estimated as 2.3 cm. In this case, the
ones place (2) is one certain digit, and the tenths place (.3) is the estimated, uncertain digit. The bot-
tom ruler is calibrated to 0.1 cm (or 1 mm). The length of the same string could be reported as 2.25 cm.
In this case, there are two certain digits: one in the ones place and one in the tenths place (2.2). The
estimated, uncertain digit is in the hundredths place (.05). In general, measurements are reported one
decimal place beyond the instrument’s calibration.
Each time a particular measuring device is used, the scientist records the measurement to the same
decimal place. That is, if a scientist is using a centimeter ruler similar to the bottom one in Figure 13,
every measurement will end with a value in the hundredths column. The length of an item that is
exactly 5 cm long must be recorded as 5.00 cm using that ruler. The zeros in the tenths and hun-
dredths places indicate the precision of the measuring device. Remember, the last digit recorded is the
uncertain one. If a student records a length of 5 cm, they are telling the instructor that the 5 is uncer-
tain, and the actual length is somewhere between 4 and 6 centimeters. When a student records a
length of 5.0 cm, the 0 is uncertain or estimated and the true length is somewhere between 4.9 and
5.1 centimeters. A measurement of 5.00 centimeters indicates that the 0 in the hundredths column is
uncertain and the true length is between 4.99 and 5.01 centimeters.
Calculations should be consistent with the precision of measurements. When multiplying and dividing
measurements, the measurement with the fewest number of significant figures determines the num-
ber of digits in the calculated result. For example:
2.36 cm × 3.1 cm = 7.316 cm2
Recorded as 7.3 cm2
The product should be recorded as 7.3 cm2 since there are only two significant figures in the least pre-
cise factor, 3.1 cm.
When adding or subtracting, the result of the calculation cannot be more precise, have more decimal
places, than the least precise measurement:
22.55 g + 75.3 g + 13 g = 110.85 g
Recorded as 111 g
The sum should be recorded as 111 g since the least precise number was precise to the full gram, 13 g.
Often measured results will differ from known values. Percent error (the difference between the
accepted/true value and the value that was measured) may be calculated using the following formula:
|Measured Value – Accepted Value|
Percent Error (%) = Accepted Value × 100
www.HOLscience.com 16 © Hands-On Labs, Inc.Experiment Laboratory Techniques and Measurements
Exercise 1: Length, Temperature, and Mass
In this experiment, you will make measurements using the SI system units for length, mass, and
temperature.
Read the procedure for each experiment in its entirety before you begin.
Student-Supplied Materials
• aluminum pie pan • plastic or glass cup
• matches or lighter • 3 quarters
• CD or DVD • metric ruler
• 4 dimes • ice cubes
• fork • water
• key • spoon
• pen or pencil • gloves
• 5 pennies
Lab Kit Materials
The materials for this experiment are found in the HOL Chem 1 Lab Kit.
• aluminum cup, 2 oz • glass beaker, 100 mL
• burner fuel • safety glasses
• burner stand • thermometer
• digital scale
Procedure, Part 1: Length Measurements
1. Gather the metric ruler, CD or DVD, key, spoon, and fork.
2. Look at the calibration marks on your ruler to determine the degree of uncertainty and number
of significant figures that can be made when measuring objects with the ruler.
Note: Record every measurement you make with this ruler to the same decimal place. Remember
to do this any time you use this ruler throughout the experiment.
3. Measure the length of each of the following objects (CD or DVD, key, spoon, fork) with the ruler
in centimeters (cm) to the correct level of precision. Record each measurement in Data Table 1:
Length Measurements.
4. Convert the measurements for each of the objects from centimeters to millimeters and record in
Data Table 1.
www.HOLscience.com 17 © Hands-On Labs, Inc.Experiment Laboratory Techniques and Measurements
5. Convert the measurements for each of the objects to meters and record in Data Table 1.
Data Table 1: Length Measurements
Length (cm) Length (mm) Length (m)
CD or DVD
Key
Spoon
Fork
Procedure, Part 2: Temperature Measurements
1. Gather the 100 mL glass beaker, cup (plastic or glass), matches or lighter, burner stand, burner
fuel, thermometer, 2 oz aluminum cup, and aluminum pie pan.
Note: The thermometer is shipped in a protective cardboard tube labeled “thermometer.”
2. Look at the calibration marks on the thermometer to determine the degree of uncertainty and
number of significant figures that can be made when measuring temperature.
Note: Record every measurement you make with this thermometer to the same decimal place.
Remember to do this any time you use this measuring device throughout the experiment.
3. Turn on the tap water to hot. Let the water run as hot as possible for approximately 15 seconds.
4. Fill the 100 mL glass beaker with approximately 75 mL of hot tap water.
5. Measure the temperature of the hot tap water with the thermometer in degrees Celsius
(°C) to the correct level of precision. Record the measurement in Data Table 2: Temperature
Measurements.
Note: When measuring the temperature, place the thermometer into the water so that the silver
bulb is fully submerged without touching the bottom or any sides of the glass beaker. The mea-
surement is complete when the thermometer remains the same temperature without changing.
6. Put on safety glasses and gloves.
7. Assemble the burner setup and light the fuel, using the following directions. See Figure 14.
a. Place an aluminum pie pan on a solid work surface away from flammable objects.
b. Set the burner stand toward the back of the pie pan.
c. Place the beaker on the center of the stand.
d. Uncap the burner fuel and set cap aside. Place the burner fuel on the pie pan just in front of the
stand.
e. Use matches or a lighter to ignite the fuel. BE CAREFUL: the flame may be nearly invisible.
f. Gently slide the fuel under the stand without disturbing the beaker.
www.HOLscience.com 18 © Hands-On Labs, Inc.Experiment Laboratory Techniques and Measurements
g. The small, 2 oz aluminum cup will be placed over the fuel to extin-
guish the flame. Set the aluminum cup next to the burner setup so
you are ready to extinguish the flame at any point.
8. Allow the water to heat until it comes to a full boil. As soon as the
water is boiling, measure the temperature with the thermometer
in degrees Celsius (°C) to the correct level of precision. Record the
Figure 14. Burner fuel setup
measurement in Data Table 2.
9. Allow the water to continue boiling for approximately 5 minutes.
After 5 minutes, measure the temperature with the thermometer in degrees Celsius (°C) to the
correct level of precision. Record the measurement in Data Table 2.
10. Use the 2 oz aluminum cup to extinguish the burner fuel
flame, using the following directions. See Figure 15.
a. Do not touch the metal stand or the beaker; they may be
hot.
b. Carefully slide the burner fuel canister out from under-
neath the burner stand. The sides of the burner fuel canis-
ter will be warm but not hot.
c. Place the aluminum cup directly over the flame to
smother it. The cup should rest on top of the fuel can-
ister, with little or no smoke escaping. Do not disturb
the burner stand and beaker; allow everything to cool
completely.
Figure 15. Using the aluminum cup to
d. Once all equipment is completely cool, remove the alumi- extinguish the flame
num cup and place the plastic cap back on the fuel. Ensure
that the plastic cap snaps into place to prevent fuel leakage and evaporation. The aluminum
cup, fuel, and all other materials may be used in future experiments.
11. Allow the 100 mL beaker to cool before touching it.
12. Turn on the tap water to cold. Let the water run as cold as possible for approximately 15 seconds.
13. Fill the cup (plastic or glass) approximately half full with cold tap water.
14. Measure the temperature of the cold tap water with the thermometer in degrees Celsius (°C) to
the correct level of precision. Record the measurement in Data Table 2.
15. Add a handful of ice cubes to the cup of cold tap water and allow them to sit in the cold water for
approximately 1 minute.
16. After 1 minute, stir the ice water with the thermometer.
www.HOLscience.com 19 © Hands-On Labs, Inc.Experiment Laboratory Techniques and Measurements
17. Measure the temperature of the ice water after 1 minute with the thermometer in degrees Celsius
(°C) to the correct level of precision. Record the measurement in Data Table 2.
18. Allow the ice to remain in the water for an additional 4 minutes.
19. After 4 minutes, stir the ice water with the thermometer.
20. Measure the temperature of the ice water with the thermometer in degrees Celsius (°C) to the
correct level of precision. Record the measurement in Data Table 2.
21. Convert the temperature measurements for each of the 6 water samples from °C to °F and K.
Record the converted temperatures in Data Table 2.
Data Table 2: Temperature Measurements
Temperature (°C) Temperature (°F) Temperature (K)
Hot from Tap
Boiling
Boiling for 5 minutes
Cold from Tap
Ice Water, 1 minute
Ice Water, 5 minutes
Using the Digital Scale
1. Remove the scale from the box and discard any excess packaging, including the strip inside
the cover, next to the batteries.
2. Remove the lid from the scale and turn it on. Make sure that the scale is set to read in
grams.
3. Place a small sheet of clean paper on the scale.
4. Tare the scale by pressing the Φ/T button so that the scale reads 0.0 g.
5. Add the item to the scale and read the mass.
6. Record the mass and continue with your experiment.
Procedure, Part 3: Mass Measurements
1. Gather the pen or pencil, 5 pennies, 3 quarters, 4 dimes, and the key.
2. Read the instructions on how to use the digital scale. The lid of the scale must be opened to
expose its weighing surface and make mass measurements.
Note: There may be a cardboard protector between the scale base and top. If so, remove the card-
board from the scale.
www.HOLscience.com 20 © Hands-On Labs, Inc.Experiment Laboratory Techniques and Measurements
3. Turn the scale on by pressing the Φ/T button.
4. Make sure the scale is reading in grams by looking for the letter g in the upper right corner of the
scale. If the g is not showing, then press the M button until the scale is reading in grams.
5. Review the different objects listed in Data Table 3: Mass Measurements.
6. Estimate the masses for each of the objects in grams and record in Data Table 3. To help you with
this process, a penny has a mass of approximately 2.5 grams.
7. Tare the scale by pressing the Φ/T button so that the scale reads 0.0 g.
8. Place the pen or pencil on the scale to measure the mass of the object. Record the mass in Data
Table 3 under Actual Mass (g).
9. Repeat steps 7 and 8 for the remaining objects in Data Table 3.
10. For each item or group of objects, convert the actual mass (in grams) to kilograms (kg). Record in
Data Table 3.
Data Table 3: Mass Measurements
Estimated Mass (g) Actual Mass (g) Actual Mass (kg)
Pen or Pencil
3 Pennies
1 Quarter
2 Quarters, 3 Dimes
4 Dimes, 5 Pennies
3 Quarters, 1 Dime, 5 Pennies
Key
Key, 1 Quarter, 4 Pennies
Exercise 1 Questions
1. Water boils at 100°C at sea level. If the water in this experiment did not boil at 100°C, what could
be the reason?
www.HOLscience.com 21 © Hands-On Labs, Inc.Experiment Laboratory Techniques and Measurements
2. While heating two different samples of water at sea level, one boils at 102°C and one boils at
99.2°C. Calculate the percent error for each sample from the theoretical 100.0°C.
Exercise 2: Volume and Density
Student-Supplied Materials
• distilled water • metric ruler
• isopropyl (rubbing) alcohol (C3H8O) • gloves
Lab Kit Materials
The materials for this experiment are found in the HOL Chem 1 Lab Kit.
• digital scale • metal bolt
• glass beaker, 100 mL • short-stem pipet
• graduated cylinder, 25 mL • string, 1 m
• magnet bar • safety glasses
Procedure, Part 1: Volume and Density Measurements (Liquid)
1. Gather the graduated cylinder, distilled water, short-stem pipet, and isopropyl alcohol. Put on
gloves and safety glasses.
2. Place the clean, dry 25 mL graduated cylinder on the tared scale. Record the mass of the
graduated cylinder (g) in Data Table 4: Liquid Measurements under the Mass A column for water.
3. Fill the graduated cylinder with 5.0 mL of distilled water; use the short-stem pipet to measure
exactly 5.0 mL of water. Record the volume in Data Table 4.
4. Place the 25 mL graduated cylinder with 5.0 mL distilled water on the tared scale. Record the
mass of the graduated cylinder + liquid (g) in Data Table 4 under Mass B.
5. Calculate the mass of the water by subtracting Mass A from Mass B. Record the mass of the water
in Data Table 4.
6. Pour the water down the drain and fully dry the graduated cylinder.
www.HOLscience.com 22 © Hands-On Labs, Inc.Experiment Laboratory Techniques and Measurements
7. Repeat steps 2–6 for the isopropyl alcohol.
8. Calculate the densities of both the water and the isopropyl alcohol and record in Data Table 4.
9. The accepted value for the density of water is 1.00 g/mL and the accepted density for isopropyl
alcohol is 0.786 g/mL. Determine the percent error between your calculated densities and the
accepted values for both water and isopropyl alcohol. Record the percent error in Data Table 4.
Data Table 4: Liquid Measurements
Water Isopropyl Alcohol
Mass A: Graduated Cylinder (g)
Volume (mL)
Mass B: Graduated Cylinder with Liquid (g)
Mass B – A: Liquid (g)
Density (g/mL)
Percent Error (%)
Procedure, Part 2: Volume and Density Measurements (Solid)
Direct Measurement Method
1. Gather the metal bolt, string, magnet, graduated cylinder, beaker, metric ruler, and scale.
2. Tare the scale by pressing the Φ/T button so that the scale reads 0.0 g.
3. Place the magnet on the scale to measure the mass of the object. Record the mass in Data
Table 5: Magnet—Direct Measurement Method.
4. Use the ruler to measure the length, width, and height of the magnet in centimeters to the
correct level of precision. Record the measurements in Data Table 5.
5. Calculate the volume of the magnet by multiplying the length × width × height, and record in
Data Table 5.
6. Calculate the density of the magnet by dividing the mass by the volume and record in Data
Table 5.
Data Table 5: Magnet—Direct Measurement Method
Magnet
Mass (g)
Length (cm)
Width (cm)
Height (cm)
Volume (cm3)
Density (g/cm3)
www.HOLscience.com 23 © Hands-On Labs, Inc.Experiment Laboratory Techniques and Measurements
Water Displacement Method
1. Tare the scale by pressing the Φ/T button so that the scale reads 0.0 g.
2. Place the magnet on the scale to measure the mass of the object. Record the mass in Data Table
6: Water Displacement Method.
3. Fill the graduated cylinder with 6–8 mL of distilled water. Record the volume, to the correct
decimal place, in Data Table 6.
4. Carefully slide the magnet into the graduated cylinder so that the water doesn’t splash. Read the
volume of the graduated cylinder. Record the volume in Data Table 6, next to Final Volume of
Graduated Cylinder.
5. Determine the volume of the object by calculating the difference in water displacement volumes
(final – initial). Record in Data Table 6.
6. Calculate the density of the magnet and record in Data Table 6.
7. Carefully pour the water from the cylinder down the drain and collect the magnet.
8. Repeat these steps for the metal bolt.
Data Table 6: Water Displacement Method
Magnet Metal Bolt
Mass (g)
Initial Volume of Graduated Cylinder (mL)
Final Volume of Graduated Cylinder (mL)
Object Volume (mL)
Density (g/mL)
Cleanup
1. Clean all glassware and lab equipment with soap and water.
2. Rinse the equipment again with distilled water.
3. Dry all items with paper towels and return them to the lab kit for future use.
www.HOLscience.com 24 © Hands-On Labs, Inc.Experiment Laboratory Techniques and Measurements
Exercise 2 Questions
1. An unknown, rectangular substance measures 3.60 cm high, 4.21 cm long, and 1.17 cm wide. If
the mass is 21.3 g, what is this substance’s density (in g/mL)? Remember to always show your
work.
2. A sample of gold (Au) has a mass of 26.15 g. Given that the theoretical density is 19.30 g/mL, what
is the volume of the gold sample?
3. A student was given an unknown metal. The student determined that the mass of the metal
was 30.2 g. The student placed the metal in a graduated cylinder filled with 20.0 mL of water.
The metal increased the volume of water to 22.9 mL. Calculate the density of the metal and
determine the identity of the metal using the table below.
Table 1: Density of Metals
Metal Density (g/mL)
Lead 11.3
Silver 10.5
Nickel 9.90
Zinc 7.14
www.HOLscience.com 25 © Hands-On Labs, Inc.Lesson
2 Basic Building
Materials
Activities
Complete the following activity.
Activity: Color Coding the Periodic Table
Having your periodic table for use in each lesson is key to your success in this course. In this activity,
you’ll make a simplified version to help visualize how it is arranged.
Materials
• blank periodic table (included in the appendix)
• colored pencils
Procedure
1. Using the blank periodic table, create a color-coded periodic table according to the directions
below. Provide a key. Include a photo of your work.
a. Color the boron group gray
b. Color the nitrogen group light brown
c. Color the transition metals yellow
d. Color the alkali metals green
e. Color the alkaline earth metals pink
f. Color the halogens purple
g. Color the noble gases red
h. Add blue stripes to all the nonmetals (don’t forget hydrogen!)
i. Color the lanthanide series orange
j. Color the actinide series blue
k. Add black dots to all the metalloids
l. Add the labels 1A–8A and 1B–8B to your periodic table (see textbook pages 42–43)
Oak Meadow 27Lesson 2: Basic Building Materials Chemistry Matters Lab Manual
2. Fill in the blanks in the following sentences.
a. Rows of elements in the periodic table are called .
b. Columns of elements in the periodic table are called or
.
c. Using page 44 of the textbook, identify the name of the following groups:
• Group 1 (1A)
• Group 2 (2A)
• Groups 3–12 (1B–8B)
• Group 17 (7A)
• Group 18 (8A)
28 Oak MeadowLesson
6 Speaking of
Molecules
Activities
Complete both of the following activities:
• Activity A: Single, Double, and Triple Bond Experiment for Kids
• Activity B: Connect the Dots: Lewis Dot Structure Tetris
Activity A: Single, Double, and Triple Bond Experiment for Kids
Design a short inquiry-based experiment using everyday household items to explain to an elementary
school student the difference between single, double, and triple bonds as well as their relative strength,
and what they look like. Your goal is to make something that could be sent to fifth-grade students, so
make it fun! Provide a one-page lab handout for the students, answers for your experiment questions,
and photos of the setup and experiment design. Be sure to teach your students something about sin-
gle, double, and triple bonds in a way they can understand and relate to!
Activity B: Connect the Dots: Lewis Dot Structure Tetris
Materials
• scissors
• glue or tape
• white paper
• Lewis dot puzzle pieces (included in the appendix)
Procedure
1. Cut out the Lewis dot puzzle pieces.
2. Complete the activity on page 160 of your textbook, answering the questions.
3. Photograph your completed structures to share with your teacher.
Oak Meadow 37Lesson
17 Toxic Cleanup
Experiment
Complete the following lab experiment.
Stoichiometry of a Precipitation Reaction
The materials for this experiment are found in the HOL Chem 1 Kit.
Answer all questions. Provide data tables. Provide photos of your setup and results.
Experiment
Stoichiometry of a Precipitation
Reaction
Learning Objectives
• Calculate the theoretical maximum amount of product produced in a precipitation reaction using
stoichiometry.
• Perform a precipitation reaction and measure the precipitate to calculate percent yield.
• Explain differences between theoretical and actual yield in a controlled experiment.
www.HOLscience.com 193 © Hands-On Labs, Inc.Experiment Stoichiometry of a Precipitation Reaction
Exploration
Explore Chemical Equations
A chemical equation is an illustration of the reaction that occurs between two or more specific chemi-
cal compounds. Chemical equations use letters and numbers to represent the chemical elements and
the amounts or ratios of those elements present in the compounds that are either participating in the
reaction or are a product of the reaction. For example, one methane molecule contains one carbon
atom and four hydrogen atoms and is denoted as CH4. The chemical compounds that are present
before a reaction occurs are called reactants, and the compounds produced from the reaction are
called products. In addition to identifying the products and reactants in a balanced chemical reaction,
a chemical equation will also quantitatively identify the proportion of reactants to products. This
quantitative proportion is known as stoichiometry, and it can be used to determine how much of each
reactant is needed to produce a specific amount of each product. See Figure 1.
Figure 1. A balanced chemical equation. The chemical equation shows the chemical reaction between copper(II) sulfate
and sodium hydroxide. The equation shows that when 1 formula unit of copper(II) sulfate reacts with 2 formula units of
sodium hydroxide, 1 formula unit of copper(II) hydroxide and 1 formula unit of sodium sulfate are produced.
As shown in Figure 1, chemical equations often denote the physical states of the reactants and prod-
ucts. The reaction in Figure 1 is a precipitation reaction where two solutions are mixed and an insoluble
substance (precipitate) forms, which is then able to be separated or removed from the solution. The (s)
after Cu(OH)2(s) denotes that a solid was formed as a product from the two aqueous (aq) reactants.
The stoichiometry of a balanced chemical equation can be used to calculate the mass and number of
moles of each reactant and each product in a chemical reaction.
Explore Moles and the Periodic Table
A mole (mol) is a unit of measure describing the amount of a chemical substance that contains as
many atoms, formula units, or molecules as there are in exactly 12 grams of pure carbon (12C). One
mole of a substance has 6.022 × 10²³ atoms (for an element, this represents Avogadro’s number),
molecules (for a compound), or formula units (for an ionic compound) and is equal to its molecular
weight (molecular mass or formula mass). For example, the element sodium has a molecular mass of
22.99 grams; thus, 1 mole of sodium is equal to 22.99 grams. Likewise, the compound H2O has a molec-
ular mass of H + H + O (1.008 + 1.008 + 16.00); thus, 1 mole of H2O is equal to 18.016 grams. The molar
mass of each element is found in the periodic table.
Explore Stoichiometric Quantities and Calculations
In addition to determining the amount of product formed in a reaction, stoichiometry can be used to
determine how much of each reactant is required for all reactants to be used up at the same time. The
www.HOLscience.com 194 © Hands-On Labs, Inc.Experiment Stoichiometry of a Precipitation Reaction
quantities of reactants that are needed to fully react with one another at the same time are known as
stoichiometric quantities. Stoichiometric quantities can be used to maximize the amount of product
produced from the chemical reaction. For example, if you were performing the reaction in Figure 1 and
had 5.70 grams of CuSO4, you can use the balanced chemical equation and stoichiometry to determine
how many grams of NaOH you would need to create the maximum amount of Cu(OH)2. More specifi-
cally, to quantitatively calculate the maximum amount of product expected through a chemical reac-
tion, you need only a balanced chemical equation, the molar mass of each substance, and the quantity
of substance available for only one of the reactants.
A step-by-step example of this process, using the balanced equation from Figure 1, is shown below:
CuSO4(aq) + 2NaOH(aq) → Cu(OH)2(s) + Na2SO4(aq)
Assuming there are only 5.70 grams of CuSO4 available, how many grams of NaOH are necessary to
reach stoichiometric quantities? How many grams of solid Cu(OH)2 are expected to be produced?
Step 1. Check that the equation is balanced. To do this, ensure that there is the same number of atoms
from each element on both sides of the equation.
Step 2. Convert the 5.70 grams of CuSO4 to moles of CuSO4.
1 mol CuSO
5.70 g CuSO4 × 159.62 g CuSO4 = 0.0357 mol CuSO4
4
Step 3. Evaluate the molar ratio between CuSO4 and NaOH.
2 mol NaOH
0.0357 mol CuSO4 × 1 mol CuSO4
= 0.0714 mol NaOH
The chemical equation states that for 1 mole of CuSO4, 2 moles of NaOH are needed for stoichiometric
quantities. Using the information calculated in step 2, if there are 0.0357 moles of CuSO4, then 0.0714
moles of NaOH are required for a complete reaction.
Step 4. Convert moles of NaOH to grams of NaOH.
40.0 g NaOH
0.0714 mol NaOH × 1 mol NaOH
= 2.86 g NaOH
This shows that 2.86 grams of NaOH are required to completely react with the 5.70 grams of CuSO4.
Step 5. Determine the amount (moles) of Cu(OH)2 expected from the reaction.
1 mol Cu(OH)2
0.0357 mol CuSO4 × 1 mol CuSO4
= 0.0357 mol Cu(OH)2
The chemical equation states that for every 1 mole of CuSO4 used, 1 mole of Cu(OH)2 is expected. This
means that the 0.0357 moles of CuSO4 should produce 0.0357 moles of Cu(OH)2.
Step 6. Calculate the theoretical yield by converting moles of Cu(OH)2 to grams of Cu(OH)2.
97.56 g Cu(OH)2
0.0357 mol Cu(OH)2 × 1 mol Cu(OH)2
= 3.48 g Cu(OH)2
www.HOLscience.com 195 © Hands-On Labs, Inc.Experiment Stoichiometry of a Precipitation Reaction
To double-check the results of the calculations, the law of the conservation of mass can be applied.
According to this law, the mass of the products in a chemical reaction must equal the mass of the
reactants.
Step 7. To double-check the conservation of mass, first calculate the mass of Na2SO4 that is expected
from the reaction. With a 1:1 ratio, 0.0357 moles of Na2SO4 are expected.
1 mol Na2SO4
0.0357 mol CuSO4 × 1 mol CuSO4
= 0.0357 mol Na2SO4
142.04 g Na2SO4
0.0357 mol Na2SO4 × 1 mol Na2SO4
= 5.07 g Na2SO4
Step 8. To verify the results of the calculations and have confidence in the series of stoichiometric cal-
culations, calculate the sum of the reactants and the sum of the products.
5.70 g CuSO4(aq) + 2.86 g 2NaOH(aq) = 3.48 g Cu(OH)2(s) + 5.07 g Na2SO4(aq)
However, in practical experimentation, a system is seldom completely closed. As a result, one should
realistically expect a slightly smaller amount of product, as the theoretical yield is rarely obtained. This
deviation, from theoretical yield to actual yield, is called the percent yield and can be calculated.
Note: Always watch significant figures during calculations, or the theoretical yield of the products and
reactants may differ slightly.
Step 9. Determine the percent yield.
Assume that the actual yield was 3.26 g Cu(OH)2.
Actual Yield
Theoretical Yield
× 100% = Percent Yield
Using the yields both given and calculated:
3.26 g Cu(OH)2
3.48 g Cu(OH)2
× 100% = 93.7%
Explore Hydrates
In this experiment, you will use stoichiometry to determine the quantities necessary for a com-
plete precipitation reaction between sodium carbonate (Na2CO3) and calcium chloride dihydrate
•
(CaCl2 2H2O). A hydrate is a solid compound that contains water molecules. Hydrates are named by
adding a prefix plus the word hydrate to the end of the standard name of the compound. These pre-
fixes (mono-, di-, tri-, tetra-, etc.) indicate the number of moles of water molecules present for each
mole of the compound. For example:
•
CuSO4 5H2O = Copper(II) sulfate pentahydrate
MgSO • 7H O = Magnesium sulfate heptahydrate
4 2
www.HOLscience.com 196 © Hands-On Labs, Inc.Experiment Stoichiometry of a Precipitation Reaction
•
The equations above state that 1 mole of CuSO4 5H2O contains 1 mol CuSO4 and 5 mol H2O; and
•
1 mol MgSO4 7H2O contains 1 mol MgSO4 and 7 mol H2O. Water molecules in a hydrate are easily
removed by heating the solid hydrate or by dissolving it in water. Thus, while the molecular weight of
•
the CaCl2 2H2O compound includes the 2 water molecules, only the CaCl2 portion of the compound is
available to react with the sodium carbonate when placed into solution.
•
Assume that there were 5.0 g of CaCl2 2H2O, and you needed to determine the moles of CaCl2 avail-
able in that 5.0 g to react in an aqueous solution with Na2CO3. Convert the 5.0 g of CaCl2 2H2O to•
•
mol CaCl2 2H2O.
• • 2H O
1 mol CaCl • 2H2O
5.0 g CaCl2 2H2O × 147.01 g CaCl2 • 2H2O
= 0.034 mol CaCl2 2
2
•
Thus, in 5.0 g CaCl2 2H2O there are 0.034 mol CaCl2 available to react in an aqueous solution with
Na2CO3. If the stoichiometry of the reaction was 1:1, then 0.034 mol Na2CO3 would be required to reach
stoichiometric quantities and fully react with all the CaCl2 in solution.
Did You Know . . . ?
Stoichiometry is used in everyday life. Converting standard food recipes to
produce larger or smaller amounts is one example. If 4 tablespoons of butter
and 1 egg are used to produce 12 cookies, then 8 tablespoons of butter and
2 eggs would be needed to yield 24 cookies. That’s stoichiometry!
Exercise 1: Stoichiometry of a Precipitation Reaction
In this exercise, you will use stoichiometry to determine the amount of reactant needed to create the
maximum amount of product in a precipitation reaction. After performing the reaction, you will calcu-
late the percent yield of product. Share photos of your setup and results with your teacher.
Student-Supplied Materials
• distilled water • paper towels
• dish soap • white paper
• scissors • tap water
Lab Kit Materials
The materials for this experiment are found in the HOL Chem 1 Lab Kit.
• digital scale • graduated cylinder, 25 mL
• funnel, 70 mm • gloves
• 2 glass beakers, 100 mL • safety glasses
www.HOLscience.com 197 © Hands-On Labs, Inc.Experiment Stoichiometry of a Precipitation Reaction
• metal spatula • calcium chloride dihydrate
• glass stirring rod •
(CaCl2 2H2O) – 2.5 g
• filter paper, 12.5 cm • sodium carbonate (Na2CO3), 2.0 g
• Experiment Bag: Chemistry 1
Procedure
1. Review the following reaction, where sodium carbonate and calcium chloride dihydrate react in
an aqueous solution to create calcium carbonate (solid precipitate formed in the reaction), a salt
(sodium chloride), and water.
•
Na2CO3(aq) + CaCl2 2H2O(aq) → CaCO3(s) + 2NaCl(aq) + 2H2O(aq)
2. Put on your safety glasses and gloves.
3. Use the graduated cylinder to measure 25 mL of distilled water. Add 25 mL of distilled water to
each of the two 100 mL glass beakers.
4. Cut a small square of white paper and place it on the scale.
Tare the scale by pressing the Φ/T button so that the scale
reads 0.0 g. See Figure 3.
5. Use the metal spatula to measure 1.50 grams of the
•
CaCl2 2H2O.
•
6. Carefully add the CaCl2 2H2O to one of the beakers
containing 25 mL of distilled water. Use the metal spatula to
transfer any residue remaining on the piece of paper. Swirl the
•
mixture until the CaCl2 2H2O is fully dissolved into the water.
7. Rinse the metal spatula with distilled water and fully dry it Figure 3. Tared scale with the
small square of paper
with paper towels.
8. Use the information and examples provided in the Exploration
•
section to calculate how many moles of CaCl2 2H2O are present in 1.50 grams of CaCl2 2H2O, •
and then calculate how many moles of pure CaCl2 are present in the 1.50 grams of CaCl2 2H2O. •
Record the answers in Data Table 1: Stoichiometry Values.
9. Use the information and examples provided in the Exploration section and the values input
into Data Table 1 (from step 8) to determine how many moles of Na2CO3 are necessary to reach
stoichiometric quantities. From that calculation, determine how many grams of Na2CO3 are
necessary to reach stoichiometric quantities. Record both values in Data Table 1.
10. Cut a new small square of white paper and place it on the scale. Tare the scale by pressing the Φ/T
button so that the scale reads 0.0 g.
www.HOLscience.com 198 © Hands-On Labs, Inc.You can also read