Design and Implementation of a Low-Cost Portable Water Quality Monitoring System
←
→
Page content transcription
If your browser does not render page correctly, please read the page content below
Computers, Materials & Continua                                                                 Tech Science Press
DOI:10.32604/cmc.2021.018686
Article

         Design and Implementation of a Low-Cost Portable Water Quality
                              Monitoring System
   Anabi Hilary Kelechi1, Mohammed H. Alsharif 2 , Anya Chukwudi-eke Anya3 , Mathias U. Bonet1 ,
       Samson Aiyudubie Uyi1 , Peerapong Uthansakul4, * , Jamel Nebhen5 and Ayman A. Aly6

   1
      Department of Aerospace Engineering, College of Engineering, AirForce Institute of Technology, Kaduna, Nigeria
        2
          Department of Electrical Engineering, College of Electronics and Information Engineering, Sejong University,
                                               Gwangjin-gu, Seoul, 05006, Korea
    3
      Department of Electrical Engineering and Information Engineering, College of Engineering, Covenant University,
                                         Canaanland, Ota, P.M.B 1023, Ogun, Nigeria
      4
        School of Telecommunication Engineering, Suranaree University of Technology, Nakhon Ratchasima, Thailand
 5
   Prince Sattam bin Abdulaziz University, College of Computer Engineering and Sciences, Alkharj, 11942, Saudi Arabia
          6
            Department of Mechanical Engineering, College of Engineering, Taif University, Taif, 21944, Saudi Arabia
                         *
                           Corresponding Author: Peerapong Uthansakul. Email: uthansakul@sut.ac.th
                                       Received: 16 March 2021; Accepted: 17 April 2021

                 Abstract: Water is one of the needs with remarkable significance to man
                 and other living things. Water quality management is a concept based on
                 the continuous monitoring of water quality. The monitoring scheme aims to
                 accumulate data to make decisions on water resource descriptions, identify
                 real and emergent issues involving water pollution, formulate priorities, and
                 plan for water quality management. The regularly considered parameters
                 when conducting water quality monitoring are turbidity, pH, temperature,
                 conductivity, dissolved oxygen, chemical oxygen demand, biochemical oxygen
                 demand, ammonia, and metal ions. The usual method employed in capturing
                 these water parameters is the manual collection and sending of samples to a
                 laboratory for detection and analysis. However, this method is impractical in
                 the long run because it is laborious and consumes a considerable amount of
                 human resources. Sensors integrated into a mobile phone application inter-
                 face can address this issue. This paper aims to design and implement an
                 Internet of Things-based system comprising pH, temperature, and turbidity
                 sensors, which are all integrated into a mobile phone application interface
                 for a water monitoring system. This project utilizes the Bluetooth Standard
                 (IEEE 802.15.1) for communication/transfer of data, while the water quality
                 monitoring system relies on the pH, turbidity, and temperature of the test
                 water.

                  Keywords: Temperature sensor; pH sensor; turbidity; IoT; water monitoring

                      This work is licensed under a Creative Commons Attribution 4.0 International License,
                      which permits unrestricted use, distribution, and reproduction in any medium, provided
                      the original work is properly cited.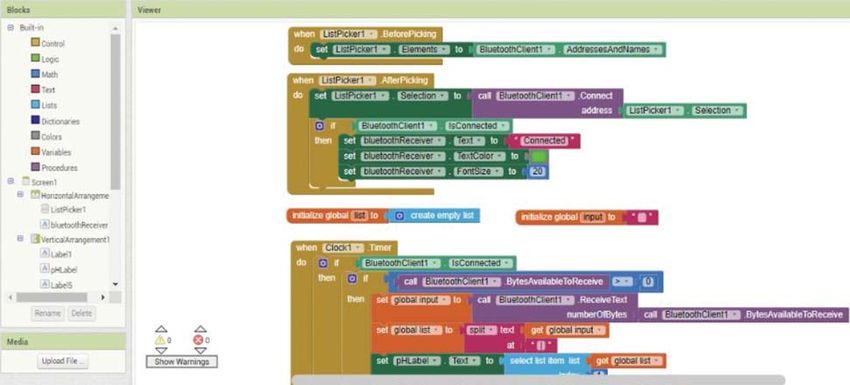
2406                                                                         CMC, 2021, vol.69, no.2

1 Introduction
     Waterborne disease, which is the primary source of many diseases, such as cholera and
diarrhea, is prevalent globally. The most effective approach to curtail the spread of such diseases
is to monitor the drinking water quality, which is the primary duty of the public health depart-
ment [1]. The WHO has defined water quality standards for drinking water [2]. Approximately
75% of drinking water in Africa is derived from underground water sources [3]. This finding places
emphasis on the importance of water quality monitoring due to the changes in the water quality.
     In agricultural practice, the continuous use of fertilizers can accelerate the rise in the level
of nutrients in nearby water, leading to eutrophication [4]. Human causes of water pollution
include the discharge of chemicals, which can lead to the loss of animal life. These kinds of
human-related activities can also lead to water pollution, which induces excessive growth in algae
when eaten by marine animals, eventually leading to an outbreak of fish disease or death. The
development and reproduction of aquatic creatures are significantly retarded in polluted water.
Another cause of death or decline in adaptation and deviant conduct of marine animals is the
excessive mercury in water. Photosynthesis in plants and trees could be affected by water pollution,
which influences the entire dependence on plants and trees by other entities in the ecosystems [5].
The 2020 Environmental Performance Index (EPI) exhibits a strong correlation between EPI Score
and GDP per capita, as shown in Fig. 1 [6]. Thus, countries with high GDP have improved water
quality at their disposal.

             Figure 1: Relationship between 2020 EPI score and GDP per capita [6]
CMC, 2021, vol.69, no.2                                                                         2407

     According to [7], contaminated water has been identified as the cause of at least 200 million
cases of diseased individuals and deaths ranging from 5 million and above (yearly). The adoption
and integration of IoT as a key enabler for wireless sensor communication has opened many
frontiers in object monitoring, information gathering, and transportation over secured wireless
protocols. Some of the major drivers of the IoT platforms are as follows: low power consump-
tion of the sensor unit [8], strong connectivity efficiency using the HTTP and HTTPS secured
protocols [8,9], trustworthy/authentic means of data transfer [8,10], colossal market size [11], data
management considerations [11,12], and storage management considerations [13]. Some of the
companies implementing and investing in IoT systems include Verizon, Nokia, Honeywell Int’l,
Amazon, Intel, and Cisco systems [14]. This study aims to develop a low-cost, high-precision water
pollution monitoring device capable of measuring portal water quality under real-time architecture
using an IoT platform. The system working principle was subdivided into sub-routine/objectives
and tested to ensure that the system is efficiently functioning. The goals of this study are as
follows.
    • Design a water monitoring system based on Arduino Uno platform comprising temperature,
      pH, and turbid sensors.
    • Interface the system with an MIT App inventor user interface to display the water quality
      index.
    • Integrate the system with an Internet of Things (IoT) platform to enable remote monitoring
      of the water quality index.
    The organization of the paper is as follows. Section 2 details a standard and structured review
of past work in this area of study, drawing parallels between them and highlighting each weakness
and strength. Section 3 introduces the methodologies used in this system design and explains the
methods and the reasons for using such methods. Section 4 focuses on the actual design and
implementation. Section 5 presents the results and discussions.

2 Literature Review
     The protocols and standards required for implementing the wireless sensor network in various
industries differ. Hence, new/existing standards and protocols must expand the wireless sensor
network application to the industrial circle [15]. The majority of the standards used in wireless
communication are supported by the IEEE standards, which include IEEE802.11, IEEE802.15.1,
IEEE802.15.4, and IEEE 802.16 [16]. This standard applies to the physical (PHY) and media
access control layers of the wireless personal area network. The IEEE802.11 is a networking
infrastructure used by wireless fidelity (Wi-Fi) local area wireless networking. The Bluetooth
network (IEEE802.15.1) is configured as a wireless personal area network with one main function,
that is, to link devices to a personal computer or cell phone. The IEEE802.15.4 is designed
for low-cost, minimal power, low to moderate/average information rate and optimization applica-
tions [16]. IEEE802.16 is the foundation for wireless metropolitan area network design. Another
protocol that supports IoT technology is the ZigBee, which was developed in 2004 by ZigBee
Alliance. The protocol currently has three models: ZigBee 2006, ZigBee 2007 otherwise known as
ZigBee, and ZigBee PRO. All the models of the ZigBee standard generally have some features. For
instance, the models are capable of handling mesh networks utilizing multiple types of network
equipment.
     Wireless networking is one of the most desired innovations because it delivers the same
benefits as a wired connection, including minimum deployment and operating costs. However, spe-
cific problems must be considered when merging several wireless technologies into the same vital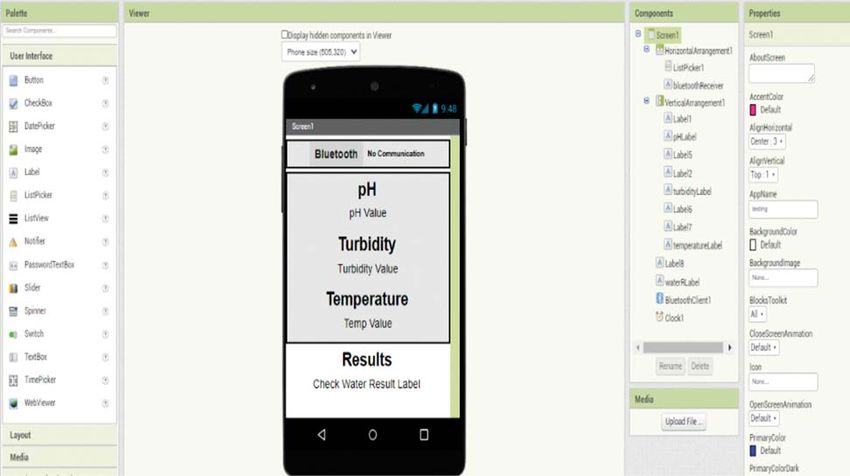
2408                                                                                            CMC, 2021, vol.69, no.2

network. The issues principally include the interaction between wireless structures (Bluetooth),
radio frequency identification, wireless sensor networks utilizing IEEE 802.15.4, WiMAX (that is,
IEEE 802.16), and Wi-Fi/IEEE 802.11, compatibility with current hardware–software elements,
privacy, and connectivity efficiency. Each of these specifications was recently proposed by HART
to describe a particular framework as a component of the HART Field Communication Protocol
Revision 7. The latest standard, which is known as WirelessHART, aims to provide commercial
solutions via wireless mesh networks comprising node classes [17]. ISA100.11 version one is an
open platform accepted by the ISA100 protocol board in 2009. This model emphasizes the delivery
of a range of automation and process control facilities.
     The fundamental purpose is to maintain information sharing with other contact networks,
compliance with current hardware and software networks, energy efficiency, durability, and stabil-
ity. The specification provides a collection of rules and procedures for controlling a non-sensitive
and essential process, including manufacturing and management structures, such as the supervisory
control and data acquisition system. LoRa, which means long range, is classified as a low-power
wide-area network system. Spread spectrum modulation, which is derived from the chirp spread
spectrum system, is the foundation of the LoRa [18]. The LoRa wide area network was developed
on the basis of energy optimization because batteries power most of the nodes in the system.
Tab. 1 presents a summary of previously executed water quality measurement campaigns.

                      Table 1: Summary of water quality measurement campaigns
Authors   Findings                                                                Limitations
[19]      Their prototype calibrated the turbidity sensor and highlighted         The high cost of the available commercial
          the variation between algae species and sediments.                      turbidity meters and sensors could not
                                                                                  distinguish between sedimentary and
                                                                                  phytoplanktonic turbidity
[20]      After implementing the smartphone-based pH meter around                 The system was only implemented for a
          Sydney, they discovered that the recovered values were in               day, and certain areas of concern were
          agreement with the results that were made public by the                 not tested
          authorities
[21]      The researchers implemented a water quality system that                 The accuracies of the neural network and
          measures the water quality in real-time and controls the water          the k-nearest neighbor were 86% and
          flow using an Android device. They utilized four machine                76%, respectively, which are insufficiently
          languages in the process: support vector machine, k-nearest             high.
          neighbor, neural network, and deep learning.
[22]      The designed sensor could obtain decent/reliable values and             The smartphone used had sensitivity
          provide available data for processing in a monitoring laboratory        issues because the images taken were
          via a mobile network system.                                            almost blurred.
[23]      The system was successfully implemented with the GSM with low           Limited sensor parameters for testing.
          cost and high flexibility. That is to say, the system was economical,
          and the components can easily be replaced/reconfigured.
[24]      The first one deployed showed that the water is within the safety       Low power supply in rural areas, the
          range. When the second device was implemented, the pH value             unreliability of network connection, and
          was discovered below the Environmental Protection Guideline             underemployment (under education)
          (EPA), that is, below 6.5.                                              considering the users of the ICT system
[25]      Design and implementation of a water quality smartphone-based           High power consumption and was solved
          system. The creation of a smartphone application capable of             by connecting the water monitoring
          sensor calibration and data collection based on location.               system to a solar panel

                                                                                                              (Continued)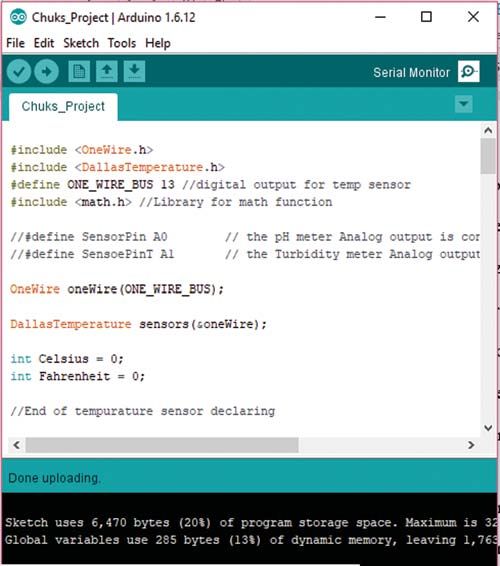
CMC, 2021, vol.69, no.2                                                                                             2409

                                                Table 1: (Continued)
Authors   Findings                                                             Limitations
[26]      Three different ways to resolve the issue of inefficiency in water   The sensor nodes placed underground
          quality monitoring; includes water quality, water level, and pipe    experience low radio frequency
          leakage monitoring                                                   transmission due to the underground
                                                                               environment.
[27]      The pH, turbidity, and temperature parameters are suitable for       The system suffers from manual
          the system to derive the water quality.                              calibration of pH and turbidity sensors
                                                                               after prolonged use.
[28]      The measurements were taken at a depth of one foot below the         Standards for water quality monitoring
          water surface. pH varied along with the various locations due to a   were not yet established, leading to a new
          change in CO2 or temperature. Conductivity was low in the creeks     search for standard values for the various
          but high in river waters. Oxidation–reduction potential was also     parameters.
          low in the creek but read high values when tested in tap water.
[29]      With the system, the pH sensor can measure values from 0–14,         The system was calibrated manually,
          the temperature sensor measures from −15◦ C to 125◦ C, and the       which effectively reduced system accuracy.
          TDS sensor measures the total dissolved solids. The values
          obtained from the raspberry pi are sent by the processor to the
          ThingSpeak platform for analysis.
[30]      Along with a Wi-Fi module that allows the uploading of sensor        The temperature sensor used in this
          data to the cloud, the system conducts its function without          system is the LM35, which is not
          harming the environment surrounding the water or the water           waterproof and is thus only used as a test
          itself.                                                              component and not for actual water
                                                                               temperature measurement.
[31]      A detailed experiment must be conducted on the proposed system       Limitation of budget required for project
          before its deployment on water sources with various qualities.       advancement.
[32]      With the water quality system, researchers discerned that murky      The design of a system that automatically
          and clear water have high and low turbidity, respectively. The       enhances the quality of water has not
          conductivity also increases with the combustible gas in the test     been accomplished
          water.
[33]      The water quality of a lake was measured using GSM protocol          The major limitation of this work is that
          and some analog water quality sensor                                 the sensors deployed were analog and
                                                                               expensive. The work suffered from
                                                                               unreliable GSM wireless link
[34]      Raspberry pi along with machine learning was utilized in             NA
          conducting intelligent analysis on the quality of the different
          water used for the test (mud, tap, salt, and drinking water)

3 Materials and Methods
    This section describes an IoT-based water quality monitoring system comprising hardware
components and software platforms. Some of the tasks performed include design specification,
design concept and materials, and method.

3.1 Design Specification
    The water quality monitoring system comprises five different sections/parts, as indicated in
Tab. 2. The first section is the power supply unit comprised an AC adapter, which supplies 5 V
power to the entire system. The second section comprised the microcontroller unit, specifically
ATmega328p Microcontroller. The third module is the sensing unit, which comprised the temper-
ature, pH, and turbidity sensors. The fourth is the communication module (Bluetooth Module)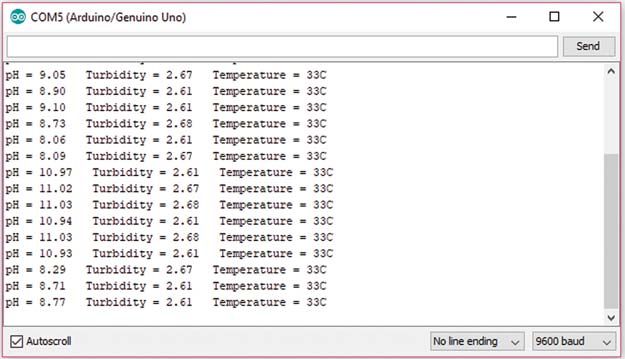
2410                                                                            CMC, 2021, vol.69, no.2

used to transfer data from the microcontroller unit to the Android device. The fifth and sixth
sections of this project will be the Android device equipped with an Android app (explicitly built
for this project).

                                     Table 2: Design components
S/N     Units                   Components
1       Control unit            ATmega328p microcontroller Arduino Uno
2       Communication unit      Bluetooth module
3       Sensing unit            Temperature, pH, and turbidity sensors
4       Software requirement    Windows OS, Arduino IDE, MIT app inventor, ThinkSpeak IoT platform
5       Power supply unit       AC adapter

3.2 Design Concept and Flowchart
    As illustrated by the flow chart diagram in Fig. 2, the sensors take their reading (data) from
the test water. The data from the pH and turbidity sensors are in an analog form, which is incom-
patible with the Arduino microcontroller. Therefore, these data are converted into digital values
by the microcontroller. The Bluetooth module is then initialized to facilitate the connection of an
Android device. The sensor data obtained from the sensor are then transferred to the Android
device when the Android device is paired with the Bluetooth module and will be displayed by the
Android application built for this project.
      The design concept is summarized as follows.
      (i) A DC jack would supply power to the system after power conversion. The DC jack is
          connected to the microcontroller unit, which controls the sub-units.
     (ii) The DS18B20 temperature sensor is designed to measure the water temperature while the
          turbidity sensor analyzes the water quality. The analog pH sensor is precisely built to detect
          the acidity or alkalinity of a solution.
    (iii) A programmed Arduino Uno microcontroller is the brain of the system that conducts the
          necessary mathematical operations regarding the comparison of the received analog signals
          from the sensors and the pre-set value. This microcontroller also synchronizes tasks relating
          to other components in the system.
    (iv) The HC-05 Bluetooth module is used as the gateway to allow the Arduino Uno micro-
          controller to interact with the MIT App Inventor (which is a web application integrated
          development environment for Android and IOS).
     (v) The water quality results will be displayed on Samsung Galaxy A8.0 using the developed
          mobile app powered by the MIT App Inventor.

3.3 Hardware Design
     The water quality monitoring system design is divided into two interdependent sections: the
software and the hardware. This section briefly describes the hardware design of the system. The
following hardware components were used in the realization of this project.

3.3.1 Atmega328p Microcontroller
     The microcontroller chip ATmega328p comprises 14 digital pins, 6 analog pins, 2 ground pins,
2 VCC pins, 2 crystal inputs 16 MHZ, reset pin, and 28 analog referencing pins. The chip is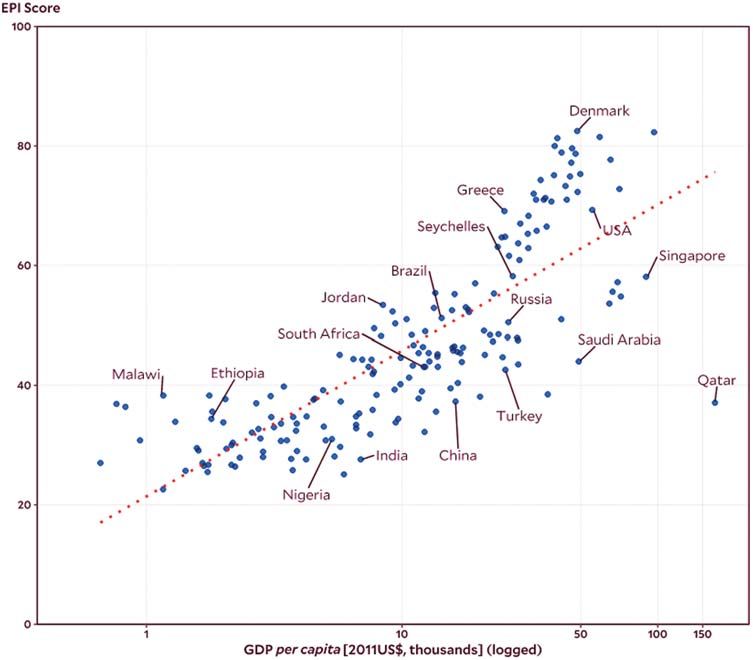
CMC, 2021, vol.69, no.2                                                                      2411

mounted on the Arduino Uno board and programmed with the open-source Arduino (Arduino
IDE) environment and a platform for compiling, uploading, and simulating codes using the
Arduino Uno USB connector to implement the code functionality. The Arduino one needs an
AC/DC adapter or a battery and a reset button in the board that allows the program to be
uploaded onto the microcontroller to restart. The Arduino Uno is designed to control the sensor
data transfer from the sensing circuit to the control board by the ATmega328p microcontroller.
Fig. 3 depicts the Arduino Uno image.

                                                      Start

                                        Sensors obtain data from the water

                          Conversion of analog signals from the sensors to digital signals

                                     Arduino initializes Bluetooth connection

                                 Android device search for the Bluetooth Moodle

                                                Android Device
                                                Finds Bluetooth
                                                    Moodle

                                       Pair/Connect with Bluetooth Moodle

                            Send data obtained from the sensor to Android devices

                            Display water quality data to a user via the Android app

                             User can then monitor the water quality over a period

                                                      End

                                   Figure 2: Flowchart of the project

                             Figure 3: ATmega328p microcontroller [35]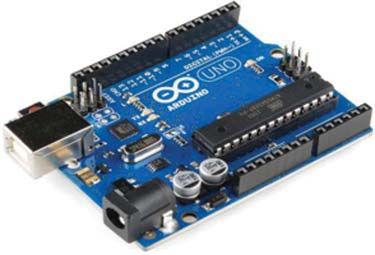
2412                                                                       CMC, 2021, vol.69, no.2

3.3.2 HC-05 Bluetooth Module
     The HC-05 Bluetooth module runs on the serial port profile concept. This module is built
exclusively for serial wireless communication. Moreover, the Bluetooth module is designed for
the 3 Mbps modulation with a complete 2.4 GHz wireless transceiver and baseband Bluetooth
V2.0 + enhanced data rate. The Bluetooth device with CMOS and adaptive frequency hopping
feature is based on CSR Bluecore 04-External single chip. The Bluetooth module has low prices,
reduced power usage, and a high degree of connectivity from a wide distance. The sensitivity of
the Bluetooth module is −80 dBm. This module also uses the UART protocol, which has a baud
rate that can be configured. The baud speed used is typically 36,800, and the data packet normally
comprises 8 bits, 1 stop, and no parity bits. These Bluetooth modules have two modes: master
and slave device. The consumer can customize modes as a master or slave with AT commands
for a device with an odd number, such as HC-05 [36].
    Fig. 4 depicts the Bluetooth module indicating the following six pins [36]:
    (i) The first is the Enable/Key (with a default data mode), which is used to alternate between
        data mode and AT command.
   (ii) The VCC pin, which powers the module with a +5 V voltage supply.
  (iii) Ground pin, which connects the system to the ground
  (iv) TX-Transmitter pin–Transfer Serial data. All data received through Bluetooth are given as
        serial data through this pin.
   (v) RX Receiver–Retrieves serial data. Each serial information given to this pin is transmitted
        via Bluetooth.
  (vi) State pin, which indicates whether the module is or is not connected.

                             Figure 4: HC-05 Bluetooth module [36]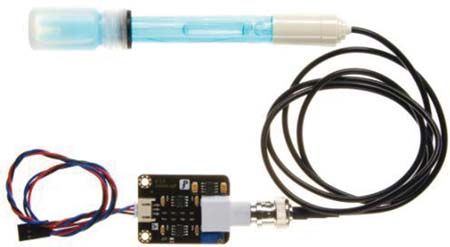
CMC, 2021, vol.69, no.2                                                                      2413

3.3.3 Arduino Uno
     The Arduino Uno board utilizes an ATmega328p chip as shown in Fig. 5. The datasheet is
available on [37]. The microcontroller board comprises 14 digital input and output pins, 6 analog
input pins, and a 16 MHz crystal oscillator, which can be connected to a computer via a USB
connector [35]. The board is controlled via Arduino IDE, which is an open-source environment
where codes are written/compiled and uploaded onto the Arduino Uno microcontroller board
using the USB connection from the cable and the computer. The Arduino Uno board is used to
program the ATmega328p microcontroller [38].

                               Figure 5: Arduino Uno board [38]

3.3.4 DS18B20 Temperature Sensor
     The DS18B20 temperature sensor is a single bus digital temperature sensor shown in Fig. 6.
This sensor interacts with the microprocessor via the single bus port, the temperature range of
the sensor goes from −55◦ C to +125◦ C, and the incremental value is 0.5◦ C. The temperature can
be changed into figures within 720 ms, and each DS18B20 has a distinctive 64-bit serial code,
which then permits various DS18B20s to operate on the same 1-Wire bus. Two 8-bit storages are
available for storing temperature values in the DS18B20: No. 0 and No. 1. No. 0 storage stores
complement the temperature value, and No. 1 stores symbols of the temperature value [39]. Thus,
using one microprocessor to control many DS18B20s distributed over a large area is easy.

                           Figure 6: DS18B20 temperature sensor [39]

3.3.5 Analog Turbidity Sensor
     The turbidity sensor analyzes the water quality by evaluating turbidity rate and opacity as
shown in Fig. 7. The sensor uses light to assess the light absorption and the dispersion intensity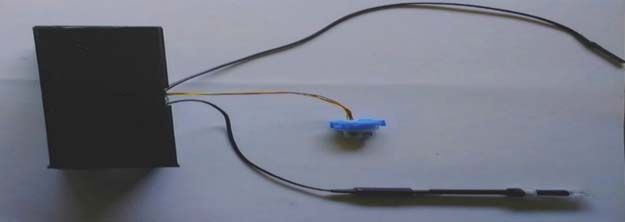
2414                                                                           CMC, 2021, vol.69, no.2

for suspended particles in water, which varies with the amount of total suspended solids in
water [40]. An amplifier board and sensor are included in this sensor system. The module is
attached to Arduino by utilizing only three pins: VCC, GND, and SIGNAL. A light transmitter
and receiver are used in the turbidity sensor. The light dispersion is small in cleansed waters, which
indicates that the light receiver accepts the lightest. The light receiver secures less illumination as
the water turbidity grows. If the received light is under a certain threshold, then the sensor is
triggered. Notably, an “analog to digital/digital to analog” option is found on this amplifier board,
which will move between analog and digital modes. Suppose the goal is only to detect whether
the water is too turbid; thus, the digital mode is utilized. The analog mode must be activated to
measure turbidity levels. The sensor has an operating voltage of 5 V dc, a maximum operating
current of 40 mA, and a response time of less than 500 ms [40].

                               Figure 7: Analog turbidity sensor [40]

3.3.6 Analog pH Sensor
     The analog pH sensor is precisely built to detect the acidity or alkalinity of a solution. The
pH sensor is in the form of a rod-like unit commonly made of glass, with a bulb encompassing
the sensor at the underside, as depicted in Fig. 8. A glass bulb fashioned to be a very detective
of hydrogen-ion concentration is attached to the electrode for pH measurement (which is made
of glass). The positively charged ions on the glass bulb exchange with the test solution hydrogen
ion when the glass electrode is immersed into the solution for analysis, which then creates an
electrochemical potential/potential difference across the bulb. The electronic amplifier measures the
electrical potential difference in the calculation between the pH and reference electrodes and trans-
forms the potential difference into pH units. The magnitude of the glass bulb’s electrochemical
potential is proportional to the pH based on the Nernst equation (measured in millivolts) [35].
Calculating the pH values of different aqueous solutions is easy using this pH sensor.

3.4 Software Design Requirement
     The Arduino microcontroller was programmed with the Arduino Integrated Development
Environment (IDE) while using a Windows operating system. The codes from the Arduino IDE
can be directly uploaded to the Arduino microprocessor using the bootloader in the microcon-
troller. Afterward, the MIT App Inventor, which is a web application IDE for Android and
IOS [41], was used to write the codes in the development of the Android application for this
project.
CMC, 2021, vol.69, no.2 2415
Figure 8: Analog pH sensor
4 Implementation
This section contains a detailed description of the implementation and testing of an IoT-
based water quality monitoring system. The working operation of the project at all levels is
comprehensively explained. The proper functioning of each subunit that comprises the system is
required to meet the stated requirements because a fault in one unit can affect the functionality
of the entire system [42]. This condition is achieved by conducting circuit simulation, hardware
implementation, and software implementation.
4.1 Hardware Implementation
The hardware implementation of this project is divided into the following three stages.
• Circuit simulation.
• Coupling of the components.
• Packaging of the project.
4.1.1 Circuit Simulation
The project was first simulated using Fritzing software as shown in Fig. 9. Fritzing software is
utilized to simulate electronic designs. This simulation is conducted to determine if the project is
bound to function properly after the hardware connection. The simulation highlights the complete
process/behavior of the electronic system during its operation. The simulation of the power supply
components, the control unit (Arduino Uno), the communication unit (Bluetooth module), the
temperature sensor, and the pH and turbidity sensors was achieved using Fritzing software.
4.1.2 Coupling of the Components
The project is a prototype. Thus, a breadboard was utilized in coupling the components
together as illustrated in Fig. 10 to ensure an easily correctable circuit. Each stage of the project
coupling was tested for appropriate and accurate individual functionality. Continuity was also
tested on the breadboard ports to prevent errors.
4.1.3 Low-Cost Water Monitoring Quality Monitoring System Packaging
The packaging of the components/projects was conducted after the proper coupling of com-
ponents as shown in Fig. 11. The project was placed inside a plastic container/case. The case
is designed such that the probes of the temperature, pH, and turbidity sensors were extended
from the plastic case to allow the sensors to take their reading from the test liquid. The Arduino
microcontroller, Bluetooth module, and all the jumper wire connections are placed inside the case.2416 CMC, 2021, vol.69, no.2
An opening was made for the Arduino USB connection for easy reconfiguration. The opening
also extends to the power inlet of the Arduino. The Android device was held by the user.
Figure 9: Pin connection of the entire system (modeled with Fritzing)
Figure 10: Low-cost water monitoring quality monitoring system
Figure 11: Packing of the system with the extended pH, turbidity, and temperature sensorsCMC, 2021, vol.69, no.2 2417
4.2 Software Implementation
Along with the mobile application, the programming of the Arduino microcontroller is dis-
cussed in this section. The project goals and functionality will not be achieved without adequate
software knowledge.
4.2.1 Arduino IDE Programming
The Arduino Uno microcontroller is programmed with the C-Programming language (receive
and store data collected from the sensors) using the Arduino IDE. The programming involved
the declaration of libraries (which were downloaded and added to the IDE) to be utilized by the
sensors and the Bluetooth module, the initialization of pins used in the Arduino microcontroller,
void setup, and void loop (which is compulsory in C-Programming language).
All the codes used to allow the sensors to read their respective data were also included in the
program. The codes were then uploaded to the Arduino microcontroller to ensure compatibility
of the system with the code and allow debugging of possible errors. The Arduino Uno interface
is shown in Fig. 12.
Figure 12: Arduino IDE interface showing some codes
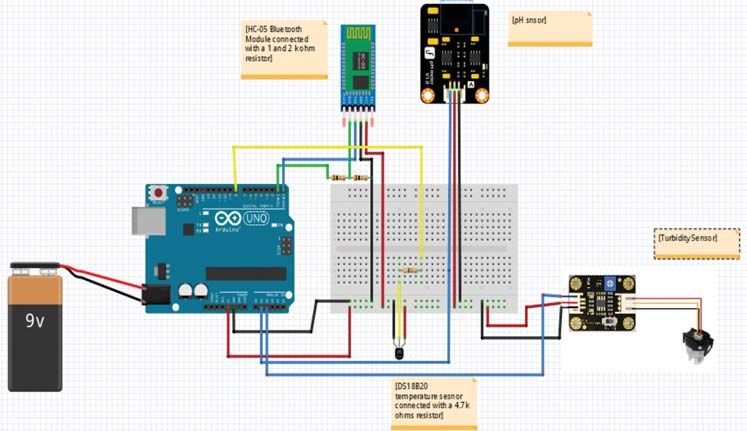
4.2.2 Android Application Programming
This programming involves the development of the Android application, which receives data
from the three sensor readings via the Bluetooth module. The application was designed using the
MIT APP inventor. The user interface design layout and the backend interface of the MIT App
inventor are respectively shown in Figs. 13 and 14.2418 CMC, 2021, vol.69, no.2
Figure 13: User interface design layout of the MIT app inventor
Figure 14: MIT app inventor backend interface
The MIT App inventor uses a block-based programming language to develop apps for
Android devices. The design of the user interface and the backend of the application was
developed using the MIT App inventor block-based programming language. The application was
also developed such that the values for each of the read sensors are displayed in a “textbox”CMC, 2021, vol.69, no.2 2419
when the sensors take their reading and transfer it through Bluetooth to the Android device.
A graph is implemented in the application. This graph is used to illustrate the relations between
the monitoring time and the parameters measured by the sensors. The graph will be discussed in
the next section.
5 Results and Discussions
Results and discussions are some of the most critical aspects in the design and implementation
of the project. Five different tests were conducted in this project to ensure that the proposed
system meets the requirements. The power supply was tested before its implementation in the
project to ensure an output voltage of 5 V. The testing of the power supply was also performed
to avoid damages to components due to high voltage and ensure sufficient power supply for
the proper functioning of the various components. The pH sensor was tested to determine the
acquisition of accurate values. This sensor was tested using a soap solution (which is basic),
water (neutral), and lemon juice (acidic). The pH sensor was recalibrated after testing to read
the correct values. The temperature sensor was also tested to determine its capability to read the
hotness and coldness of the water. The turbidity sensor was also then tested with clear water and
water solution filled with dust and sand to ensure the reading of accurate values. Some of the
selected reading is shown in Fig. 15. As previously stated, the Bluetooth module in this project
was implemented to ensure the passage of data to the Android application through the Bluetooth
connection. This module was tested to determine if the pH, temperature, and turbidity values
were received by the mobile application using a Bluetooth connection.
Figure 15: Sensors reading interface
After the mobile app was developed with MIT App Inventor, it was then installed into the
Android device. The application was tested to determine if all the sensor values are received
and inform the user if the water solution in question was suitable for drinking. The Android2420 CMC, 2021, vol.69, no.2
device used in conducting this project is a Samsung Galaxy A8.0 as shown in Figs. 16a–16c. The
project was subjected to the power supply. The temperature, pH, and turbidity sensors were then
inserted into a water sample to determine the extraction, transfer, and display of the values for the
temperature, pH, and turbidity parameters by the Android application via a Bluetooth connection.
(a) (b) (c)
Figure 16: (a) Project app interface (not connected to the Bluetooth module) (b) Project app
attempting to connect with the HC-05 Bluetooth modules (c) Project app connected to the HC_05
and taking reading from the sensors
The entire project system was tested as shown in Figs. 17a–17c to finalize the functionality
of the project.
(a)CMC, 2021, vol.69, no.2 2421
(b)
(c)
Figure 17: (a) Temperature measurement of tap water via DS18B20 temperature sensor for six
hours (b) Graph showing pH measurement of tap water via pH sensor of for six hours
(c) Turbidity measurement of tap water via pH sensor of for six hours
6 Conclusions
Water is one of the needs with considerable significance to man and other living things.
However, this project reveals that a large amount of water remains unmonitored and polluted.
This project attempts to address the question of utilizing WSN as a water quality monitoring
system. Based on the aforementioned literature in this project, IoT has been proven to be a
reliable method of monitoring and measuring water quality via the utilization of various water
property sensors. This form of monitoring is flexible and economical because sensors could easily
be replaced along with the required changes in the software to draw data of other parameters
in water. The sensors can measure the various required parameters and send the data to the
receiving/monitoring device or center through the implementation of real-time monitoring systems.
Concerns related to the daily impact on human health and the environment are increasing due
to the rise in mortality rate caused by the emission of gaseous and particulate pollutants from
machines and industries. Therefore, monitoring air quality and creating public awareness is crucial
for a safe future. Therefore, the future work aims to design a real-time IoT low-cost air quality
monitoring system. The system utilizes air quality and carbon monoxide sensors for monitoring
gaseous pollutants. Moreover, the system utilizes an Arduino Nano development board equipped
with a Wi-Fi module to send readings to a ThingSpeak channel platform effectively.2422 CMC, 2021, vol.69, no.2
Funding Statement: This work was supported by SUT Research and Development Funds and by
Thailand Science Research and Innovation (TSRI). Also, this work was supported by the Dean-
ship of Scientific Research at Prince Sattam bin Abdulaziz University, Saudi Arabia. In addition,
support by the Taif University Researchers Supporting Project number (TURSP-2020/77), Taif
University, Taif, Saudi Arabia.
Conflicts of Interest: The authors declare that they have no conflicts of interest to report regarding
the present study.
References
[1] C. Zhao, S. Yang, J. Liu, C. Liua, F. Hao et al., “Linking fish tolerance to water quality criteria for
the assessment of environmental flows: A practical method for streamflow regulation and pollution
control,” Water Research, vol. 141, no. 5, pp. 96–108, 2019.
[2] H. Wasana, G. Perera, P. Gunawardena, P. Fernando and J. Bandara, “WHO water quality standards
vs. synergic effect(s) of fluoride, heavy metals and hardness in drinking water on kidney tissues,”
Scientific Reports, vol. 7, no. 3, pp. 40–62, 2017.
[3] K. Adu-Manu, C. Tapparello, W. Heinzelman, F. Katsriku and J. Abdulai, “Water quality monitoring
using wireless sensor networks: Current trends and future research directions,” ACM Transactions on
Sensor Networks, vol. 13, no. 1, pp. 11–41, 2017.
[4] T. Toivanen, S. Koponen, V. Kotovirta, M. Molinier and P. Chengyuan, “Water quality analysis using
an inexpensive device and a mobile phone,” Springer Open, vol. 2, no. 1, pp. 1–6, 2013.
[5] M. A. Khan and A. M. Ghouri, “Environmental pollution: Its effects on life and its remedies,” Science
and Commerce, vol. 2, no. 2, pp. 276–285, 2011.
[6] N. Witulski and J. Dias, “The sustainable society index: Its reliability and validity,” Ecological
Indicators, vol. 114, no. 2, pp. 245–264, 2020.
[7] M. Pule, A. Yahya and J. Chuma, “Wireless sensor networks: A survey on monitoring water quality,”
Journal of Applied Research and Technology, vol. 15, no. 6, pp. 562–570, 2017.
[8] K. Gafurov and T. Chung, “Comprehensive survey on internet of things, architecture, security aspects,
applications, related technologies, economic perspective, and future directions,” Journal of Information
Processing Systems, vol. 15, no. 4, pp. 797–819, 2019.
[9] J. Fu, Y. Liu, H.-C. Chao, B. K. Bhargava and Z.-J. Zhang, “Secure data storage and searching for
industrial IoT by integrating fog computing and cloud computing,” IEEE Transactions on Industrial
Informatics, vol. 14, no. 10, pp. 4519–4528, 2018.
[10] S. P. Gochhayat, C. Lal, L. Sharma, D. P. Sharma, D. Gupta et al., “Reliable and secure data transfer
in IoT networks,” Wireless Networks, vol. 26, no. 5, pp. 1–14, 2019.
[11] W. Khan, M. Rehman, H. Zangoti, M. Afzal, N. Armi et al., “Industrial internet of things: Recent
advances, enabling technologies and open challenges,” Computers and Electrical Engineering, vol. 81,
no. 5, pp. 106522–106542, 2020.
[12] M. Abu-Elkheir, M. Hayajneh and N. A. Ali, “Data management for the internet of things: Design
primitives and solution,” Sensors, vol. 13, no. 11, pp. 15582–15612, 2013.
[13] M. Rehman, E. Ahmed, I. Yaqoob, I. Hashem, M. Imran et al., “Big data analytics in industrial IoT
using a concentric computing model,” IEEE Communications Magazine, vol. 56, no. 2, pp. 37–43, 2018.
[14] K. Jones, “Voice-activated change: Marketing in the age of artificial intelligence and virtual assistants,”
Journal of Brand Strategy, vol. 7, no. 3, pp. 233–245, 2018.
[15] M. Raza, N. Aslam, H. Le-Minh, S. Hussain, Y. Cao et al., “A critical analysis of research potential,
challenges, and future directives in industrial wireless sensor networks,” IEEE Communications Surveys
and Tutorials, vol. 20, no. 1, pp. 39–95, 2018.
[16] D. Queiroz, M. Alencar, R. Gomes, I. Fonseca and C. Benavente-Pecesa, “Survey and systematic
mapping of industrial wireless sensor networks,” Journal of Network and Computer Applications, vol. 97,
no. 5, pp. 96–125, 2017.CMC, 2021, vol.69, no.2 2423
[17] G. Yang, L. Dai, G. Si, Sh. Wang and S. Wang, “Challenges and security issues in underwater wireless
sensor networks,” Procedia Computer Science, vol. 147, no. 2, pp. 210–216, 2019.
[18] M. Chiani and T. J. Elzanaty, “On the LoRa modulation for IoT: Waveform properties and spectral
analysis,” IEEE Internet of Things Journal, vol. 6, no. 5, pp. 8463–8470, 2019.
[19] L. Parra, J. Rocher, J. Escrivá and J. J. Lloret, “Design and development of low cost smart turbidity
sensor for water quality monitoring in fish farms,” Aquacultural Engineering, vol. 81, no. 5, pp. 10–
18, 2018.
[20] Y. Fan, J. Li, Y. Guo, L. Xie and G. Zhang, “Digital image colorimetry on smartphone for chemical
analysis: A review,” Measurement, vol. 171, no. 3, pp. 108829–108840, 2021.
[21] P. Pujar, H. Kenchannavar, R. Kulkarni and U. Kulkarni, “Survey and systematic mapping of
industrial wireless sensor networks,” Applied Water Science, vol. 10, no. 2, pp. 102–123, 2020.
[22] S. Dutta, D. Sarma and P. J. Nath, “Ground and river water quality monitoring using a smartphone-
based pH sensor,” AIP Advances, vol. 5, no. 5, pp. 151–164, 2015.
[23] K. Patil, S. Patil, S. Patil and V. J. Patil, “Monitoring of turbidity, pH and temperature of water
based on GSM,” International Journal For Research In Emerging Science And Technology, vol. 2, no. 3,
pp. 16–21, 2015.
[24] A. Oliveira-Jr, C. Resende, A. Pereira, P. Madureira, J. Gonçalves et al., “IoT sensing platform as a
driver for digital farming in rural Africa,” Sensors, vol. 20, no. 12, pp. 3511–3525, 2020.
[25] S. Srivastava, S. Vaddadi and S. J. A. W. S. Sadistap, “Smartphone-based system for water quality
analysis,” Applied Water Science, vol. 8, no. 5, pp. 1–13, 2018.
[26] M. T. Deepiga and A. J. Sivasankari, “Smart water monitoring system using wireless sensor network
at home/office,” International Research Journal of Engineering and Technology, vol. 2, no. 4, pp. 1305–
1314, 2015.
[27] B. Sigdel, “Water quality measuring station: PH, turbidity and temperature measurement,” Theses,
vol. 2, no. 4, pp. 1105–1114, 2017.
[28] K. Mamun, F. R. Islam, R. Haque and M. G. M. Khan et al., “Smart water quality monitoring system
design and KPIs analysis: Case sites of Fiji surface water,” Sustainability, vol. 11, no. 24, pp. 7110–
7121, 2019.
[29] T. Anuradha, C. R. Bhakti and D. T. Pooja, “IoT based low cost system for monitoring of water
quality in real time,” International Research Journal of Engineering and Technology, vol. 5, no. 5,
pp. 1658–1663, 2018.
[30] K. Spandana and V. E. Rao, “Internet of things (IoT) based smart water quality monitoring system,”
International Journal of Engineering and Technology, vol. 7, no. 3.6, pp. 259–262, 2018.
[31] M. S. U. Chowdury, T. B. Emran, S. Ghosh, A. Pathak, M. Alam et al., “IoT based real-time river
water quality monitoring system,” Procedia Computer Science, vol. 155, no. 5, pp. 161–168, 2019.
[32] M. J. V. Kumar and K. R. T. Samalla, “Design and development of water quality monitoring system
in IoT,” International Journal of Recent Technology and Engineering, vol. 7, no. 3, pp. 527–533, 2019.
[33] E. Rastogi, N. Saxena, A. Roy and D. Shin, “Narrowband internet of things: A comprehensive study,”
Computer Networks, vol. 173, no. 4, pp. 107209–107229, 2020.
[34] S. Pappu, P. Vudatha, A. Niharika, T. Karthick and S. Sankaranarayanan, “Intelligent IoT based
water quality monitoring system,” International Journal of Applied Engineering Research, vol. 12, no. 16,
pp. 5447–5454, 2017.
[35] B. Lahfaoui, S. Zouggar, B. Mohammed and M. Elhafyani, “Real time study of P&O MPPT control
for small wind PMSG turbine systems using arduino microcontroller,” Energy Procedia, vol. 111, no. 3,
pp. 1000–1009, 2017.
[36] A. Chawla, T. Bangera, C. Kolwalkar and M. T. Bhat, “Bluetooth based weather station,” International
Journal of Technology and Engineering, vol. 28, no. 2, pp. 5454–5464, 2015.
[37] R. Vagulabranan, M. Karthikeyan and V. E. Sasikala, “Automatic irrigation system on sensing soil
moisture content,” International Research Journal of Engineering and Technology, vol. 3, no. 3, pp. 206–
208, 2016.2424 CMC, 2021, vol.69, no.2
[38] S. F. Barrett, “Arduino microcontroller processing for everyone,” Synthesis Lectures on Digital Circuits
and Systems, vol. 8, no. 4, pp. 501–513, 2013.
[39] C. Zhang, K. Xu, L. Li, M. Yang, H. Gao et al., “Study on a battery thermal management system
based on a thermoelectric effect,” Energies, vol. 11, no. 2, pp. 279–300, 2018.
[40] A. P. U. Siahaan, S. Aryza and M. D. T. P. Nasution, “Arduino Uno-based water turbidity meter using
LDR and LED sensors,” International Journal of Engineering and Technology, vol. 7, no. 4, pp. 1–5, 2018.
[41] K. Yahya, M. Bilgin and T. Erfidan, “Practical implementation of maximum power tracking based
short-current pulse method for thermoelectric generators systems,” Journal of Power Electronics, vol. 18,
no. 4, pp. 1201–1210, 2018.
[42] N. Iqteit and K. Yahya, “Simulink model of transformer differential protection using phase angle
difference based algorithm,” International Journal of Power Electronics and Drive System, vol. 11, no. 2,
pp. 1088–1098, 2020.You can also read