Classification of apatite structures via topological data analysis: a framework for a 'Materials Barcode' representation of structure maps
←
→
Page content transcription
If your browser does not render page correctly, please read the page content below
www.nature.com/scientificreports

                OPEN              Classification of apatite structures
                                  via topological data analysis:
                                  a framework for a ‘Materials
                                  Barcode’ representation
                                  of structure maps
                                  Scott Broderick, Ruhil Dongol, Tianmu Zhang & Krishna Rajan*

                                  This paper introduces the use of topological data analysis (TDA) as an unsupervised machine learning
                                  tool to uncover classification criteria in complex inorganic crystal chemistries. Using the apatite
                                  chemistry as a template, we track through the use of persistent homology the topological connectivity
                                  of input crystal chemistry descriptors on defining similarity between different stoichiometries of
                                  apatites. It is shown that TDA automatically identifies a hierarchical classification scheme within
                                  apatites based on the commonality of the number of discrete coordination polyhedra that constitute
                                  the structural building units common among the compounds. This information is presented in the form
                                  of a visualization scheme of a barcode of homology classifications, where the persistence of similarity
                                  between compounds is tracked. Unlike traditional perspectives of structure maps, this new “Materials
                                  Barcode” schema serves as an automated exploratory machine learning tool that can uncover
                                  structural associations from crystal chemistry databases, as well as to achieve a more nuanced insight
                                  into what defines similarity among homologous compounds.

                                  One of the classic questions in materials crystal chemistry is: why do atoms arrange themselves in the way they
                                  do? To address this challenge, the concept of phase homologies has been widely used. Homologous series of
                                  compounds are those that seem chemically diverse but appear capable of producing each chemical member in a
                                  stoichiometric relationship in a unique crystal structure “type”. In this context, the use of classification maps that
                                  partition different genres of chemistry for different structural arrangements is a foundational tool in chemical
                                  crystallography and the evolution of structure maps, especially in inorganic structures. Structure mapping has
                                  played an important role as an a priori guide for finding stable phases 1 and serving as a visualization tool for
                                  structure–property relationships in a bivariate way. Physical factors governing stable crystal structures serve as
                                  the coordinates of structure maps.
                                      After physical factors are carefully chosen, each compound can be spatially identified by its structure type.
                                  From an informatics perspective, a structure map is a classification tool whereby, through the choice of appro-
                                  priate coordinates, one can map clustering of crystal-structure-related data. There is, of course, a long and rich
                                  history of such maps including Mooser–Pearson plots 2, Philips and van Vechten diagrams 3,4 Goldschmidt
                                  diagrams 5 and Pettifor plots 1, just to mention a few examples. Each of these mapping schemes identifies some
                                  key parameters related to electronic or crystal structure information which is usually placed on orthogonal axes
                                  and the occurrence of a given crystal chemistry is then plotted accordingly. The resulting diagram maps out the
                                  relative position of structure types from which one tries to discern qualitatively if there are strong associations of
                                  certain crystal types to certain bivariate combinations of parameters. The key of course in developing or selecting
                                  the appropriate framework of descriptors or combinations of descriptors is to capture both the key bonding and
                                  crystallographic metrics that would permit classification. Rather than relying solely on heuristics or phenom-
                                  enological observations, our group and others have utilized data driven methods to create the framework for
                                  creating structure maps 6–8. This process then extracts the dominant metrics among the attributes.
                                      We provide an alternate data driven approach of objectively classifying datasets using concepts from alge-
                                  braic topology, namely, persistent homology 9–15. Topology is inherently a classification system that deals with

                                  Department of Materials Design and Innovation, University at Buffalo, 120 Bonner Hall, Buffalo, NY 14260‑5030,
                                  USA. *email: krajan3@buffalo.edu

Scientific Reports |   (2021) 11:11599                | https://doi.org/10.1038/s41598-021-90070-4                                                    1

                                                                                                                                                 Vol.:(0123456789)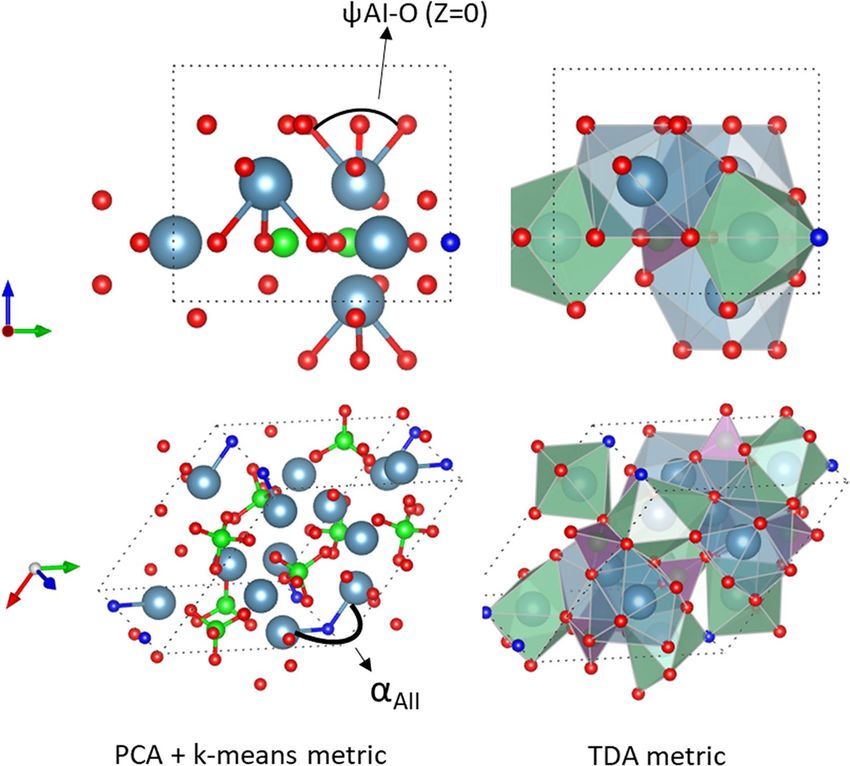
www.nature.com/scientificreports/
Descriptor Description
1 a Lattice constant
2 c Lattice constant
3 c/a variable axial ratio
4 rAI Shannon’s ionic radii of AI-site ion
5 rAII Shannon’s ionic radii of AII site
6 rB Shannon’s ionic radii of B-site ion
7 rX Shannon’s ionic radii of X-site ion
8 Av CR Average crystal radius
9 AEN–OEN Electronegativity difference between A and O atoms
10 BEN–OEN Electronegativity difference between B and O atoms
11 AEN–XEN Electronegativity difference between A and X atoms
12 AEN–BEN Electronegativity difference between A and B atoms
13 ψAI–O Bond angle of AI–O1 bond
(Z=0)
14 ψAI–O Bond angle of AI–O1 bond for z = 0 at AI
15 δAI Counter-rotation angle of AIO6 unit
16 ϕAI Metaprism twist angle
17 αAI Orientation of AIO6 unit
18 < τO–B–O > Average O–B–O bond-bending angle
19 ρAII AII–AII triangular side length
20 αAII Orientation of AII–AII–AII triangle
21 ϕO3–AII–O3 O3–AII–O3 angle
22 AI–O1 Distance between AI and O1 atoms
23 AI–O1 (z=0) Distance between AI and O1 atoms, for z = 0 at AI
24 ΔAI–O I–O1 and AI–O2 bond lengths
Difference in A
25 ΔAI–O(z=0) I–O1 and AI–O2 bond lengths for z = 0
Difference in A
26 < B–O > Average B–O bond length
27 AII–X Distance between AII and X atom
28 AII–O3 Distance between AII and O3 atom
29 Etotal Total energy from DFT
Table 1. Descriptor set for apatite systems, with the corresponding descriptions. We have defined a descriptor
set encompassing atoms, bonds, and crystallographic measures of the apatite structure. The descriptors are
from the geometrical parameterization scheme of Mercier et al. 18,19, as well as descriptors from Shannon 20 and
Pauling 21. In that work, they quantified the bond distortions based on algebraically independent bond lengths
and angles. From this data, we want to track the relationship between geometrical parameters and structure.
qualitative geometric information and we propose to demonstrate in this study the value of using such a machine
learning approach to uncover fundamental insights into the role of coordination environments in complex crystal
chemistries in a completely unsupervised learning process. The objective of this work is to demonstrate how by
exploring different machine learning methods we can gain insight into the underlying features of apatite crystal
chemistry classification, which is a topic of great study especially in the field of chemical crystallography and
geochemistry (where apatite structures are most discussed). Our work shows how machine learning methods
provide another lever in the toolkit of interpretation that has traditionally used heuristic and phenomenological
analysis to generate hypotheses on classification criteria in complex chemical systems.
Computational details
Data input. For this paper, we will build upon our earlier work on the apatite family of crystal structures 16.
The apatite crystal structure has the general formula of A5(BO4)3X, with A representing crystallographic sites
typically accommodating large cations, B accommodating smaller cations, and X occupied by anions. From this
structure, we can identify a series of descriptors related to size effects, bond lengths, crystallographic angles and
charge effects (Table 1). As the input descriptors have differing units, the data was first normalized so that the
data is not sensitive to the unit chosen. The data was first mean centered and then the values were divided by the
standard deviation for each descriptor. This provides data in the same format as our prior work so that we can
compare and contrast the results from each. In that prior work, we identified classifiers based on specific bond
angular distortions through Principal Component Analysis (PCA) to identify a pair of the strongest variables of
importance. They were found to be useful to see classifications based on the stoichiometry of site occupancy in
the apatite family of structures. However, the clustering boundaries did not necessarily work for all of the com-
pounds studied, and in this paper we apply TDA to relax the objective of identifying just a few of the dominant
descriptors. The ‘big data’ perspective of this work refers to the high dimensionality of the data set and not only
Scientific Reports | (2021) 11:11599 | https://doi.org/10.1038/s41598-021-90070-4 2
Vol:.(1234567890)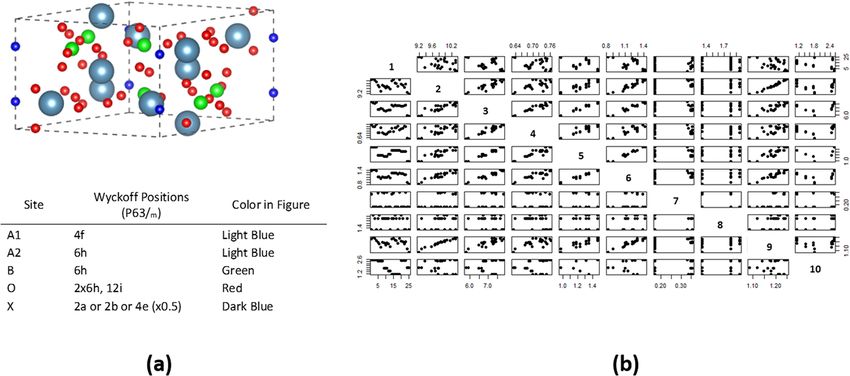
www.nature.com/scientificreports/
Figure 1. (a) The building of the apatite structure ( A5(BO4)3X) starts with the Wyckoff positions. (b) Standard
structure map representation for defining correlations. For clarity, only the relationships of the first 10
descriptors (correlating with the labels in Table 1) are shown.
Descriptors Outcome of analysis References
Unit cell parameters
Structural classification of apatites T.J. White and D. ZhiLi (2003)
Metaprism twist angle
N in A5NB3NO9N+6XNδ
Uncovering polysomatic apatites T. Baikie et al.(2010)
Metaprism twist angle
Distortion angle αAII Classification of apatites—PCA derived selection of mapping descrip-
P.V. Balachandran and K. Rajan (2012)
Distortion angle ΨAI–O1 tors : used for comparison here
A-site radius Defining chemical search space P. Ptáček (2016)
B–O Distance Conductivity for a subset of apatites M.S. Chambers et al. (2019)
Table 2. Prior classifications of apatite or apatite-like (i.e. polysomatic apatites) compounds 16,22–25. These
descriptors represent the crystallographic characteristics of the apatite which have been identified as most
closely determining the property of the compound.
the number of samples. When coupled with the descriptor data set for each sample and inherent uncertainties
in knowing all the complexities associated with chemical bonding, TDA serves as a useful exploratory unsuper-
vised machine learning approach to explore connectivity.
Using persistent homology, algorithmically we can rapidly explore all permutations and combinations of the
connectivity of the descriptors in the context of algebraic topology. Of course, the results of any descriptor-based
input are going to be influenced by the nature of the descriptors. Hence, we are using two different types of data
dimensionality reduction methods using the same descriptor library. The PCA based analysis 16 has provided a
physically interpretable analysis (e.g., site occupancy clustering of most of the compounds). Even when outliers
were found, subsequent analysis using DFT calculations provided an explanation of why those outliers existed
in that PCA projection 17, demonstrating how strong classifiers are of value not only to identify global patterns
but also to identify meaningful outliers. Hence, for this study we are utilizing a descriptor space that has dem-
onstrated its value in physically interpretable analyses.
The apatite structure is shown in Fig. 1, as well as the traditional structure map plotting of the descriptors.
In total for the 29 descriptors, there are 406 total pair-wise structure maps. In this paper, we compress these
various correlations into a single 2D representation, based on the combined correlations of the descriptors. The
challenge in this is that the strong intercorrelations in the data make the extraction of any meaningful design
rule challenging. The general notion of materials similarity may have many facets, and one structure map is
not enough to contain all of the facets. There has been a series of crystallographic parameters which have been
proposed to govern the apatite character and behavior (Table 2). Therefore, a breadth of knowledge and data
exists in the case of apatites, but a unified similarity metric capturing all of these constraints does not exist. In
this paper, a clear classification is developed through the barcode representation, and comparisons with these
prior works are discussed.
Scientific Reports | (2021) 11:11599 | https://doi.org/10.1038/s41598-021-90070-4 3
Vol.:(0123456789)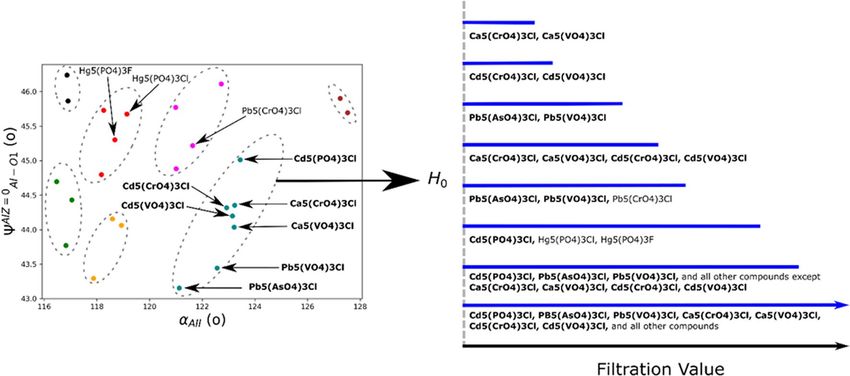
www.nature.com/scientificreports/
Figure 2. (a) The application of the TDA requires input descriptors, such as listed in Table 1, which creates,
(b) the high-dimensional input space point cloud. Each data point in the point cloud representation of the
descriptor space corresponds to an apatite compound. The ‘growing’ disc (highlighted by the green disc centered
at each data point) results in formation of multiple topological features such as connected components. (c)
The evolution of the topological feature is tracked using the barcode representation. The actual barcode for the
apatite dataset is provided in Supplementary Materials.
Persistent homology. Persistent homology (PH) is the most commonly used method in TDA, which cap-
tures topological features in the high-dimensional data, such as connected components, loops, and holes, at
multiple scales. All TDA methods treat high-dimension data as a point cloud 26–31. PH maps a set X of points in
the high-dimensional space associated with a distance function. This mapping is modeled by placing a ε-radius
disc centered at each point in X to form an overlapped space τε(X). Here, τε(X) is defined as the set of all points in
space within the distance ε from a certain point in X. A connection between two data points is established when
the topological space occupied by their discs overlap. The number of connected components in τε(X) is equal to
that of the points in X for a sufficiently small ε, while all of them combine into one component for a sufficiently
large ε. Subsequently, the topological features for a given ε-radius captures information about the shape of data. It
is natural to assume that different topological features are captured at different ε-radius. Hence, the fundamental
idea behind PH is the study the evolution of the topological features in τε(X) as ε increases.
In this work, we are primarily interested in the evolution of connectivity of apatite compounds in the descrip-
tor space defined by Table 1. The geometrical descriptors of apatite compounds define the point cloud, Fig. 2a,b,
where each point corresponds to an apatite compound. The point cloud incorporates the crystallographic and
chemical bonding information. The evolution of connectivity of components is tracked through the overlap of
‘growing’ discs. In the computation routine, the evolution of τε(X) is modeled through a sequence of nested geo-
metrical objects (simplicial complex), which is known as filtration. Here, we implement the Vietoris–Rips com-
plex to define the connected components in the topological space. The evolution of the connected components
can be visualized through a series of connectivity diagrams and compressed in static figure called a ‘barcode’,
Fig. 2c. We provide the definition of connected components and Vietoris–Rips complex in the Supplementary
Material.
Interpreting the material barcode. While there are other approaches to represent similarity in high
dimensional space 32,33, we are using the barcode as a visualization tool to readily see groupings of compounds.
Figure 3 shows a schematic representation of the evolution of the thickening of the point cloud and correspond-
ing barcodes on the four-data point (components) space labeled A, B, C, and D. In the 2D space, the thickening
of the point cloud is represented by the ‘growing’ disc process centered at each data point. The filtration value is
representative of the size (in 2D, radius) of the disc, while the arrow head indicates that the filtration value can
increase to infinity. At any given filtration value, the topological space is the union of all the points in the ‘grow-
ing’ discs and each disc is a subset of this space.
From the algebraic topological perspective, the point-cloud itself is not interesting but the analysis of evolu-
tion of the resulting shape from thickening of the point cloud is of interest. In this work, we focus on the 0th-
dimensional topological features of the PH ( H0), which corresponds to the connectivity of the data points (i.e.
connected components) in the finite parametric space represented by the barcode. The barcode encodes the
evolution of topological features resulting from the thickening of the point cloud. It should be noted that we have
added the results of mapping the H 1 topological features in the Supplementary section. The classification results
provide an assortment of patterns, when compared with the PCA and H0 topological feature maps. For instance,
the bulk of the groupings appear to be most sensitive to the mapping of the phosphate compounds. However,
other classifications include the detection of cluster of compounds that appear in the PCA analysis as part of
a larger cluster of compounds. This does not detract from the focus of our main results but simply emphasizes
how TDA combined with PCA in this case, serves as a powerful data exploratory tool.
Scientific Reports | (2021) 11:11599 | https://doi.org/10.1038/s41598-021-90070-4 4
Vol:.(1234567890)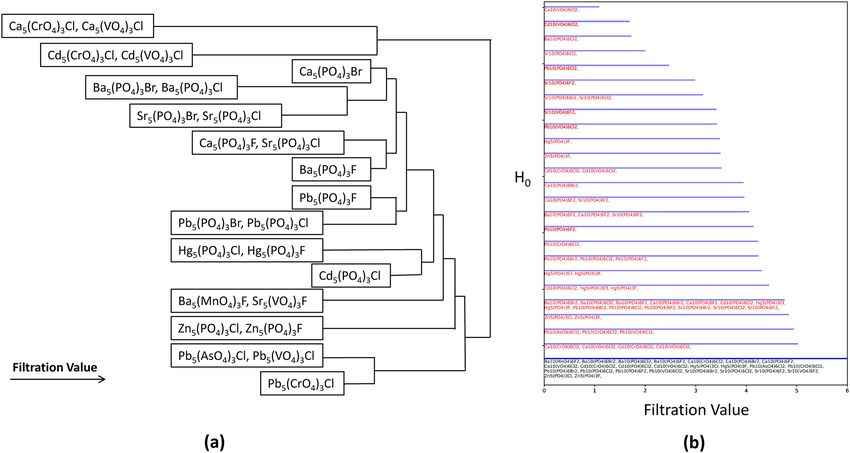
www.nature.com/scientificreports/
Figure 3. In this schematic representation of persistent homology, the topological space is defined by the
four-data points (components) labeled A, B, C, and D in R 2. The barcodes (solid lines) represent the lifetime
of the components, whose length is determined by the filtration value. In this case, the filtration value is the
radius of the ‘growing’ disc centered at each component. A connection between components is established at
the contact point of two ‘growing’ disc. In the barcode, this event is represented by termination of a barcode for
one component and simultaneous representation of the connected component by a single barcode. For example,
in the third image, the discs of components A and B come in contact. This event is represented by termination
of barcode for B, while simultaneously the barcode for A now represents the connected components AB until
component C is connected. The arrow head indicates that the filtration value can increase to infinity.
Initially in Fig. 3, there are four-independent components with the radius of the disc being zero. Each disc
grows independently. A connection between two components is established when two discs centered at different
components come in contact. For example, in the third image of Fig. 3, components A and B form a ‘connected
component’ as their discs’ connect. In the barcode illustration, this event is represented by the termination of
the barcode for B, while simultaneously the barcode for A now represents the connected components AB until
component C is connected. In PH, the onset of a bar is referred to as a ‘birth’ of a feature, while an end-point
of the bar is referred to as the ‘death’ of the feature. In our case, all 0th-dimensional features of the components
have ‘birth’ at zero filtration value. The ‘death’ of feature for B occurs at the third image, C at the fourth image,
and D in the last image. The longest barcode is the most persistent (significant) feature of the point cloud, which
in this case is the connected components.
In the finite parametric space, the radius of a ‘growing’ disc automatically tracks the dynamical aspect of the
proximity of components in the form of a barcode such that length of the bar represents the non-static nature of
the clustering of components. Therefore, the barcode conveys two important information; first, the classification
of components based on the connected components at increasing filtration value. In such a case, it is natural to
assume a stronger association between connected components at lower filtration values. Additionally, connected
components at lower filtration values indicate the notion of higher degree of similarity based on the close proxim-
ity of components. For example, in Fig. 3, component A is far more likely to be similar to B than to D. Second,
the identification of outliers (i.e., unique components) across potentially high-dimensional parametric space.
In this work, we utilize the prior set of information to identify different classes of apatites from the barcodes.
In the application of PH in materials science domain, the finite parametric space is defined by the multiscale
high-dimensional descriptor space. In this study, we use 29-dimenional input descriptor space, which provides a
parametric framework for apatite structure and where each point in this space corresponds to a distinct apatite.
The barcodes allow to define the connectivity of the apatites based on the 29-dimensional input space. More
importantly, the barcode encodes similarity between apatites with high-degree of similarity associated with lower
filtration values. As discussed earlier, different filtration values are used to classify apatites with lower values
carrying higher importance, and therefore are a more critical factor for classification. Based on the concept of
similarity, in this study we demonstrate how topological data analysis serves as an automated exploratory machine
learning tool that can uncover structural associations from crystal chemistry databases, as well as to achieve a
more nuanced insight into what defines similarity among homologous compounds.
Results and discussion
Following the approach described, we generate a barcode using size, bonding, charge, and crystallographic
descriptors. The barcode provides a framework to create a classification of compounds, when the classifiers do
not have any obvious relationships. The similarity metric can be extracted from the barcode by taking snapshots
at various filtration values. In a traditional 2D structure map, the closer two compounds are than the more simi-
lar they are. Generalizing this idea to the snapshots of the barcode, the sooner (i.e. lower filtration value) two
compounds merge (to appear on the same bar), the higher similarity they have. In the extreme, we can think of
Scientific Reports | (2021) 11:11599 | https://doi.org/10.1038/s41598-021-90070-4 5
Vol.:(0123456789)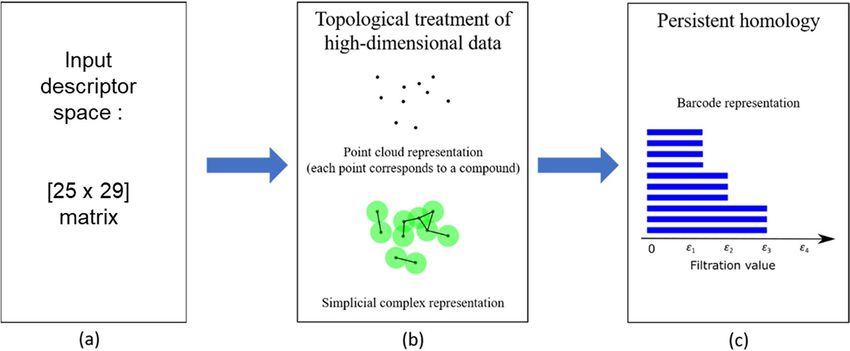
www.nature.com/scientificreports/
Figure 4. (a) The classifications extracted from the TDA derived barcode. As the filtration value increases,
additional relationships picked up by the barcode appear. The similarity of the compounds decreases as the
filtration value at which their relationship appears increases. This allows us to identify not only classifications at
a given criteria but also the degree of similarity within those classifications. (b) The final barcode corresponding
to this dendrogram.
it as two compounds with identical descriptors appear at the same point in a 2D structure map or share the same
bar in a barcode no matter the filtration parameter. This then provides a framework for chemical substitution
with minimal impact on properties, i.e., shorter bars indicate that the compounds on it have more similarity in
their properties.
Using this idea, we can then rank the clustering of compounds, and more importantly the ‘stability’ or persis-
tence and existence of the influence of the input descriptors on the clustering of similarity of compounds. That
is, when compounds merge together onto a bar at a low filtration value, that clustering persists until the final
filtration value. We can then consider that to be a classification of high stability. The stability of the classification
weakens as the initial merging occurs at larger filtration values. This dynamic aspect of the barcode (i.e. that it
evolves with increasing filtration values) separates the approach from traditional clustering algorithms which
provide only a single classification, with no stability ranking. To highlight the “dynamic” aspect of the barcode, a
video of the evolution with increasing filtration value is provided in the Supplementary Material. From the series
of barcodes for all filtration values (including the barcode shown at a single filtration value), we are able to come
up with a ranking of the classification strengths (Fig. 4). The sooner the cluster forms corresponds with stronger
classification or stability of the cluster. For example, the clustering of compounds with A = Ca or Cd, B = Cr or V,
and X = Cl are the most strongly correlated, and the compounds with larger corresponding cluster numbers are
more loosely similar. Conversely, C d5(PO4)3Cl is the most unique compound, as it is the last compound which
merges with any other compounds. The barcode results corresponding with this dendrogram are provided in
the Supplementary Material.
The characterization of the complexities of the connectivity of descriptors defining the clustering of apatite
compounds allows us to define potential chemical substitutions and targeted chemical design. The barcodes were
defined using a descriptor set encompassing both size effects and crystallographic measures. Our prior work
used a combination of PCA and k-means clustering to define the compounds with highest similarity. In that
work, the similarity was defined based on AI–O1 twist angle and orientation of AII bond units. This approach
followed a traditional structure map approach where the key descriptors are identified and serve as the axes,
in order to make the relationships more easily visualized. However, the TDA approach provides an added level
of information by exploring the strength and evolution of the correlations. That is, at each filtration value we
identify correlations and these correlations expand as we increase the filtration value. Therefore, this provides a
dynamic representation of a structure map. The traditional structure map provides a representation of the data
with the assignment of correlations requiring some definition of thresholds. However, in this work, the degree
of correlation is ranked based on the filtration value at which it appears, and therefore this provides a dynamic
representation of the stability of correlations.
Figure 5 shows the different representations, with the barcode evolution shown for the cluster which contained
the most compounds. In this case, the structure map ranks all 7 compounds as having similarity without any
Scientific Reports | (2021) 11:11599 | https://doi.org/10.1038/s41598-021-90070-4 6
Vol:.(1234567890)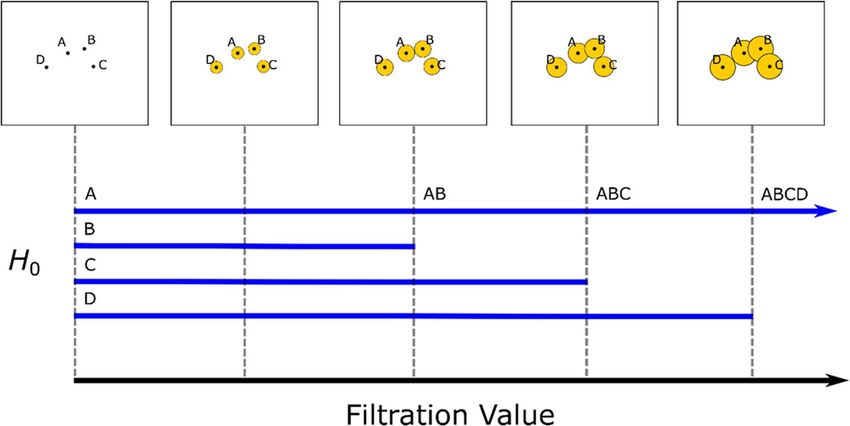
www.nature.com/scientificreports/
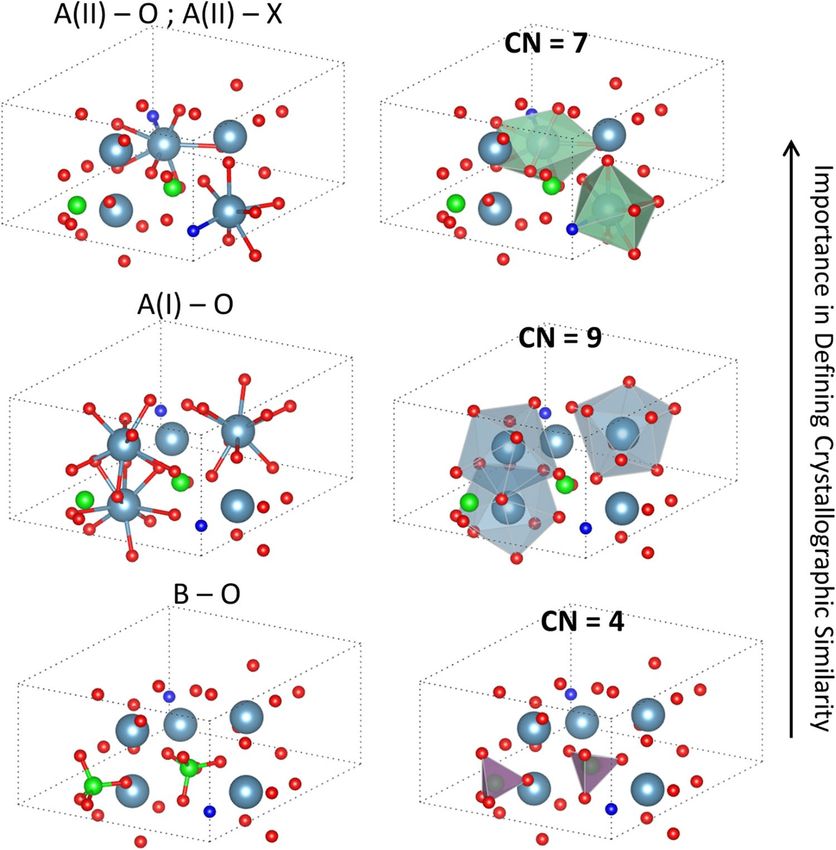
Figure 5. Comparison of the similarities resulting from (left) the combined PCA + k-means approach and
(right) the TDA approach. For demonstration purposes, we focus on one cluster, and have chosen the cluster
which contained the most points. A plot with all points labeled is provided in the Supplementary Material.
From this, we have a ranking of the classification strength, while also identifying some differences (such as
Ca5(PO4)3Cl, Pb5(AsO4)3Cl and Pb5(VO4)3Cl having little similarity with the other compounds in the cluster).
The further interpretation of this plot, as well as for all of the other clusters, is laid out in Table 3.
Comparison to clustering from TDA barcode structure map—
Clusters defined from PCA + k-means structure maps 16 present study
(1) Ca5(Cr,VO4)3Cl, Cd5(Cr,VO4)3Cl, and P b5(As,VO4)3Cl are all
identified as having high similarity even with changing B-site atoms.
The similarity in each case is due to the common A(II)–O and
Cd5(PO4)3Cl, Ca5(CrO4)3Cl, Cd5(CrO4)3Cl, Cd5(VO4)3Cl, A(II)–X bonds. These bonds define the edge of a polyhedron with
Ca5(VO4)3Cl, Pb5(VO4)3Cl, Pb5(AsO4)3Cl CN = 7. (2) Cd5(PO4)3Cl has some similarity with the Pb compounds,
representing the impact of the A(I)–O bonds. The A(I)–O bonds
form a polyhedra with CN = 9, and therefore CN = 9 polyhedra have
lower impact on defining similarity than CN = 7
This cluster captures the B–O bond in the crystal. The B–O bonds
form a polyhedra of CN = 4. The similarity in these compounds
is low compared to the above cluster. This is due to the CN = 4
polyhedra having the least impact in classifying similar chemis-
Ba5(PO4)3F, Ba5(MnO4)3F, Sr5(PO4)3F tries. Ba5(MnO4)3F has particularly little similarity with the other
compounds although A(II)–X bond is the same. This likely reflects
increased distortion in the bond angles caused by Mn. The twist
angles used in the prior study do not take B–O bond angles into
account
These compounds are not identified as being similar. This is due to
Sr5(VO4)3F, Pb5(PO4)3F, Ca5(PO4)3F having different A–O and A(II)–X bonds, and therefore there is no
similarities in the two dominant coordination polyhedra
These compounds are ranked as having high similarity. This is
reflected through the combination of both A(I)–O and B–O bonds.
Ba5(PO4)3Br, Ba5(PO4)3Cl While this does not include the A(II) atoms which corresponds with
the main classifier, these compounds do share two coordination
polyhedra
Sr5(PO4)3X are similar and Hg5(PO4)3X are similar, but they have low
similarity between each other. The similarity is due to the common
Sr5(PO4)3Br, Hg5(PO4)3Cl, Hg5(PO4)3F, Sr5(PO4)3Cl A(I)–O and B–O bonds, thus representing two coordination polyhe-
dra. The Sr and Hg compounds are dissimilar with each other due to
only having common B–O bond, which has the least impact
Table 3. A summary of some of the key new genres of crystal chemistry metrics uncovered by TDA to provide
a higher level of granularity and more insight to define similarity between different apatite chemistries.
further assessment. This shows how TDA provides different levels of ranking, with the bars terminating at lower
filtration values having higher similarity.
Table 3 then compares the results and the interpretation resulting from all seven clusters labeled in the
structure map, with the first row providing the interpretation resulting from Fig. 4. The results summarized in
Table 3 are obtained by integrating the results from the PCA and TDA. As noted earlier, the PCA studies showed
the dominance of X-site occupancy on clustering while also identifying outlier clusters that were governed by
other criteria. The TDA results appear to capture a clustering pattern that seems to be based on coordination
number. We then compared the clustering of compounds that TDA showed which do not fit with the k-means
clustering pattern in the PCA results. These differences directed us as to which features might be common in
Scientific Reports | (2021) 11:11599 | https://doi.org/10.1038/s41598-021-90070-4 7
Vol.:(0123456789)www.nature.com/scientificreports/
Figure 6. The coordination polyhedra constituting the apatite crystal structure. Through the use of TDA
and tracking the changes as the barcode evolves, we have identified these relationships independent of the
prior definition of structures. We find that the initial classification is based on the change in the X atom, i.e.
impacting the coordination associated with A–X bond (CN = 7). Further connections then evolve which capture
the other classifications (first A–O bond with CN = 9 and then B–O bond with CN = 4). The ordering of these
classifications and chemical groupings allowed us to define the new genre of complex compound classification.
The large blue atoms are A-site, the green atoms are B-site, the dark blue atoms are X-site, and the red atoms are
oxygen.
those compounds that appeared clustered. This type of systematic exploration led to the descriptions provided
in Table 3. We used the PCA derived structure map as a starting point as the clustering patterns are based on
a physically interpretable descriptor space. The physical interpretation of the clustering in the TDA barcode is
not so straightforward and hence by leveraging both data dimensionality reduction methods, we are able to get
a more detailed and granular understanding of the design rules underlying the classification of apatites.
From this table and the comparison of two approaches, we can make some critical interpretation of what
is driving similarity. That is, by tracking the change in information, and the underlying causes, compared to a
static representation provides a new series of insights on what constitutes the make-up of a crystal. The main
factor captured in this analysis is the idea of the coordination polyhedra driving the similarity, as opposed to the
PCA + k-means case which was governed by a pair of distortion angles. The three coordination polyhedra which
dictate the TDA ordering are shown in Fig. 6. When compounds have common A and X elements (as is the case
for Ca5(CrO4)3Cl and Ca5(VO4)3Cl, among others), that the A–X bond is the common characteristic. As the
A(II) site is the site relevant for this bond, we can further include A(II)–O within this. Therefore, as shown, at
this point in the barcode, the CN = 7 polyhedra shows up, and as it is the first to show up it is deemed the most
important. This interpretation holds as when grouping on the fourth and fifth bars, the A-sites change but the
X-sites are consistent. Thus, A–X bond is no longer a governing factor, and we can consider the other A–O bonds,
namely corresponding with the A(I) site. Finally, we get classifications with same B-site chemistry, leading to the
CN = 4 polyhedra which has B–O bonds as the edges.
From this, the importance of ranking is due most significantly by the CN = 7 polyhedra, which is made up of
the A(II)–O and A(II)–X bonds. We determine this by finding the strongest criteria for similarity is compounds
Scientific Reports | (2021) 11:11599 | https://doi.org/10.1038/s41598-021-90070-4 8
Vol:.(1234567890)www.nature.com/scientificreports/
Figure 7. Comparison of the features identified as most critical from the prior PCA + k-means approach 16
and the TDA approach described here. In the case of the prior work, critical bonds are identified, while the
TDA approach captures a more complete representation by accounting for the bonds and geometry of the
coordination polyhedra. The bonds are seen to be represented in by the coordination polyhedra, with ψA1–
O1 captured by the CN = 9 polyhedra (blue polyhedra), while αAII shows up in the CN = 7 polyhedra (green).
Neither bond shows up within the CN = 4 polyhedra (purple), indicating that the prior approach did not identify
B site chemistry to have a major impact in defining similarity of chemistries.
with common A(II)–O and A(II)–X bonds. This matches in some degree with the PCA analysis which included
bonds related with the A(II) and X atoms, in addition to the A(I) atoms (Fig. 7). The second significant criteria is
the CN = 9 polyhedra, which are comprised of A(I)–O bonds. Finally, the lowest ranking is for CN = 4 polyhedra
which are comprised of B–O bonds. The twist angles used in the prior study did not take B–O bond angles into
account, and so this is an added piece of information. Interestingly though the structure map selecting two angles
involved a metric associated with the CN = 7 and CN = 9 polyhedra, and thus the two axes are related with the
two most important aspects.
The TDA identified key bond pairs that were common between compounds and when we outlined those
bond pairs, we found that the TDA was identifying the connections that outlined the basic structural building
unit/polyhedra. Since the H 0 topological class is tracking connectivity, it makes mathematical sense but also
demonstrates that although we never input atom positions but did include chemical bonding information and
bond geometry, the TDA in a totally unsupervised manner traced the connectivity of the atom positions that
form the vertices of the coordination polyhedral. Also, the TDA analysis as visualized through the evolution
of the barcode identifies the sequence of coordination number that drives clustering of compounds within the
apatite family. This appears to be a means of comparing crystal structures, and capturing long-range structure
within this particular family of apatites.
While the metaprism twist angle is a good indicator of classification for apatite structures 22, our earlier PCA
work then showed that it is actually the pairing of twist angles that serve as the primary classification tool 16. This
work here then shows that angular combinations provide one perspective of classification but the classification
according to the role of certain CN polyhedral is the primary driving force for classification and that twist angle
pairing serves as another level driving sub-classifications. The results described above using the TDA derived
barcode representation of the persistence of correlations among descriptors has provided a rapid means of
tracking classification based on simultaneously identifying the chemical environment around a given atom in a
complex structure along with the overall arrangement of the neighbors around a given atom.
Scientific Reports | (2021) 11:11599 | https://doi.org/10.1038/s41598-021-90070-4 9
Vol.:(0123456789)www.nature.com/scientificreports/
Conclusion
The use of the TDA derived barcode representation of the persistence of correlations among descriptors has
provided a rapid means of tracking classification based on simultaneously identifying the chemical environ-
ment around a given atom in a complex structure along with the overall arrangement of the neighbors around
a given atom. The computational challenge in linking metrics that capture the geometrical characteristics of
crystal structure and information on the chemical bonding that governs those spatial relationships revolves
around the methods of partitioning spatial relationships in the three dimensions. This study has demonstrates
the value of including TDA in the materials informatics toolkit and provided an example of its use in exploring
and classifying coordination geometry by identifying the geometrical connectivity between atoms that form the
structural building units has been discussed extensively in the literature. Many approaches have for instance
used some form of Vornoi partitioning schemes to track coordination environments for a given atom 34–36. A
key advantage of the approach described here is that it is robust enough to accommodate the different genres of
crystal chemistry descriptors to identify the atomic environment and it permits one to automatically explore the
persistence of classification schema among homologous compounds. Using the apatite family as a case study, we
have been able to propose additional perspectives on classification of apatites by combining different approaches
to data dimensionality reduction that harness both statistical learning and topological data analysis methods.
The present study serves to demonstrate the value of applying topological data analysis to explore the inter-
actions of chemical and geometric descriptors of crystal chemistry to uncover new genres of classification rules
for homologous compounds. We also show that combining different types of data dimensionality reduction
techniques (eg. PCA and TDA) can offer new uses of machine learning methods as exploratory data mining
tools. The TDA approach captured some of the same groupings along with new classification rules (associated
with coordination number). Machine learning methods can in an unsupervised fashion discover coordination
polyhedra geometry classifications in families of crystal structures. This is a topic of emerging interest in the
materials informatics community, and we feel this work as contributing another approach to the field.
Data and code availablility
The data and codes used in this study are available through the ‘Materials Data Engineering’ web portal (www.
madeatub.buffalo.edu/MaDE@UB).
Received: 2 March 2021; Accepted: 5 May 2021
References
1. Pettifor, D. G. The structures of binary compounds. I. Phenomenological structure maps. J. Phys. Solid State Phys. 19, 285–313
(1986).
2. Mooser, E. & Pearson, W. On the crystal chemistry of normal valence compounds. Acta Cryst. 12, 1015–1022 (1959).
3. Van Vechten, J. A. Quantum dielectric theory of electronegativity in covalent systems. I. Electronic dielectric constant. Phys. Rev.
182, 891 (1969).
4. Phillips, J. & Van Vechten, J. Spectroscopic analysis of cohesive energies and heats of formation of tetrahedrally coordinated
semiconductors. Phys. Rev. B 2, 2147 (1970).
5. Goldschmidt, V. M. Die gesetze der krystallochemie. Naturwissenschaften 14, 477–485 (1926).
6. Kong, C. S., Villars, P., Iwata, S. & Rajan, K. Mapping the ‘materials gene’ for binary intermetallic compounds—A visualization
schema for crystallographic databases. Comp. Sci. Disc. 5, 015004 (2012).
7. Suh, C. & Rajan, K. Virtual screening and QSAR formulations for crystal chemistry. QSAR Comb. Sci. 24, 114–119 (2005).
8. Ghiringhelli, L. M., Vybiral, J., Levchenko, S. V., Draxl, C. & Scheffler, M. Big data of materials science: Critical role of the descrip-
tor. PRL 114, 105503 (2015).
9. Hiraoka, Y. et al. Hierarchical structures of amorphous solids characterized by persistent homology. Proc. Natl. Acad. Sci. U. S. A.
113, 7035–7040 (2016).
10. Nakamura, T., Hiraoka, Y., Hirata, A., Escolar, E. G. & Nishiura, Y. Persistent homology and many-body atomic structure for
medium-range order in the glass. Nanotechnology 26(30), 304001 (2015).
11. Ichinomiya, T., Obayashi, I. & Hiraoka, Y. Persistent homology analysis of craze formation. Phys. Rev. E 95(1), 012504 (2017).
12. Saadatfar, M., Takeuchi, H., Robins, V., Francois, N. & Hiraoka, Y. Pore configuration landscape of granular crystallization. Nat.
Commun. 8, 15082 (2017).
13. Sorensen, S., Biscio, C., Bauchy, M., Fajstrup, L. & Smedskjaer, M. Revealing hidden medium-range order in amorphous materials
using topological data analysis. Sci. Adv. 6(30), eabc2320 (2020).
14. Otter, N., Porter, M. A., Tilmann, U., Grindrod, P. & Harrington, H. A. A roadmap for the computation of persistent homology.
EPJ Data Sci. 6, 17 (2017).
15. Zomorodian, A. & Carlsson, G. Computing persistent homology. Distrete Comp. Geom. 33, 249–274 (2005).
16. Balachandran, P. V. & Rajan, K. Structure maps for A1(4)A6(II)(BO4)6X2 apatite compounds via data mining. Acta Cryst. B68,
24–33 (2012).
17. Balachandran, P. V., Rajan, K. & Rondinelli, J. M. Electronically driven structural transitions in A 10(PO4)6F2 apatites (A=Ca, Sr,
Pb, Cd and Hg). Acta Cryst. B70, 612–615 (2014).
18. Mercier, P. H. J. et al. Ab initio constrained crystal-chemical Rietveld refinement of Ca10(VxP1 − xO4)6F2 apatites. Acta Cryst.
B63, 37–48 (2007).
19. Mercier, P. H. J. et al. Geometrical parameterization of the crystal chemistry of P63/m apatites: Comparison with experimental
data and ab initio results. Acta Cryst. B61, 635–655 (2005).
20. Shannon, R. D. Revised effective ionic radii and systematic studies of interatomic distances in halides and chalcogenides. Acta
Cryst. A32, 751–767 (1976).
21. Pauling, L. The Nature of the Chemical Bond (Cornell University Press, 1960).
22. White, T. J. & ZhiLi, D. Structural derivation and crystal chemistry of apatites. Acta Cryst. 59, 1–16 (2003).
23. Baikie, T. et al. Polysomatic apatites. Acta Cryst. B66, 1–16 (2010).
24. Ptacek, P. Introduction to apatites. Intech Open Sci. 62208, 1–59 (2016).
25. Chambers, M. S., Chater, P. A., Radosavljevic Evans, I. & Evans, J. S. O. Average and local structure of apatite-type germanates and
implications for oxide ion conductivity. Inorg. Chem. 58, 14853–14862 (2019).
Scientific Reports | (2021) 11:11599 | https://doi.org/10.1038/s41598-021-90070-4 10
Vol:.(1234567890)www.nature.com/scientificreports/
26. Bhattacharya, S., Ghrist, R. & Kumar, V. Persistent homology for path planning in uncertain environments. IEEE Trans. Rob. 31,
578–590 (2015).
27. Carlsson, G., Ishkhanov, T., d Silva, V. & Zomorodian, A. On the local behavior of spaces of natural images. Int. J. Comput. Vis.
76, 1 (2008).
28. Camara, P. G. Topological methods for genomics: Present and future directions. Curr. Opin. Syst. Biol. 1, 95 (2017).
29. Donato, I. et al. Persistent homology analysis of phase transitions. Phys. Rev. E 93, 052138 (2016).
30. Edelsbrunner, H., Letscher, D. & Zomorodian, A. Topological persistence and simplification. Discrete Comput. Geom. 28, 511
(2002).
31. Zhang, T., Broderick, S. R. & Rajan, K. Topological data analysis for the characterization of atomic scale morphology from atom
probe tomography images. In Nanoinformatics (ed. Tanaka, I.) 133–155 (Springer, 2018).
32. Edelsbrunner, H. & Harer, J. L. Computational Topology: An Introduction (American Mathematical Society, 2010).
33. Maria, C., Boissonnat, J-D., Glisse, M. & Yvinec, M. The Gudhi Library: Simplicial Complexes and Persistent Homology (Research
Report No. 8548, 2014).
34. Waroquiers, D. et al. ChemEnv: A fast and robust coordination environment identification tool. Acta Cryst. B76, 683–695 (2020).
35. Blatov, V. A. A method for hierarchical comparative analysis of crystal structures. Acta Cryst. A62, 356–364 (2006).
36. Waroquiers, D. et al. Statistical analysis of coordination environments in oxides. Chem. Mater. 29, 8346–8360 (2017).
Acknowledgements
We gratefully acknowledge support from National Science Foundation (NSF) DIBBs program, Award Number
1640867. KR also acknowledges the Erich Bloch Endowment at the University at Buffalo-State University of
New York.
Author contributions
All authors contributed to the main manuscript text. S.B. led the interpretation. R.D. and T.Z. performed the
analysis. K.R. supervised the work.
Competing interests
The authors declare no competing interests.
Additional information
Supplementary Information The online version contains supplementary material available at https://doi.org/
10.1038/s41598-021-90070-4.
Correspondence and requests for materials should be addressed to K.R.
Reprints and permissions information is available at www.nature.com/reprints.
Publisher’s note Springer Nature remains neutral with regard to jurisdictional claims in published maps and
institutional affiliations.
Open Access This article is licensed under a Creative Commons Attribution 4.0 International
License, which permits use, sharing, adaptation, distribution and reproduction in any medium or
format, as long as you give appropriate credit to the original author(s) and the source, provide a link to the
Creative Commons licence, and indicate if changes were made. The images or other third party material in this
article are included in the article’s Creative Commons licence, unless indicated otherwise in a credit line to the
material. If material is not included in the article’s Creative Commons licence and your intended use is not
permitted by statutory regulation or exceeds the permitted use, you will need to obtain permission directly from
the copyright holder. To view a copy of this licence, visit http://creativecommons.org/licenses/by/4.0/.
© The Author(s) 2021
Scientific Reports | (2021) 11:11599 | https://doi.org/10.1038/s41598-021-90070-4 11
Vol.:(0123456789)You can also read