Climate Solutions and Economic Opportunities - A foundation for Minnesota's state climate action planning - Minnesota ...
←
→
Page content transcription
If your browser does not render page correctly, please read the page content below

Climate
       Solutions and
       Economic
       Opportunities
       A foundation for Minnesota’s
       state climate action planning

Kadunce River, Lake Superior
Table of Contents

 Executive Summary  .  .  .  .  .  .  .  .  .  .  .  .  .  .  .  .  .  .  .  .  .  .  .  .  .  . 4                     CREDITS

                                                                                                                       Project Leadership:
 Introduction  .  .  .  .  .  .  .  .  .  .  .  .  .  .  .  .  .  .  .  .  .  .  .  .  .  .  .  .  .  .  .  .  . 10
                                                                                                                        Environmental Quality Board
 Business as usual: How are we doing?  .  .  .  .  .  .  .  .  . 14                                                     Pollution Control Agency

                                                                                                                        Department of Commerce
 Climate action policies  .  .  .  .  .  .  .  .  .  .  .  .  .  .  .  .  .  .  .  .  .  .  . 22
                                                                                                                       The development, analysis, and
            • Immediate-impact policies  .  .  .  .  .  .  .  .  .  .  .  .  . 24                                      writing of this report included the
                                                                                                                       other EQB member agencies:
            • Long-term strategies  .  .  .  .  .  .  .  .  .  .  .  .  .  .  .  .  .  . 30                             Board of Water and Soil Resources

            • Pilot programs  .  .  .  .  .  .  .  .  .  .  .  .  .  .  .  .  .  .  .  .  .  .  .  . 36                 Department of Administration

                                                                                                                        Department of Agriculture
 Conclusion  .  .  .  .  .  .  .  .  .  .  .  .  .  .  .  .  .  .  .  .  .  .  .  .  .  .  .  .  .  .  .  .  .  . 39
                                                                                                                        Department of Employment and
                                                                                                                          Economic Development
 Results Table  .  .  .  .  .  .  .  .  .  .  .  .  .  .  .  .  .  .  .  .  .  .  .  .  .  .  .  .  .  .  .  . 42
                                                                                                                        Department of Health

                                                                                                                        Department of Natural Resources

                                                                                                                        Department of Transportation

                                                                                                                        Metropolitan Council

                                                                                                                       EDITED BY Amanda Jarrett Smith

                                                                                                                       GRAPHIC DESIGN BY Paula Bohte

  2           Climate Solutions and Economic Opportunties
A Call to Action

                                                                                            Bass Lake, Grand Rapids

 Minnesota has made significant strides to address    in climate policies, Minnesota could add 25,000
 climate change . Renewable energy now accounts       new jobs and generate more than $2 billion
 for 21% of the Minnesota’s in-state electricity      in additional wages during the next 15 years .
 generation, up from 4% in 2000 . Wind energy         To achieve these results, Minnesota needs
 alone provides over 17% of our state’s electricity   clean energy policies that have an immediate
– equal to the total electricity use in one in six    impact on reducing emissions from our homes,
 homes, businesses, and community institutions .      buildings, and industries . We also need long-term
                                                      strategies to transform our communities and
Despite this progress, we missed our 2015
                                                      their transportation systems to reduce our use of
greenhouse gas emission targets and will miss
                                                      gasoline .
the 2025 goal without additional work . Minnesota
needs bold action to meet these goals and secure      We also must protect and increase the carbon
the environmental, health, and economic benefits      stored in our wetlands, forests, and agricultural
of tackling climate change . This report provides     lands . These actions will not only help us address
the foundation for state climate planning . We        climate change, but will also support habitat and
need to work together to transform plans into         water quality, benefiting public health and wildlife.
actions .
                                                      Working together, we can take steps that protect
The need for action is clear: Minnesota is already    the environment, improve our health, and grow
feeling the impacts of climate change . We have       our economy .
experienced four 1,000-year rainfalls since 2002 .
We have watched our spruce, fir, aspen, and
birch forests retreat northward . And air pollution
related to greenhouse gas emissions annually
                                                      Tina Smith
cost us more than $800 million in increased
                                                      Lt . Governor
health care costs .

Addressing climate change also has the potential
to grow our economy . By aggressively investing

                                                            Climate Solutions and Economic Opportunties     3
Executive Summary

Minnesota is committed by statute to do its part for the
climate by meeting its Next Generation Energy Act goals .
This 2007 law requires the state cut its annual emissions of
greenhouse gases by 80% between 2005 and 2050 . While
much progress has been made, the 2050 goal will require
policies well beyond what is already in place at the federal
or state level . This report focuses on near-term emissions
reductions between the present and 2030 . It includes
analysis and discussion of the options before us, providing
a framework for decision-making that is based in part on
the Minnesota Environmental Quality Board and member
agencies’ Climate Solutions and Economic Opportunities
(CSEO) project .

                                        Our climate is changing

                   Prevention                                         Preparation

      Reduce use of                                     Public education
      fossil fuels          Protect and build
                            carbon stored in land

                                                                                Risk assessment

4   Climate Solutions and Economic Opportunties
What is Climate Action?
Minnesota’s climate is changing: communities         Prevent the problem from getting worse
are already experiencing warming temperatures
                                                     The first step to reducing the greenhouse gas
and more frequent extreme rain events . The
                                                     emissions that contribute to climate change is to
state is already paying the cost in infrastructure
                                                     create an inventory of the sources of emissions and
damage, loss of winter tourism, and a cascade
                                                     then to identify where reductions could occur . The
of effects on agriculture, natural resources, and
                                                     next step is to design policies to implement these
wildlife . To prevent the situation from becoming
                                                     reductions . Stakeholder engagement is important
worse, the state needs to reduce its greenhouse
                                                     for prioritizing policies, optimizing design, and
gas emissions . Doing so will require the state
                                                     providing ongoing feedback and input .
to reduce use of fossil fuels and to protect the
carbon stored in its trees and lands . Government    This report reflects the first three out of the five
and communities also need to assess and plan for     steps shown in the climate planning process . It
the risks posed by the changing climate . Climate    presents Minnesota’s greenhouse gas inventory,
action requires efforts at global, federal, state,   identifies where reductions could occur, and
community, and household levels .

                                          Climate Planning

   Inventory
                        Identify
   Greenhouse           Where                                                              Implement
   gas emissions                                                 Engage
                        reductions                               stakeholders
                        could occur           Design             to prioritize
                                              policies           and optimize

                                                     describes policy options to do so . To meet the
                                                     state’s 2025 greenhouse gas emissions reduction
                                                     goal, the state will need to take immediate actions to
                                                     reduce fossil fuel use in the electricity and industrial
                                                     sectors . To meet the state’s 2050 goal, the state
                                                     needs to immediately begin to implement long-term
                                                     strategies that reduce fossil fuel use in vehicles and
                                                     that protect carbon stored in the state’s land . Finally,
                                                     the state needs to test new technologies and ideas
                                                     through small-scale pilot projects .

                                                            Climate Solutions and Economic Opportunties     5
Executive Summary

Prepare for extreme weather and climate
warming

More frequent extreme weather and changing
climate pose risks to Minnesota’s communities
and businesses . The state needs to adapt to
these changes and increase its resilience so that
when events occur, communities and businesses
recover more quickly . Doing so requires
that Minnesota assess the risks to its critical
infrastructure, natural resources, and businesses .
Then the state can plan for risks and incorporate
those risks into program and policy development .
The state can do much of this planning through
existing programs and efforts such as relate to
storm water management, urban trees and land
management, water conservation, agricultural
best practices, and wetland protection and
restoration . While this document focuses on
climate mitigation, many of the strategies also                                        Red River Valley
have adaptation co-benefits that are noted.

                                                     Adaptation

          Assess risks
     hospitals                                                           When
                   ecosystems                             Manage risks   disasters occur,
                                                           you cannot    communities
                                                            eliminate    and businesses
                                                                         recover more
                                                                         quickly.
        water                         Plan for
      supplies                       these risks
                    power            Incorporate
                    generation
                                      plans into
        roads
                                        action             Implement
                   crops
                                                           changes to    A more resilient
                                                           reduce risk
                                                                         Minnesota

 6     Climate Solutions and Economic Opportunties
Key Findings of This Report                         • Identify overlap between climate action and
                                                      other environmental protections and economic
This report is based on work done by the State        interests and work to leverage best outcomes .
of Minnesota to better understand the state’s
progress on the road to reaching its climate        • Modify agricultural production to prevent
goals and with the objective of advancing             the additional loss of soil carbon, increase
discussion of additional policy options to            carbon storage in soils, and avoid emissions
achieve the state’s climate goals . Some of the       from fertilizer . These changes will also greatly
key findings of these efforts are reflected here.     improve soil health and water quality .

Status of climate action                            • Invest in urban and rural forests, wetlands,
                                                      peatlands, and prairies to maintain and expand
• Minnesota has strong climate goals and a            sequestered carbon . These investments will
  commitment to help maintain a stable climate        also protect Minnesota’s air, water, recreation
  on Earth .                                          opportunities, and wildlife habitat .
• Minnesota is not on track to meet these goals     Opportunities to grow cross-sector
  and does not have policies in place to meet       partnerships
  them .
                                                    • Build capacity in state government, regional
• The state’s renewable energy and energy             and local governments, and the public sector
  efficiency policies have been hugely                for ongoing assessment of the economic and
  successful, but do not go far enough to meet        greenhouse gas impacts of environmental and
  the state’s greenhouse gas reduction goals .        climate policies .
• Minnesota’s climate action thus far shows a       • Partner across interest groups focused on
  pairing of economic growth with decreasing          issues such as air quality, water quality, wildlife
  emissions .                                         protection, as well as climate change to move
                                                      policies forward . There is much opportunity to
What the state can do to meet its
                                                      do this as climate policies include significant
climate goals
                                                      co-benefits for public health, the environment,
• Increase levels of energy efficiency and            and the economy .
  renewable energy in electric generation,
                                                    • Recognize and support private businesses for
  which will have an immediate impact on
                                                      their sustainability and climate planning .
  emission reductions .

• Strengthen efforts to transform land use
  patterns and mass transit systems to reduce
  reliance on single occupancy, internal
  combustion engine vehicles .

• Plan and implement the conversion from
  gasoline to electric- and hybrid-powered cars
  and transit .

                                                          Climate Solutions and Economic Opportunties   7
Executive Summary

Visions for the Future                                   Emission reductions in Minnesota
                                                         communities
While this report focuses on being on track
in 2030, the ultimate goal is 80% reduction         The shift away from fossil fuels offers
by 2050 from 2005 greenhouse gas emission           opportunities to make Minnesota communities
levels . To do so will require ongoing analysis and more livable and to achieve public health benefits
climate planning . Achieving the 2050 goal will     through greater opportunities to walk or bike,
likely require changes in how Minnesota builds      cleaner air and water, and more green spaces . In
and grows its communities, as well as changes in communities, climate action could take the form
the electricity and transportation systems . The    of reducing how much cars are driven, increasing
policy options discussed in this report seek to     the connectivity and density of where people live,
lay the groundwork for actions to set a path for    and using more mixed zoning to allow people
2050, recognizing a need for ongoing updates        to live near the places they enjoy and rely on .
over time .                                         By locating businesses and residential areas
                                                    together, residents have more opportunities to
                                                    go places by foot, bike, mass transit, or with
                                                    shorter drive times . Expanding bike lanes and
                                                    mass transit options as viable travel choices
                                                    can further support the shift away from single
                                                    occupancy vehicles .

                     Reducing greenhouse gas emissions in our communities

              Action                                                            Outcomes

 Build compact                                                                 Improve air quality
 communities
                                                                   Improve public health with
                                                                   access to physical activity
                                        Reduce use of
     Expand bike lanes                single occupancy
                                          vehicles         Preserve                                  Accomodate
                                                           open space                                population growth

           Expand mass transit                                            Build communities through
                                                                        casual interaction in neighborhoods

 8       Climate Solutions and Economic Opportunties
What could 2050 and 80% greenhouse gas reduction look like?

           Action                                                               Outcomes
                                                                               Clean air
              Energy                 With a clean grid
              efficiency             -Electrify cars
                                     -Electrify buses                    Improve public health
                                     -Electrify heating
  Clean                                                                    Create local jobs
  electric grid

                                                                      Electric cars and buses provide
                  Clean local                                         storage that can be used
              energy projects                                          for electric grid back-up

What could 2050 look like?                             homes, and industries to using clean, renewably
                                                       generated electric power . For instance, cars,
There are many pathways to reach 80%                   buses, and trains could be powered by electricity
greenhouse gas reductions by 2050 . One vision         and electric-charged batteries . Heating in homes
for doing so is to make the electric grid nearly       and industry could switch from directly burning
carbon free through renewable energy and               fuels like propane and natural gas to using
energy efficiency. Other energy needs could then       electric power or fuel from biomass .
move from directly burning fossil fuels in vehicles,

                                                                                           Little Chippewa Lake

                                                             Climate Solutions and Economic Opportunties          9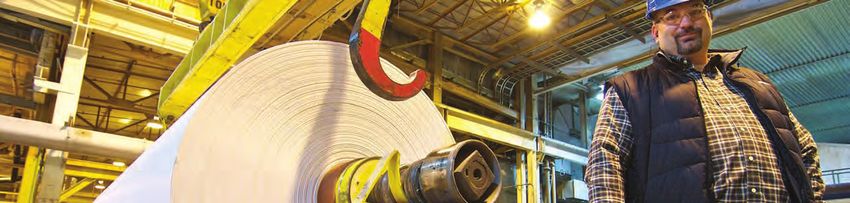
Introduction
                                                                                    Minnesota is committed in statute to do its part
                         Economic Growth with Climate Action                        to maintain a stable climate through its Next
                                                                                    Generation Energy Act goals . This commitment
                 150%                                                               requires reduction of greenhouse gas emissions
                                                                                    well beyond what existing state policies will
                                                              % Change GSP
                                                                                    achieve . In Minnesota, these goals can be achieved
                                                                                    by reducing fossil fuel consumption and by
                 120%                                                               protecting and increasing carbon stored in the
PERCENT CHANGE

                                                                                    land and trees . This report provides a framework
                                                               % Change GHG
                                                                                    for directing the state’s climate action planning,
                                                                                    including descriptions of policy options and
                 90%                                                                consideration of their economic and emission-
                                                                                    reduction potential . Minnesota’s climate action
                                                                                    thus far shows a pairing of economic growth with
                                                    Total % Change (GHG/GSP)        decreasing emissions . This means that Minnesota
                 60%                                                                is continuing to grow its economy while also
                        1997   1999   2001   2003     2005   2007    2009    2011
                                                                                    reducing its greenhouse gas emissions .
             Minnesota continues to grow its economy as it reduces
             greenhouse gas emissions. Relative to 1997, Gross State
                                                         The state of Minnesota began assessing policy
             Product (GSP) has increased while emissions have
             declined and reached a plateau.             options for the potential to reduce emissions
                                                         through the Minnesota Climate Change Advisory
Group (MCCAG) in 2007 and 2008 . In 2014, the Minnesota Environmental Quality Board with all its
member agencies began updating this work with the Climate Solutions and Economic Opportunities
(CSEO) project . To set priorities for this reanalysis, stakeholders were convened in a public meeting in
March of 2014 . Stakeholder discussion focused on trends in technology adoption and new policy ideas
that had emerged since 2008 . State agencies designed policy options and discussed them in several
stakeholder meetings in 2014 and 2015 . The Center for Climate Strategies (CCS) consulting group,
under a memorandum of agreement with the state, analyzed policy options to estimate greenhouse
gas emission reductions and economic impacts of policy options . The analysis focuses on being on
track in 2030, where the 2030 target is a linear interpolation between the 2025 and the 2050 goal .
This report reflects the state’s takeaways from the project and presents them as a foundation for
climate action planning .

        10               Climate Solutions and Economic Opportunties
Immediate-impact policies Long-term strategies Pilot programs to develop
to start now
Electricity: Transportation:
Urban development:
• Increase the renewable • Advanced biofuels
electricity standard • Transit and multimodal travel
• Compact development • Pay-as-you-go car insurance
• Retire and repower • Electric vehicles • Fuel- or carbon-based tax
coal plants • Urban forests
Energy:
Energy efficiency • Renewable thermal energy
opportunities:
Land management:
• Conservation improvement
• Forest health Agriculture:
programs
• Conservation and
• Combined heat and power • Fertilizer efficiency
working lands
• SB 2030 building guidelines • Market development for
• Agricultural soil development
• Wastewater facilities cover crops and perennials
Minnesota’s greenhouse gas reduction goals Reduce fossil fuel use
In the 2007 Next Generation Energy Act signed The majority of the state’s emissions currently
by Governor Tim Pawlenty, Minnesota set a come from burning fossil fuels . Minnesota has
greenhouse gas emission reduction goal of 80% no fossil fuel resources of its own: according
below 2005 levels by 2050 . The goal includes to the Energy Information Administration,
benchmarks of a 15% reduction by 2015 and a the state imported over $18 billion of fossil
30% reduction by 2025 . Since then, Minnesota fuels in 2012 from other states and countries
has successfully changed the trajectory of its to power vehicles, homes, businesses, and
emissions profile so it is no longer increasing. industries . Minnesota energy sources include
However, this trajectory is not adequate to meet wind, solar, biomass, and hydro . These home-
the goal . grown, renewable resources produce little
or no greenhouse gas emissions and can be
In 2015, Governor Mark Dayton reaffirmed the
used for electricity, direct heating, and vehicle
state’s climate goals by signing the Under 2
fuel . In addition to renewable energy sources,
MOU . This non-binding international agreement
energy efficiency offers opportunity to reduce
represents over 700 million people worldwide .
fossil fuel use while saving money . According
The agreement focuses on keeping the changes
to Minnesota’s 2025 Energy Action Plan draft
in global temperature below two degrees Celsius,
report, the state wastes more energy through
which is consistent with the magnitude of the
inefficiencies – an estimated 58% – than it
goals of the 2007 Next Generation Energy Act .
actually uses for electricity, direct heating, and
vehicle fuel .
Climate Solutions and Economic Opportunties 11Introduction
Build compact communities with more
transit options
A significant portion of emissions in Minnesota
comes from vehicles . Increasing compact
development of Minnesota cities by locating
housing, commercial areas, workplaces, and
institutions like schools nearer to each other and
near transportation corridors and nodes, could
provide more opportunities for people to bike,
walk, and ride public transit . These strategies take
careful planning and infrastructure improvements
Bass Lake near Grand Rapids
over years, but have the potential to improve
neighborhoods and improve the sense of
connection within communities . Replacing
Protect carbon stored in lands vehicle miles traveled with active travel such as
Minnesota stores significant amounts of carbon biking and walking can have important public
in its land and trees . As of today, an estimated health benefits, while also reducing emissions
15 billion CO2-equivalent short tons (CO2-e) of greenhouse gases and other harmful air
remain sequestered in Minnesota wetlands and pollutants .
peatlands – this represents thousands of years
of carbon accumulation . An estimated 6 billion Emissions Reductions from
CO2-e tons are preserved in Minnesota forests . CSEO Policy Options (CO2-e short tons)
Since the beginning of European settlement, the
PROJECTED
state lost or diminished many of its wetlands, Business as usual
forests, prairies, peatlands, and other natural 150
landscapes . This has reduced the landscape’s
capacity to store carbon and provide other
environmental benefits, such as clean water and
IN MILLIONS
100
habitat for plants and animals . Protecting and 2025 NGEA
Goals 2030
restoring natural features of the landscape and Residential,
commercial, industrial
increasing adoption of agricultural best practices Electric
can have multiple environmental benefits, 50
Transportation
Forestry
including reduction of greenhouse gas emissions . Agriculture
Emissions
Waste
Federal and state policy recognizes that there is a
social cost associated with carbon emissions that 0
2015 2020 2025 2030
can be considered in decision making . Globally,
many groups are advocating for the development 2014-2016 analyses of policies to reduce emissions in
of a universal price for carbon emissions that Minnesota are shown by sector. The height of the gray
area and all the colored wedges represent business-
would capture the social costs associated with as-usual emissions, the colored (non-gray) areas
climate change . With such a price, the value of represent emissions avoided through policies discussed
in this report. The height of the gray area represents
natural lands and efforts to protect them would
the remaining emissions after policy options are
be recognized and encouraged by the markets . implemented.
12 Climate Solutions and Economic OpportuntiesPolicy options for meeting climate goals What are the broader impacts of these
policies?
Meeting state greenhouse gas reduction goals
will require both near- and long-term planning In addition to reducing greenhouse gas emissions,
and additional actions that must begin now . several of the policies have the potential for
Based on analysis, and further informed broader impacts on the environment and
through public engagement, policies are economy that could increase the quality of life in
divided into three categories: Minnesota, such as:
• Immediate-impact policies – These policies
result in immediate reduction of greenhouse Increase resilience to extreme
weather by protecting lands
gas emissions . These policies account for
or infrastructure from damage
64 to 79% of the emissions reductions the or adapting infrastructure to
analysis showed could be made between allow for continued services
now and 2030 . All the immediate-action when extreme weather shuts
down or impairs systems.
policies focus on the electric sector .
• Long-term strategies – These policies are
critical for reaching the 2050 goals, but Create new jobs in
they require more time for development . Minnesota through
investment in construction
Generally, these policies reduce the use of new infrastructure,
of single-occupancy internal combustion land management, and
vehicles and protect or increase carbon community energy projects.
stored in soils and trees .
• Pilot programs – These policies have high
potential to reduce emissions; however, they Protect water quality by
involve new programs or technologies that minimizing contaminants,
need to be explored and tested before they conserving the use of water,
or protecting and restoring
can be implemented at a large scale . These wetlands that act as a filter.
policies include transportation options,
distributed renewable energy for direct
heating and cooling, and agricultural best
practices . Protect air quality by
minimizing emissions of
Policies are comprised of state-level actions particles or chemicals that
that could be implemented through legislative have adverse health and
or administrative action by state government . environmental impacts.
Many of the policies could also be implemented
on a smaller scale by local governments,
grassroots community initiatives, and some
individual actions . Additionally, many of these
policies could be implemented or supported by Protect wildlife by
federal policy . creating, enhancing,
or protecting habitat.
Climate Solutions and Economic Opportunties 13Business as Usual: How Are We Doing?
Sappi Paper Mill, Cloquet
Greenhouse Gas Emissions by Sector (CO2-e short tons)
MEASURED PROJECTED
200 Additional reductions
2012
to be on track in 2030:
53 million short tons
150
2015 NGEA Goal
Electric Power
IN MILLIONS
2025 NGEA Goal
100
2030 NGEA
Transportation Target Level
50 Agriculture
Industrial
Residential
0
Waste Management Commercial
1990 1995 2000 2005 2010 2015 2020 2025 2030
Historic greenhouse gas emissions (1990-2011) and projected emissions (2012–2030) are shown by economic sector.
To be on track in 2030 for meeting Next Generation Energy Act Goals, an additional 53 million CO2-equivalent
short tons (CO2-e) a year need to be reduced beyond business as usual. (Data source: Minnesota Pollution Control
Agency, September 2013).
Greenhouse gases are gases in the atmosphere hydrofluorocarbons and perfluorocarbons.
that trap heat from the sun and warm the For planning purposes, the state also projects
atmosphere and surface of the planet . Man-made greenhouse gas emissions in future years .
increases in the amount of these gases in the Projections are based on compliance with
atmosphere are altering Earth’s climate . To track existing state and federal law, population and
progress toward the Next Generation Energy economic trends, forecasted technology changes,
Act reduction goals, the Minnesota Pollution and proposed energy projects and new large
Control Agency estimates and reports emissions industrial production facilities .
of several greenhouse gases: carbon dioxide
Greenhouse gas emissions in 2012 totaled 154
(CO2), nitrous oxide, methane, sulfur hexafluoride,
million CO2-e tons . Between 2005 and 2012,
and two classes of compounds known as
14 Climate Solutions and Economic OpportuntiesMinnesota’s emissions declined by about 7% . borders that are not addressed in this report .
Some of these reductions resulted from the Minnesotans can reduce these emissions by
temporary outage of one of the state’s largest purchasing fewer new goods and growing
coal-fired power plants and thus don’t reflect the state’s reuse and refurbishment industry .
long-term decreases . Businesses and corporations can also work to
track and reduce emissions in their supply chain .
In addition to the greenhouse gas emissions
inventoried and produced in state, significant Significant greenhouse gas emissions reductions
indirect emissions result from products and can be achieved in many sectors of Minnesota’s
services purchased by Minnesotans that are economy . The following sections provide
not tracked by the state inventory . Many of information on each sector of the economy and
these products and services are manufactured, the sources of greenhouse gases and background
distributed, grown, or disposed of outside of on what has already been done to achieve
the state, resulting in emissions outside of state emissions reductions .
Emissions come from all sectors of the economy with 85% of the state’s
emissions coming from electricity generation, transportation, and agriculture .
Electricity Combustion of fuel for
generation generation of electricity
Fuel combustion, air conditioning
Transportation leakage, leakage from natural gas
pipelines and stations
Livestock flatulence, manure
Agriculture management, fertilizer use, crop
cultivation, fuel combustion
Fuel combustion to directly heat
Commercial, industrial, spaces and water, chemical use,
and residential buildings non-combustion industrial processes
and processes *note this does not include electricity use in
buildings, industry, or homes
Waste processing and incineration, methane
Waste from landfill gas and wastewater,
carbon sequestered in demolition landfills
Climate Solutions and Economic Opportunties 15Business as Usual
Electric Utility Sector switching from coal to natural gas . Electricity
from in-state renewable sources could comprise
as much as 33% of net generation to service
Electricity Sector (CO2-e short tons) Minnesota electric demand in 2030 based on the
2015 forecast. Energy efficiency will reduce the
MEASURED PROJECTED state’s electricity use by an estimated 11 million
80 2012
megawatt hours (MWHs) by 2030 .
70
Emissions-avoided
Renewable Energy
60 Ener
nergy Efficiency
ncy
Revised Electricity Sector Forecast
(CO2-e short tons)
CHP Coal Retirement
IN MILLIONS
50
50
40
Business as usual (2013)
30 40 Revised forecast (2015)
Emissions
20
IN MILLIONS
30
10 Sherco reduction
0
1990 1995 2000 2005 2010 2015 2020 2025 2030
20
Historic emissions (1990 – 2011) and projected emissions
(2012 – 2030) are shown for the consumption of
electricity in blue. These values include emissions from 10
generation imported from other states. Estimated avoided
emissions from renewable energy, energy efficiency, and
coal retirement or replacement are shown in orange.
0
(Data source: Minnesota Pollution Control Agency, 2012 2015 2020 2025 2030
September 2013). ***CSEO analysis is based on this 2014 forecast.
The Minnesota Pollution Control Agency (MPCA)
completed its greenhouse gas forecast for the state’s
business as usual emissions in early 2013. The forecasts
Emissions from electricity generation result use information provided annually to the Minnesota
primarily from the combustion of coal and natural Public Utilities Commission (PUC) by utilities in their
gas at power plants . This electricity is used to Electric Utility Annual Report, Advanced Forecast
(EUAR AF). The MPCA revised its electric power sector
light Minnesota homes, offices, and commercial forecast in December 2015, using a more recent EUAR.
buildings . It powers electronic devices and air The downward revision reflects more robust renewable
conditioners . It’s also used in industrial and energy expansion, lower expected natural gas prices,
retirements at six coal-burning facilities in the state
manufacturing processes that don’t generate (Black Dog, Hoot Lake, Silver Lake, Austin Northeast,
electricity onsite . Emissions from electric power Taconite Harbor, and Boswell Energy Center), somewhat
slower expected growth in retail electric sales, and
generation peaked in Minnesota in 2006 .
a general reduced intensity of emissions associated
Between 2006 and 2011, emissions declined with imported power. In October 2015, Xcel Energy
about 13% at a rate of approximately 3% per year . proposed shuttering its large coal-burning units 1 and 2
in Sherburne County, and replacing one with a natural
By 2030, electric sector emissions are projected gas combined cycle unit. The MPCA estimates that this
to decline by 27% based on the updated 2015 proposal, subject to PUC approval, would result in an
forecast despite increased customer demands . additional emission reduction of roughly 5 million CO2-e
tons annually.
The state is increasing electricity output while
lowering emissions through the deployment of
energy efficiency and renewable energy and by
16 Climate Solutions and Economic Opportuntieshelp rate-payers reduce energy use also have
The 2015 forecast shows that between
increased energy efficiency. Energy efficiency
2011 and 2030 the amount of emissions improvements generally are the least expensive
produced per MWH of electricity in source of additional power to meet demand, often
Minnesota will decline 34% costing less than half the cost of power from new
generating sources .
Between 1990 and 2011, several policies were In addition to state policies, federal environmental
implemented in Minnesota that in combination standards are also influencing the electric sector in
reduced 15 .6 million CO2-e tons of emissions per Minnesota . In particular, the 2011 Mercury and Air
year from the electric power sector . Major policies Toxics Standard and the ongoing Clean Power Plan
include: process require reductions in mercury and carbon
• In 1994, an initial investment was made in wind dioxide pollution, respectively, from coal-fired
power and solid biomass generation capacity power plants . These policies are contributing to the
as part of Prairie Island nuclear spent storage switch from coal to natural gas as well as increasing
legislation . investment in new renewable energy capacity .
• In 2004, the state implemented its Renewable
Energy Objective . Electricity is Geting Cleaner
• Adoption of the “emissions reduction rider”
HISTORIC Forecast
statute M .S . 216B .1692 allowing Minnesota 2.0 2012
utilities to propose projects through an
expedited cost recovery process .
FACTOR INCREASE 1990 = 1
• In 2007, the Renewable Electricity Standard 1.5 Electric Retail Sales
(RES) required that by 2025, about 27% of In-State Net
Generation
power provided to consumers by electric utilities
be generated using renewable forms of energy .
Greenhouse Gases
• In 2007, the state implemented electric utility 1.0
requirements to reduce 1 .5% of retail sales
through programs that target the users of
electricity, building on previous successful
efficiency programs. 0.5
1990 1995 2000 2005 2010 2015 2020 2025 2030
• In 2013, the state added a Solar Electricity While electricity demand has increased and is forecasted
to continue to increase, the greenhouse gas emissions
Standard of 1 .5% by 2020 for investor owned from the electric sector will continue to decline from
utilities and a goal of 10% solar electricity by 2030 . increased renewable energy and switching from coal to
natural gas. (Data source: Minnesota Pollution Control
These clean energy policies continue to drive Agency, September 2013).
emission reductions . By 2030, existing policies
will drive annual reductions of about 30 million Between 1990 and 2011, increased
CO2-e tons below 2005 levels . These avoided efficiency allowed Minnesota utilities
emissions result primarily from increases in to forego the construction of roughly
renewable energy and energy efficiency. Most of 1,400 megawatts (MW) of new
this renewable energy capacity has been utility-
power generation capacity.
scale wind power . Many programs designed to
Climate Solutions and Economic Opportunties 17Business as Usual
Transportation Sector from improved fuel efficiency of vehicles balanced
against an increase in emissions from air travel .
While the number of vehicle miles traveled on roads
Transportation Sector (CO2-e short tons) is projected to increase, highway vehicle emissions
are projected to decline about 18% as a result of
50 MEASURED PROJECTED federal fuel economy standards for light- and heavy-
2012
duty vehicles . By contrast, emissions from aviation
are projected to rise more than 25% between 2011
40 Emissions-avoided
and 2030 .
Fuel
Economy Standards
IN MILLIONS
30
Vehicles are Geting More Efficient
Emissions
20
2.0 HISTORIC Forecast
2012
10
FACTOR INCREASE 1990 = 1
VMT
1.5
0
1990 1995 2000 2005 2010 2015 2020 2025 2030
Historic emissions (1990 – 2011) and projected emissions Greenhouse
(2012 – 2030) are shown for the transportation sector. Gases
Estimated avoided emissions from federal fuel economy 1.0
standards are shown in orange. (Data source: Minnesota Fuel Economy
Pollution Control Agency, September 2013).
The largest source of emissions in the 0.5
transportation sector is from combustion of 1990 1995 2000 2005 2010 2015 2020 2025 2030
fossil fuels in vehicles. Significant emissions Vehicle miles travelled are forecast to increase about
also come from aviation . This category does 15% between 2011 and 2030. This increase in miles
not include emissions from the construction of traveled will be somewhat offset by improved federal
fuel economy standards. (Data source: Minnesota
transportation infrastructure, which is accounted Pollution Control Agency, September 2013).
for in industrial emissions . The manufacturing of
concrete and asphalt are energy-intensive and
Reducing surface transportation emissions can be
produce significant greenhouse gas emissions.
impacted by three main variables:
Transportation emissions increased about 30%
from 1990 to 2004, peaking in 2004 . Emissions • Reducing the number of trips taken
declined about 11% between 2004 and 2011 as a
• Making shorter trips
result of improved vehicle efficiency, petroleum
replacement by ethanol and biodiesel, and a • Increasing the efficiency of vehicles or traveling
decline in overall driving . by foot or bike
Emissions from transportation are projected The first two variables are affected by land use
to continue to decline . By 2030, emissions are and the way communities are planned and laid
projected to be about 9% below 2011 levels . This out . For instance, mixed zoning that allows
decline reflects a projected decrease in emissions grocery stores, places of worship, and day care
18 Climate Solutions and Economic Opportuntiescenters to be located near to where people live
or work can reduce the distance people travel
and increase the number of trips taken by foot,
bike, or public transportation . Carbon emissions
per mile traveled is determined by the mode Fillmore County
of transportation and the efficiency of the
vehicle, so walking or biking have no associated Agriculture is a critical part of Minnesota’s
emissions; wide-spread use of mass transit results diversified economy and is also the third-largest
in significantly less emissions compared to driving source of greenhouse gas emissions . About 65%
a car; and electric, hybrid, fuel flex, or more of these emissions derive from crop production
efficient vehicles result in fewer emissions than and the remainder comes from the production
driving a conventional vehicle . of livestock . About half of emissions from crop
Minnesota is investing in improved transit production are related to the use of nitrogen
offerings and bike and pedestrian facilities, fertilizers . Nitrogen fertilizers release a powerful
especially in the Twin Cities Metropolitan greenhouse gas called nitrous oxide . The other
Area and other regional centers . Many more half of crop production emissions are from the
transportation alternatives are being considered combustion of fuel by farm tractors and other
as part of the Minnesota Department of equipment or from the oxidation of soils rich in
Transportation, the Metropolitan Council, organic matter . Of livestock emissions, about
and other regional and local government one-half originate directly from animal flatulence
transportation plans . and about one-third comes from stored manure .
Agricultural emissions reductions can be
Agriculture Sector achieved through using practices that reduce or
increase the efficiency of nitrogen fertilizer use
and improve manure management .
Agricultural Sector (CO2-e short tons)
Agricultural emissions increased 15% from 1990
MEASURED PROJECTED
levels by 2011 . Of this increase, about 70% was
35 2012 attributable to crop production, mainly from
increased nitrogen fertilizer applications to farm
30
fields and increased use of petroleum fuels in
25
farm equipment . The other 30% increase came
from livestock production: in particular, methane
IN MILLIONS
Crop Production
20 emissions increased as a result of a change in
manure management from solid to liquid storage .
15
Under current policies, agricultural emissions are
projected to remain roughly constant between
10
2011 and 2030 . The agricultural sector has the
Feedlots/Livestock
5 potential to achieve greenhouse gas emissions
reductions by using practices that improve
0
1990 1995 2000 2005 2010 2015 2020 2025 2030
nitrogen fertilizer and manure management,
while also sequestering carbon in soils and
Historic emissions (1990 – 2011) and projected
emissions (2012 – 2030) are shown for the agricultural perennials .
sector. (Data source: Minnesota Pollution Control
Agency, September 2013).
Climate Solutions and Economic Opportunties 19Business as Usual
Commercial, Industrial, and efficiencies save consumers money on their
Residential Sectors energy bills .
Many industrial and household products include
chemicals that emit greenhouse gases with a
Residential, Commercial, and high global warming potential . These chemicals
Industrial Sector (CO2-e short tons)
are found in everything from hair styling products
MEASURED PROJECTED to refrigerators . There are many alternative
50 2012
products that use less-potent chemicals . Recently
Emissions-avoided released new federal standards are critical to
40 Energy Efficiency decreasing the use of these chemicals . The state
could support federal efforts by tracking and
IN MILLIONS
30
reporting on quantities of these chemicals in
Industrial products .
20 Businesses and individuals often do not have
information about the presence of high global
10
Residential warming potential chemicals in the products
they buy . Without this information, there is no
Commercial market force to drive changes . If the state tracks
0
1990 1995 2000 2005 2010 2015 2020 2025 2030 and reports on these chemicals, and adds it to
labels or otherwise makes it widely available to
Historic emissions (1990 – 2011) and projected emissions the public, it could better inform the choices of
(2012 – 2030) are shown for the Industrial, Residential, individual consumers and private business supply
and Commercial sectors. Estimated avoided emissions
are shown in orange. (Data source: Pollution Control chains .
Agency, September 2013).
The residential, commercial, and industrial
categories include fuel combusted to directly
heat spaces and water . They also include
emissions from chemicals associated with
solvents, fertilizer, air conditioners, and
refrigerators, as well as fuel used in processes
like petroleum refining, taconite processing,
and manufacturing . The direct emissions
from electricity use in homes, businesses, and
industries are accounted for in the electric sector .
The state’s Conservation Improvement Program
drives avoided emissions in this sector by
requiring natural gas utilities to implement cost-
effective energy efficiency end-use programs
to reduce energy use by 1% per year . Similar to
efficiency in the electric sector, the opportunity Minneapolis Water Treatment Plant
to reduce wasted energy is significant and these
20 Climate Solutions and Economic OpportuntiesWaste Sector Waste emissions in Minnesota peaked in 1990
and have since fallen by about two-thirds
Waste Management Sector to about 2 million CO2-e tons . Emissions are
(CO2-e short tons) projected to decline an additional 17% below 2011
levels by 2030 . These reductions largely resulted
MEASURED PROJECTED
6 2012 from capturing and flaring landfill gas. Thirty-one
landfills in Minnesota currently capture methane
5 and either destroy it in flares or use it to generate
Emissions-avoided
electricity or energy for space and water heating .
4 At present, about half of all methane that is
IN MILLIONS
Methane Flaring produced in Minnesota’s landfills – roughly 2
3 million CO2-e tons – is captured and destroyed .
Emissions
2
Aside from flaring, it is also possible to reduce
the amount of methane produced in landfills by
1
reducing the amount of material that goes into
landfills by providing recycling and composting
0
opportunities . Recycling collects metals and
1990 1995 2000 2005 2010 2015 2020 2025 2030 plastics, melts them down, and uses the material
to make new products . Composting or digesting
Historic emissions (1990 – 2011) and projected (2012
– 2030) are shown for the waste sector. Avoided organic materials such as food waste provides
emissions are shown in orange. (Data source: Minnesota a means of keeping food and organic waste
Pollution Control Agency September 2013).
out of landfills as well. While more than 70% of
waste can theoretically be recycled, at present
Waste sector greenhouse emissions result only about 45% of solid waste in Minnesota is
from landfills, solid waste incineration, and recycled . Many local governments are working
wastewater treatment . Greenhouse gas emissions to find ways to divert waste away from landfills
from landfills currently account for more than through programs such as curb-side pickup of
half of all emissions from waste management . recycling and composting, one-stream recycling,
Wastewater treatment accounts for about 40% and education campaigns .
and solid waste incineration and other minor
The policy analysis in this report showed that
sources account for the remainder . Methane,
reduction of packaging, increased composting,
a greenhouse gas that, on a per-ton basis,
and increased recycling could drive waste
has approximately 25 times the atmospheric
reductions . These types of policies create jobs .
warming effect as carbon dioxide, is produced
However, Minnesota does not currently have
by decomposition of organic wastes in landfills,
extensive recycling processing facilities, and
municipal wastewater treatment facilities, and
thus most of the economic gains and emissions
septic systems . The combustion of solid waste in
reductions from these policies likely occur out of
large incinerators or in backyard burn barrels also
state .
releases emissions .
Climate Solutions and Economic Opportunties 21Climate Action Policies
Immediate-Impact Policies
Electricity:
• Increase the renewable
electricity standard
• Retire and repower coal plants
Energy efficiency opportunities:
• Conservation improvement programs
• Combined heat and power
• SB 2030 building guidelines
• Wastewater facilities
Washington County Landfill
The policy options discussed in this section would
result in an immediate reduction of greenhouse Percent of Achieving 2030 Target
gases through deployment of clean energy .
Clean energy includes both renewable energy 30
27%
and energy efficiency. Together, the policies
in this section would achieve 64–79% of the 25
emission reductions needed to be on track in
20 19%
2030, with the range depending on their level of
% of achievig 2030 goal
implementation . Policies were analyzed for their 15%
15
13%
potential to reduce greenhouse gas emissions
and for their potential economic impact on 10% 10%
10
Minnesota . 7%
5
In addition to contributing to meeting state
0.14%
goals, the immediate-impact policy options 0
Wastwater
Retire Coal
50% RES
SB2030
40% RES
CHP
CIP 2.5%
CIP 2%
Efficiency
described in this section could be used to
support Minnesota’s compliance with the federal
Environmental Protection Agency’s (EPA) Clean
Power Plan, a federal rule intended to reduce Clean energy policies that immediately reduce emissions
greenhouse gas emissions from electricity are shown. Bar height corresponds to the percent of
generation . The federal rule does not start until emission reductions towards the 2030 target.
2022; however, the state will need to design an
implementation plan to meet the rule well ahead
BROADER IMPACT KEY
of 2022 . In addition, utilities need time to plan
for compliance. By increasing energy efficiency,
increasing renewable energy, and decreasing use
of coal, Minnesota can decrease its greenhouse
JOBS CLEAN CLEAN PROTECT RESILIENCY
gas emissions without decreasing economic WATER AIR HABITAT
productivity or quality of life .
22 Climate Solutions and Economic OpportuntiesDecrease Fossil Fuel Use in
Minnesota Job Creation Electricity
3,000
Increase Renewable Electricity Standard
2,500
2,000
Minnesota’s Renewable Electricity Standard
Average Employment
1,500 (RES) is a state mandate that requires different
categories of electricity providers (investor-owned
1,000
utilities, publically owned municipal utilities, and
cooperatives) to source a minimum amount of
500
their retail electricity sales from eligible renewable
0 energy technologies . Legislation passed in 2013
Wastewater
Retire coal
SB2030
CHP
50% RES
40% RES
EE
CIP 2%
supports higher levels of renewable energy use
in Minnesota (Minnesota Laws 2013, Chapter 85
HF 729, Article 12, Sections 1, 4, and 7) . State
Clean energy policies that immediately reduce emissions legislation also sets the goal that by 2030, 10%
are shown. Bar height corresponds to the average
of the retail electric sales in Minnesota should
annual jobs created in the economy through policy
implementation using the Regional Economic Models, Inc. be generated by solar energy (Minnesota Stat .
(REMI) model of Minnesota’s economy. §216B .1691) . Increasing the renewable electricity
standard would need to be done by legislation and
not by administrative action .
Cost Versus Savings
Analysis shows that a 50% RES alone would reduce
1,000 more than a quarter of the emissions needed
Wastewater EE
to be on target in the year 2030 . This emissions
40% RES
reduction is the largest for any policy analyzed .
50% RES
CIP 2.5%
SB2030
500
CIP 2%
NPV Costs/Savings 2015-2030 ($2014MM)
Analysis also projected that this could create on
CHP
0 average 1,500 new jobs annually in the state . Since
Retire coal plants
the analysis was done, several new renewable
-500 energy projects have been proposed that, if built,
would potentially increase renewable generation
-1,000
to levels over 30% and potentially closer to 40%
of the electricity mix . Some of these changes
-1,500
are pending in the Integrated Resource Planning
processes . A 50% RES could move the state
-2,000
beyond these projects and create more certainty in
-2,500
increasing use of renewables .
Clean energy policies that immediately reduce emissions The analysis found that, while increasing the RES
are shown. Bar height correspond to the net costs and
would require upfront investments, there would
savings of policies where negative numbers are savings
and positive numbers are costs. Net present value (NPV) be a net savings because instillation of renewable
takes all future dollars and discounts them back to the energy equipment, such as wind turbines and solar
value of a dollar (in this case) in 2014.
Climate Solutions and Economic Opportunties 23Climate Action Policies - Immediate-Impact Policies
panels, is less expensive than new gas or coal
units . Further, once wind and solar equipment Clean energy policies in Minnesota
is installed, they have much lower operation have not only reduced
and maintenance costs compared to fossil fuel greenhouse gas emissions,
equipment . It is important to note that the
analysis did not focus on the technical feasibility
but also created jobs and
of policies, nor did it take into account the cost improved air quality
of transmission system upgrades needed to
accommodate potential changes in the location To aid in considering options available to meet
of energy generation . the state’s greenhouse gas reduction goals,
this analysis used Sherburne County (Sherco)
Other states are increasing their RES as they Generating Plant Units 1 and 2 as a proxy for
approach fulfillment of their standards. For modeling the impact of replacing approximately
instance, Vermont has a 75% RES by 2032, 1,360 MWs of coal power with a combination
California has a 50% RES by 2030, and Hawaii of natural gas combined cycle generation and
has a 100% RES by 2045 . These increased utility-scale wind power . Due to their size, Xcel
RES targets reflect successful development of Energy’s Sherburne County Units 1 and 2 are
renewable energy . some of the largest emitters of CO2 in the state .
This analysis is useful as a proxy for generically
Retire and repower coal plants
evaluating the potential impact of transitioning
utilities from coal to natural gas and renewable
energy . Evaluating the transition for any particular
power plant requires a more in-depth analysis
Governor Dayton has publicly announced his and consideration of both demand and supply
intention to move Minnesota away from reliance alternatives .
on coal . Since 2005, the state has retired or
Co-benefits to increasing renewable energy
converted 12 coal units to natural gas . There are
and decreasing the use of coal in Minnesota
18 coal-fired utility units currently operating that
provide about a quarter of Minnesota’s electric- Renewable energy growth has been rapid and has
generating capacity (approximately, 4200 MW had a positive impact on the economy . In 2000,
out of a total of about 15,100MW in the state) . Six only 4 .2% of Minnesota’s in-state generation came
of the 20 currently operating units are greater from renewable sources like wind or solar . In 2015,
than 250 MW, and some units are even greater 21% of in-state generation was renewable . Since
than 500 MW . Closing units this size means Minnesota does not have fossil fuel resources, the
that a large amount of electric needs must be growth in renewable energy represents economic
provided through other means, including shifts growth for the state . Clean energy employment in
to renewable electricity production and demand Minnesota surged 78% between 2000 and 2014,
management . This makes long-range planning growing steadily through the recession . That is
and evaluation critical . By 2020, four more units in comparison to the state’s total employment
are proposed for retirement, and between 2020 growth of only 11% over that period . Over 50,000
and 2030, another four are up for consideration . people work on renewable energy in some
Two of these units are assets owned by Xcel capacity, and more than 15,000 employees spend
Energy in Sherburne County and are in a over 50% of their time on renewable energy .
Minnesota Public Utilities Commission process of
review for possible early retirement . Burning coal releases chemicals into the air that
24 Climate Solutions and Economic OpportuntiesIncrease Energy Efficiency in Homes,
Buildings, and Industrial Processes
In addition to renewable resources, great
opportunity exists to reduce emissions and save
money through energy efficiency. Minnesota wastes
more energy than it actually uses – an estimated
58% (based on analysis of EIA data in Minnesota’s
2025 Energy Action Plan draft report) . Energy is
wasted due to inefficiencies such as thermal power
plant and transmission losses, leaky windows,
buildings without proper insulation, and inefficient
industrial processes. When the efficiency of energy
use increases, it saves money for homeowners and
businesses while reducing unnecessary greenhouse
Source: MPCA
gas emissions .
Expand the conservation improvement
can make it unhealthy to breathe . Breathing programs
and exposure to polluted air can contribute to
a variety of health problems from itchy eyes to
asthma attacks . Air pollution can also contribute
to serious illness and even early death . The Life
The state’s conservation improvement programs
and Breath Report (produced jointly by the
established an energy efficiency resource standard
Minnesota Pollution Control Agency and the
requirement (EERS) for utilities that requires annual
Minnesota Department of Health) estimated
reductions in energy sold by utilities through
that air pollution contributed to about 6 to 13%
end-use efficiency programs. This policy has
of all Twin Cities deaths in 2008 . Air pollution in
successfully reduced energy consumption and
Minnesota also creates haze that impacts views
demand, saving individuals and businesses money .
in even the wildest and most remote parts of
The program could be expanded by increasing the
the state . Further, mercury deposits from coal-
standard:
fired power plants (in and out of state) impact
aquatic ecosystems and the health of people • Electric utilities could increase the EERS to 2
who consume fish. Reducing the amount of coal or 2 .5% with the ability to count electric energy
burned reduces air and water pollution in the state . savings from energy utility infrastructure
improvements and electricity displaced by
During extreme weather events, the electric grid
combined heat and power projects (CHP) on top
can be knocked out for hours or days, impacting
of a minimum savings goal of 1 .5% from end-use
critical services and disrupting commerce .
efficiency.
Renewable energy installations on-site can be
designed to go into “island mode” to continue • Gas utilities could retain the EERS of 1 .5%,
to power buildings and operations independent with a minimum savings goal of 1% for end use
of the larger electric grid system . These types efficiency and the addition of CHP as an eligible
of microgrid installations improve resiliency technology that could satisfy the remaining 0 .5%
to extreme weather and other electric grid requirement .
disruptions .
Climate Solutions and Economic Opportunties 25Climate Action Policies - Immediate-Impact Policies
CHP systems, relative to separate heat and power
58% of the total energy technologies, and by avoiding transmission and
distribution losses associated with moving power
consumed in Minnesota is lost
from central power stations that are located far
through inefficiencies away from the point of electricity end use .
Encouraging an increase in the use of CHP could
• In addition to the demand-side management be achieved through several existing statutes:
requirements through the EERS, natural gas
• Conservation Improvement Program (Minnesota
utilities and electric utilities could be required
Statute 216B.241) – Expand electricity and
to meet a CHP standard that is embedded in
natural gas utility Conservation Improvement
the EERS . Collectively, the natural gas utilities
Program goals to promote use of CHP systems,
could be required to meet a CHP goal of 34
including encouragement of electric or natural
million British Thermal Units of displaced fossil
gas utility-owned CHP as well as incentives for
fuel by 2030 . Collectively, the electric utilities
implementation of non-utility owned CHP .
could be required to meet a CHP goal of 800
MW by 2030 . • Renewable Electricity Standard (Minnesota
Statute 216B.1691) – Expand the Renewable
Increasing the state’s energy efficiency
Electricity Standard (RES) to include a specific
requirements to 2 or 2 .5% would reduce
goal for currently eligible CHP technologies, and
significant greenhouse gas emissions, making up
incorporate additional provisions for RES credit
between 5 and 10% of the emission reductions
to encourage use of biomass for thermal energy
needed to be on target in 2030 . This policy
production without power production in areas of
also has economic and health benefits. Energy
the state without access to natural gas service .
efficiency saves homeowners, business owners,
and utility ratepayers money . In addition, this • Integrated Resource Planning (Minnesota
policy is projected to create on average over Statute 216B.2422) – Require that electric
1,500 jobs annually . It would also lead to the utilities demonstrate that they have considered
health and environmental benefits of reducing CHP opportunities before they propose building
coal and natural gas burning in the state . new generation capacity .
Combined heat and power In addition, the following are needed to support CHP:
• Technical assistance for utilities and industry to
analyze feasibility and apply implementation
actions to commercialize high-performing CHP
and other thermal recovery and advanced clean
Combined heat and power (CHP) systems reduce
energy technologies
fossil fuel use and greenhouse gas emissions
by recovering heat for useful purposes that • Revision of standby rate practices
would otherwise be wasted as reject heat in
power plants . CHP systems can use this “waste” • Update of state rules on application of the
energy for heating buildings, domestic hot water, capacity credit for avoided cost .
industrial processes, or for conversion to electric • Establishment of clear and consistent
generation . Additional reductions are achieved interconnection standards based on best- known
both through the improved efficiency of the practices
26 Climate Solutions and Economic OpportuntiesYou can also read