Impact of Athabasca oil sands operations on mercury levels in air and deposition
←
→
Page content transcription
If your browser does not render page correctly, please read the page content below
Atmos. Chem. Phys., 21, 12783–12807, 2021
https://doi.org/10.5194/acp-21-12783-2021
© Author(s) 2021. This work is distributed under
the Creative Commons Attribution 4.0 License.

Impact of Athabasca oil sands operations on
mercury levels in air and deposition
Ashu Dastoor1 , Andrei Ryjkov1 , Gregor Kos2 , Junhua Zhang3 , Jane Kirk4 , Matthew Parsons5 , and
Alexandra Steffen3
1 Air Quality Research Division, Environment and Climate Change Canada, 2121 Trans-Canada Highway,
Dorval, Québec, Canada
2 Department of Chemistry and Biochemistry, Concordia University, 7141 Sherbrooke Street West, Montreal, Québec, Canada
3 Air Quality Research Division, Environment and Climate Change Canada, 4905 Dufferin Street, Toronto, Ontario, Canada
4 Aquatic Contaminants Research Division, Environment and Climate Change Canada,

867 Lakeshore Road, Burlington, Ontario, Canada
5 Meteorological Service of Canada, Environment and Climate Change Canada,

9250 49 Street NW, Edmonton, Alberta, Canada

Correspondence: Ashu Dastoor (ashu.dastoor@canada.ca)

Received: 6 April 2021 – Discussion started: 3 May 2021
Revised: 14 July 2021 – Accepted: 15 July 2021 – Published: 30 August 2021

Abstract. Oil sands upgrading facilities in the Athabasca oil     Hg emissions from wildfire events led to episodes of high
sands region (AOSR) in Alberta, Canada, have been report-         ambient Hg(0) concentrations and deposition enrichments
ing mercury (Hg) emissions to public government databases         in northern Alberta, including the AOSR, during the burn-
(National Pollutant Release Inventory (NPRI)) since the year      ing season. Hg deposition fluxes in the AOSR were within
2000, yet the relative contribution of these emissions to ambi-   the range of the deposition fluxes measured for the entire
ent Hg deposition remains unknown. The impact of oil sands        province of Alberta. On a broad spatial scale, contribution
emissions (OSE) on Hg levels in and around the AOSR, rel-         from imported Hg from global sources dominated the annual
ative to contributions from global (anthropogenic, geogenic       background Hg deposition in the AOSR, with present-day
and legacy) emissions and regional biomass burning emis-          global anthropogenic emissions contributing to 40 % (< 1 %
sions (BBE), was assessed using a global 3D-process-based         from Canada excluding OSE) and geogenic and legacy emis-
Hg model, GEM-MACH-Hg, from 2012 to 2015. In addi-                sions contributing to 60 % of the background Hg deposi-
tion, the relative importance of year-to-year changes in Hg       tion. In contrast, oil sands Hg emissions were responsible
emissions from the above sources and meteorological con-          for significant enhancements in Hg deposition in the imme-
ditions to inter-annual variations in Hg deposition was ex-       diate vicinity of oil sands Hg emission sources, which were
amined. Surface air concentrations of Hg species and annual       ∼ 10 times larger in winter than summer (250 %–350 % in
snowpack Hg loadings simulated by the model were found            winter and ∼ 35 % in summer within 10 km of OSE, 2012–
comparable to measured levels in the AOSR, suggesting con-        2013). The spatial extent of the influence of oil sands emis-
sistency between reported Hg emissions from oil sands ac-         sions on Hg deposition was also greater in winter relative to
tivities and Hg levels in the region. As a result of global-      summer (∼ 100 km vs. 30 km from Hg-emitting facilities). In
scale transport and the long lifetime of gaseous elemental        addition, inter-annual changes in meteorological conditions
Hg (Hg(0)), surface air concentrations of Hg(0) in the AOSR       and oil sands emissions also led to significantly higher inter-
reflected the background Hg(0) levels in Canada. By com-          annual variations in wintertime Hg deposition compared to
parison, average air concentrations of total oxidized Hg (effi-   summer. In 2015, within 10 km of major oil sands sources,
ciently deposited Hg species) in the AOSR were elevated up        relative to 2012, Hg deposition declined by 46 % in winter
to 60 % within 50 km of the oil sands Hg emission sources.        but 22 % annually, due to a larger OSE-led reduction in win-

Published by Copernicus Publications on behalf of the European Geosciences Union.
12784                                                             A. Dastoor et al.: Impact of Athabasca oil sands operations

tertime deposition. Inter-annual variations in meteorological
conditions were found to both exacerbate and diminish the
impacts of OSE on Hg deposition in the AOSR, which can
confound the interpretation of trends in short-term environ-
mental Hg monitoring data. Hg runoff in spring flood, com-
prising the majority of annual Hg runoff, is mainly derived
from seasonal snowpack Hg loadings and mobilization of Hg
deposited in surface soils, both of which are sensitive to Hg
emissions from oil sands developments in the proximity of
sources. Model results suggest that sustained efforts to re-
duce anthropogenic Hg emissions from both global and oil
sands sources are required to reduce Hg deposition in the
AOSR.
                                                                    Figure 1. Spatial distribution of anthropogenic Hg emissions in
                                                                    Canada in 2015 (∼ 4.3 t yr−1 ). The Athabasca oil sands region is
                                                                    indicated with an approximate rectangular blue shape within north-
                                                                    eastern Alberta, bordering Saskatchewan.
1   Introduction

Mercury (Hg) is a toxic element that accumulates in fish and
mammals near the top of the food web, including humans              atmospheric oxidation of GEM are the dominant pathways
(e.g., through consumption of contaminated fish), where it          of Hg removal (Obrist et al., 2016; Wright et al., 2016; Zhou
exhibits long-term toxic effects (UNEP, 2018). Hg is emitted        et al., 2021). Primary emissions of GOM and PBM from in-
to the atmosphere from geogenic sources such as volcanoes           dustrial sources are an important contributor to dry and wet
and the weathering of Hg-containing rocks; anthropogenic            depositions of Hg on a local to regional scale. Once Hg is de-
sources such as fossil fuel burning, metal smelting and ar-         posited to surfaces, it can be reduced and re-emitted back as
tisanal gold mining; and the re-emission of Hg historically         GEM to the air, and, thus, Hg redistributes and accumulates
deposited from anthropogenic and natural sources onto soils,        in the aquatic and terrestrial environments globally. Hg also
surface waters and vegetation (UNEP, 2013). Atmospheric             inhibits enzymatic processes and reacts with organic com-
Hg exists mainly in three forms: gaseous elemental mercury          pounds. This leads to the formation of toxic, and bioaccumu-
(Hg(0) or GEM), gaseous oxidized mercury (gaseous Hg(II);           lating, methyl-Hg, primarily in aquatic systems, which is the
GOM) and particle-bound mercury (particle-bound Hg(II);             principal cause of a severe neurological syndrome known as
PBM). The sum of GOM and PBM is referred to as total                “Minamata disease”. In order to reduce the amount of Hg re-
oxidized mercury (TOM), and the sum of gaseous mercury              leased to the environment and limit its exposure to humans,
species (i.e., GEM and GOM) is referred to as total gaseous         an international treaty, the Minamata Convention on Mer-
mercury (TGM) in this study. GEM/TGM and TOM are bet-               cury, was adopted in 2017 (UN, 2017).
ter indicators to compare observation and model estimates of           Anthropogenic emissions of Hg to air from global sources
mercury for the purpose of this study, because of speciation        stand at an estimated 2220 t yr−1 in 2015 (UNEP, 2018).
uncertainties associated with the determination of GOM and          Canadian anthropogenic Hg emissions were estimated at
PBM species (Gustin et al., 2013). Deposition of atmospheric        about 4.3 t yr−1 (less than 0.2 % of global anthropogenic
Hg species by rain and snow (i.e., wet deposition) and by in-       emissions) in 2015, with an estimated 58 % coming from
terfacial uptake on various surfaces such as soils, vegetation,     point sources such as coal-fired power plants and smelters
water and snowpack (i.e., dry deposition) are the pathways          and 42 % from area sources (Zhang et al., 2018; see Fig. 1).
that contribute to Hg loadings in ecosystems. Typically, at-        Anthropogenic Hg emissions in Canada have declined by
mospheric GEM concentrations are found to be 2–3 orders of          85 % from 1990 to 2010 (from ∼ 35 to 5 t yr−1 ), with ma-
magnitude higher (in the low ng m−3 range) than GOM and             jor reductions from sectors such as the non-ferrous metal
PBM (typically in the lower pg m−3 range) because GEM is            mining and smelting (−98 %), chemical industries (−95 %),
the dominant atmospheric Hg species emitted to air, and the         waste (−76 %), iron and steel industries (−54 %), and elec-
reactivity of the latter (GOM and PBM) leads to efficient dry       tric power generation (−30 %) (CMSA, 2016). However, due
and wet deposition removal of these species close to sources.       to the steady increase in development of the oil sands, the up-
Stability and volatility of GEM result in its long lifetime in      stream petroleum sector has shown increases in Hg emissions
the atmosphere, of 6 months to 1 year, allowing for trans-          and accounted for approximately 4.6 % of the total Canadian
port and distribution on a global scale and re-emission from        Hg emissions in 2010 (CMSA, 2016).
planetary surfaces (UNEP, 2013).                                       The Athabasca oil sands region (AOSR) in the northeast-
   On a global scale, dry deposition of GEM by vegetation           ern portion of the Canadian province of Alberta (see Fig. 1) is
uptake over land and wet deposition of TOM produced by              a zone of extensive natural resource development. The large

Atmos. Chem. Phys., 21, 12783–12807, 2021                                            https://doi.org/10.5194/acp-21-12783-2021
A. Dastoor et al.: Impact of Athabasca oil sands operations                                                                12785

                                                                   ilar set of observations was made for Hg in surface snow
                                                                   samples, more specifically Hg bound to particulates. Con-
                                                                   centrations in accumulated snow collected near oil sands de-
                                                                   velopments in March averaged 861 ng m−2 compared to less
                                                                   than 100 ng m−2 for background measurements (Kelly et al.,
                                                                   2010). Several oil sands installations were identified as po-
                                                                   tential sources for the elevated observations of Hg, but no di-
                                                                   rect link between sources and observations was established.
                                                                   Specifically, upgraders were discussed as a source for high
                                                                   Hg levels in the region. Other potential sources included fly
                                                                   ash, road dust, land clearing and mining operations.
                                                                      To address the lack of Hg monitoring and attribution of
                                                                   sources, as concluded by Kelly et al. (2010), several follow-
                                                                   up studies were conducted with the intention to establish a
                                                                   conclusive link between measured pollutant concentrations
                                                                   and potential sources in the AOSR (Kelly et al., 2010; Cooke
                                                                   et al., 2017; Kirk et al., 2014; Emmerton et al., 2018; Ly-
                                                                   nam et al., 2018; Willis et al., 2019, 2018; Gopalapillai et
                                                                   al., 2019). In addition to water and snow samples, other me-
                                                                   dia have been investigated, such as air, biota and sediments.
                                                                   Cooke et al. (2017) studied lake sediment cores sampled
Figure 2. Map of the AOSR with the main point sources for Hg       from 20 lakes at various distances from oil sands operations,
emissions from oil sands developments and air observation sites.   including two of them in the near vicinity (i.e., within 20 km)
“AR6” marks the approximate midpoint of operations as defined by   of the two major upgrading facilities (Suncor and Syncrude)
Kelly et al. (2010).                                               within the region (or site AR6 as designated by Kelly et al.,
                                                                   2010) (Cooke et al., 2017). The cores provided trace metal
                                                                   data for approximately the past 100–250 years. The cores
natural deposits of bitumen, a heavy crude oil, contained in       showed that Hg concentrations have increased by a factor
a mixture of water and clay (called “oil sands”) has led to        of 3, reflecting the generally accepted scientific finding that
establishment of large-scale mining and upgrading activi-          global Hg has increased 3-fold as a result of anthropogenic
ties in the area north of Fort McMurray, Alberta (AB) (see         activities since the industrial revolution. No additional in-
map Fig. 2). Surface mining and in situ recovery methods           crease in Hg concentrations was detected related to the begin-
are used to extract bitumen and then upgrade it to synthetic       ning of oil sands operations in the late 1960s. This contrasts
crude oil (Alexander and Chambers, 2016; Larter and Head,          with Kelly et al. (2010) and the follow-up study by Kirk et
2014). Point source emissions of organics and heavy metals,        al. (2014) that showed higher Hg loadings in the accumulated
including Hg, originate from mining activities and upgrad-         snowpack and surface water sampled closer to the mining
ing facilities in the AOSR. The upgraders are operated by          and upgrading facilities in the AOSR in early spring (March),
the companies Suncor, Syncrude and Canadian Natural Re-            mostly consisting of PBM of atmospheric origin. While Hg
sources. The upgrading process also includes the removal of        levels were closely correlated with other trace metal concen-
impurities consisting of sulfur and nitrogen-containing com-       trations originating from oil sands activities such as nickel
pounds by catalytic hydrotreatment, with volatile hydrogen         and vanadium, no direct causal link with air emissions of
sulfide and ammonia as by-products. Trace metals contained         Hg, as reported to the National Pollutant Release Inven-
in the heavy asphaltene fraction are also removed by stabi-        tory (NPRI), was established. Gopalapillai and coworkers
lization, rejection, or upgrading of asphaltenes (Jia, 2014).      recently reported temporal trends in snowpack loadings of
The yearly amounts of total Hg emissions from Athabasca            total Hg (THg) and methyl mercury (MeHg) (and 44 other
oil sands facilities, for the years 2012 to 2015, were between     elements) (Gopalapillai et al., 2019). Using a composite of
69 and 25 kg. These annual emissions exhibited an overall          snowpack profile samples collected between 2011 and 2016
downward trend (for details see Table 1 and Fig. 3).               and data from previous campaigns, a decrease in THg load-
   Kelly et al. (2010) reported increased concentrations of        ings from an average of 510 ng m−3 in 2008 to 175 ng m−3
13 different trace metals including Hg in the surface wa-          in 2016 was found within 8 km from AR6. However, due to
ters of the Athabasca River and its tributaries in the oil         the limited temporal coverage (with measurements for THg
sands region. Observed concentrations were higher near oil         starting in 2008), the authors suggested a need for additional
sands operations than away from the potential sources. Com-        studies to understand the impact of Hg in the AOSR.
parison of upstream and downstream data showed consis-                A recent study by Emmerton et al. (2018) examined lake
tently higher concentrations for downstream sites. A sim-          water samples and related observed Hg and methyl-Hg con-

https://doi.org/10.5194/acp-21-12783-2021                                        Atmos. Chem. Phys., 21, 12783–12807, 2021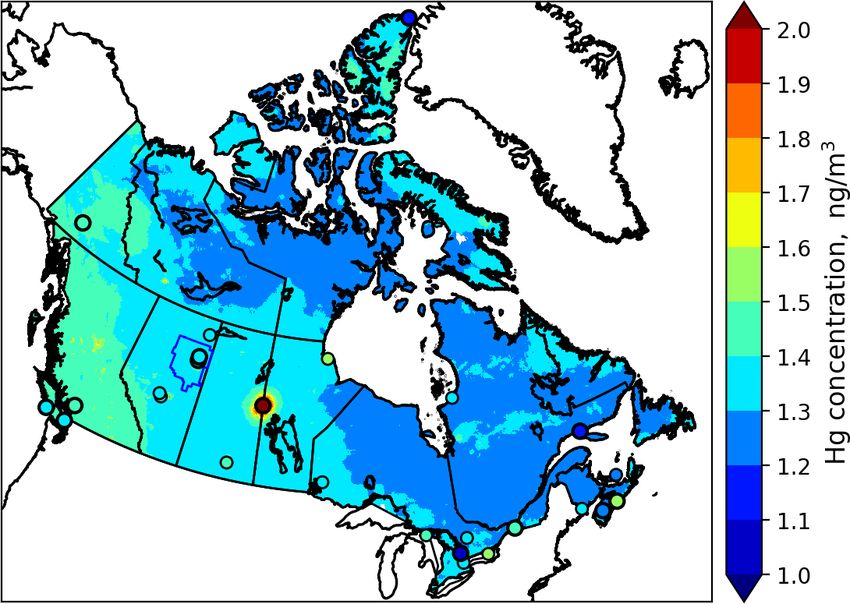
12786                                                              A. Dastoor et al.: Impact of Athabasca oil sands operations

centrations to local geology, watershed conditions and oil           air concentrations and deposition and how the pollutant bur-
sands activities, with the latter only contributing an estimated     den changes as industrial activity and related emissions vary
< 2 % of the overall Hg deposited (Emmerton et al., 2018).           (UNEP, 2008; CMSA, 2016; UNEP, 2018). Model processes
Long-range transport and biomass burning (i.e., forest fires)        are typically constrained by evaluating simulated pollutant
were suggested to be the major sources of Hg (Emmerton               levels using observation data from ground-based monitor-
et al., 2018). Similarly, in a recent study of wet deposition        ing networks and research campaigns. Additionally, aircraft
data by Lynam et al. (2018), very low fluxes of Hg deposi-           measurement data provide observation data on the vertical
tion were calculated, though the study sites used (AMS6, the         scale.
Patricia McInnes observation site shown in Fig. 1) were lo-             Wildfires are important sources of Hg in northwestern
cated further away from emitters. Results suggested that dry         Canada, and climate change is intensifying their frequency
deposition could, instead, be a more important pathway of            (Fraser et al., 2018). Biomass burning primarily releases
Hg removal in the region (Lynam et al., 2018).                       legacy Hg previously deposited to foliage and soils (Friedli
   In an effort to explain the elevated Hg concentrations            et al., 2001; De Simone et al., 2015). Using multivariate data
found in the snowpack and waters near oil sands mining               analysis, Parsons et al. (2013) determined the contribution
and upgrading activities, tailings ponds were studied as a           from local sources (i.e., oil sands activities) to be minimal
potential source of Hg emissions related to oil sands activ-         compared to total gaseous Hg concentrations in the air in the
ities (Willis et al., 2018). However, the water in these ponds       AOSR; however, the authors noted significant episodes of re-
(i.e., the non-recycled portion of process water used to pro-        gional forest fires impacting the observed Hg concentrations
cess mined bitumen) was found to be an insignificant source          in the air during the summer months (Parsons et al., 2013).
of THg and MeHg.
   The above-mentioned studies illustrate recent progress in
the ongoing effort to examine the link between observed con-         2    Objectives
centrations and anthropogenic sources of Hg in the AOSR.
                                                                     Observations of atmospheric Hg in the AOSR are limited to
However, in addition to local emissions, multiple other
                                                                     surface air GEM concentrations and Hg loadings in snow.
sources of mercury emissions impact the region, especially
                                                                     Summertime wet and dry deposition is not measured. There-
forest fires and worldwide anthropogenic and geogenic (con-
                                                                     fore, measured estimates of annual Hg deposition in AOSR
temporary and legacy) emissions that are atmospherically
                                                                     are currently not possible. Furthermore, a quantification of
transported into the region. Owing to the much larger emis-
                                                                     the relative importance of different Hg emission sources re-
sions of Hg from worldwide sources, compared to Canadian
                                                                     sponsible for Hg loadings in the AOSR is required to prior-
sources, and the long lifetime of Hg in air, imported Hg ac-
                                                                     itize mitigation actions. The 3D mercury model, Global En-
counts for the majority of the Hg burden in Canada (CMSA,
                                                                     vironmental Multiscale – Modelling Air quality and CHem-
2016), rendering the assessment of the impacts of domestic
                                                                     istry – Mercury (GEM-MACH-Hg), was applied to develop
Hg emissions challenging using measurements alone. While
                                                                     a comprehensive understanding of atmospheric Hg and de-
Cooke et al. (2017) investigated the history of Hg deposition
                                                                     position levels and pathways and the role of emissions from
in lake catchments via the study of sediment cores, only two
                                                                     Athabasca oil sands activities (particularly from bitumen up-
lakes sampled were close enough (within 20 km) to oil sands
                                                                     graders) in the spatiotemporal distribution of Hg deposition
activities, whereas most sites were 20 to > 50 km away from
                                                                     in AOSR. This study addresses the following questions:
the oil sands facilities.
   After Hg is emitted to air from oil sands mining and up-              1. How do air concentrations and ecosystem loadings
grading activities, transport, transformation and deposition                of Hg species in AOSR compare to other regions in
processes determine the distribution and amounts of Hg de-                  Canada?
posited to environmental media such as vegetation, soils and
water bodies. The 3D process-based predictive atmospheric                2. What is the level and geographical extent of the contri-
composition models include process representations (such                    bution of Athabasca oil sands emissions to Hg in air and
as atmospheric transport, chemical transformations, aerosol                 deposition?
particle formation and growth, and wet and dry deposition
of gases and particles) and simulate spatiotemporal distribu-            3. How does the impact of oil sands development on Hg
tions of pollutants in air and deposition starting from emis-               levels in the region compare with the impacts of two
sions (anthropogenic and natural) as inputs. These models                   other major sources of Hg in the region, biomass burn-
provide insight into transport and transformation pathways                  ing and global emissions?
of pollutants and causal links between emissions and con-                4. What controls the inter-annual variability in Hg levels
centrations observed in environmental media. Models have                    in AOSR?
been applied to study Hg source attribution on global and
regional scales, answering questions such as how much a              This is the first study that provides a direct connection be-
specific emission source contributes to local and regional           tween Athabasca oil sands Hg emissions and deposition of

Atmos. Chem. Phys., 21, 12783–12807, 2021                                              https://doi.org/10.5194/acp-21-12783-2021
A. Dastoor et al.: Impact of Athabasca oil sands operations 12787
Hg in and around the AOSR. A similar approach using the NT, and as far south as Red Deer, AB; the approximate west-
model GEM-MACH-Hg was previously applied to the as- ern and eastern extents of the domain are marked, respec-
sessment of Hg source apportionment at national and global tively, by Grande Prairie, AB, and Flin Flon, MB.
scales (CMSA, 2016; AMAP/UNEP, 2013; UNEP, 2018). Geogenic emissions and re-emissions of legacy Hg in
soils and oceans (∼ 4200 t yr−1 ) emitted as GEM were dis-
tributed as described in Durnford et al. (2012). Wildfire
3 The model and emission inputs biomass burning Hg emissions are represented in the model
simulations using the FINN (Fire INventory) fire emissions
GEM-MACH-Hg (Dastoor et al., 2015) is the mercury ver- products (Wiedinmyer and Friedli, 2007; Wiedinmyer et
sion of Environment and Climate Change Canada’s 3D al., 2011) together with vegetation-specific emission fac-
process-based operational air quality forecast model GEM- tors (EFs) as described in Fraser et al. (2018). FINN es-
MACH (Global Environmental Multiscale – Modelling Air timated biomass burning Hg emissions (emitted as GEM)
quality and Chemistry; Makar et al., 2018; Whaley et were ∼ 600 Mg yr−1 globally; 10.8 (2012), 11.4 (2013), 15.5
al., 2018). GEM-MACH includes emissions of gases and (2014) and 11.1 (2015) Mg yr−1 in Canada; and 13.4 (2012),
aerosols and simulates meteorological processes, aerosol mi- 10.5 (2013), 11.4 (2014) and 9.5 (2015) Mg yr−1 in the
crophysics, tropospheric chemistry, and pollutant dry and United States.
wet removal processes from the atmosphere. In addition, Contemporary global anthropogenic Hg emissions for
GEM-MACH-Hg includes emissions, chemistry, and dry and 2015 (2224 Mg yr−1 ; subdivided into GEM, GOM and PBM)
wet removal processes of three Hg species (GEM, GOM and developed by the Arctic Monitoring and Assessment Pro-
PBM) (Dastoor and Durnford, 2014; Dastoor et al., 2008; gramme (AMAP) (UNEP, 2018) were incorporated into the
Durnford et al., 2012; Fraser et al., 2018; Kos et al., 2013; model for the global-scale simulations. For NA and AOSR
Zhou et al., 2021). The recent version of GEM-MACH-Hg, domains, GEM-MACH-Hg includes monthly and diurnally
previously applied to the investigation of the importance varying anthropogenic Hg emissions in Canada developed
of biomass burning emissions to the Hg burden in Canada by Zhang et al. (2018), based on the NPRI (NPRI, 2019) for
(Fraser et al., 2018) and the role of vegetation Hg uptake the major point sources and the 2010 Air Pollutant Emis-
(Zhou et al., 2021), was used in this study. Oxidation of sion Inventory (APEI, 2019) for the area sources. Anthro-
GEM and gas–particle partitioning of oxidized Hg species pogenic Hg emissions in the United States included in GEM-
(GOM and PBM) are the main chemical transformation pro- MACH-Hg were based on the 2011 National Emissions In-
cesses, and dry deposition of GEM, GOM and PBM and ventory (NEI) (EPA), described in Zhang et al. (2018). Total
wet deposition of GOM and PBM are the major removal anthropogenic emissions of Hg in Canada, the United States
pathways of Hg in the model. Since observations of snow- and worldwide were 4.3, 47 and 2224 Mg yr−1 , respectively.
pack Hg loadings at the end of the winter season are uti- The GEM : GOM : PBM ratio in the total anthropogenic Hg
lized for model evaluation in this study, a detailed represen- emissions was approximately 70 % : 23 % : 7 %.
tation of the air–cryosphere Hg exchange and transforma- For the Hg emissions related to oil sands activities, the
tion processes is important. GEM-MACH-Hg includes a dy- model’s input consisted only of NPRI-reported air emis-
namic multilayer air–snowpack–meltwater Hg parameteriza- sions. Possibility of fugitive dust from the disturbed land-
tion, representing Hg accumulation by precipitation and dry scape due to oil sands activities as a source of particulate-
deposition to snowpacks, vertical diffusion and redox reac- bound Hg emissions was noted by Kirk et al. (2014). Cooke
tions in snowpacks, and re-volatilization and meltwater run- et al. (2017) were unable to detect Hg from dust emissions
off of Hg species (Durnford et al., 2012). Geospatially dis- in lake sediments. Comparison of modelled and observed
tributed global, regional and local emissions of Hg species Hg levels conducted in this study allowed an assessment of
(GEM, GOM and PBM) to air from primary geogenic and whether NPRI-reported oil sands emissions and area sources
anthropogenic sources and re-emissions of previously de- (APEI) in AOSR capture Hg emissions in the region compre-
posited Hg (legacy Hg) from terrestrial and oceanic surfaces hensively or whether there are other yet undetermined impor-
are included in the model. tant sources of Hg emissions such as from fugitive dust in the
Three geographical domains were utilized for the model AOSR.
simulations in this study: global, North America (NA) and NPRI is a mandatory reporting tool for a wide range of
AOSR. A geospatial resolution of 10 km was chosen for the contaminants, including Hg, as prescribed by the Canadian
NA domain, and its boundary conditions were determined Environmental Protection Act. Facilities are required to re-
by the global simulations conducted at 1◦ × 1◦ latitude– port Hg releases, if total work hours exceed 20 000 and if
longitude resolution. Model simulations for the AOSR were a reporting threshold of 5 kg yr−1 is met for Hg and Hg-
carried out at a finer geospatial resolution of 2.5 km for an containing compounds that were manufactured, processed or
extended AOSR domain with the approximate midpoint ad- otherwise used (includes by-products) or contained in tail-
jacent to the two largest upgrading facilities (called “AR6”) ings and waste rock. For the AOSR domain, Hg emissions
(Kelly et al., 2010) and extending as far north as Hay River, were updated in the model from 2012 to 2015 using the
https://doi.org/10.5194/acp-21-12783-2021 Atmos. Chem. Phys., 21, 12783–12807, 202112788 A. Dastoor et al.: Impact of Athabasca oil sands operations
zeroing out emissions from these sources in controlled sim-
ulations on North America and global model domains, re-
spectively. Source apportionment of the anthropogenic Hg
deposition from worldwide sources was conducted using a
series of global-scale controlled simulations by zeroing out
anthropogenic Hg emissions in different source regions. In
addition, controlled model simulations were performed to
estimate the individual influences of meteorology, biomass
burning emissions and oil sands emissions on the interan-
nual variations in Hg deposition in the AOSR by successively
adding these three temporal changes in 2013–2015.
Figure 3. Time series of total Hg emissions from oil sands pro- 5 Mercury observations in the AOSR
cessing facilities in the AOSR. Data were compiled from the
NPRI database. Numerical values and individual contributions from
Simulated air concentrations and deposition of Hg were eval-
2012–2015 are available in Table 1.
uated with observations of Hg in air and snowpack in the
AOSR. These measurements were recorded with instruments
NPRI point source Hg emissions data for each year. A sum- deployed for air quality monitoring purposes and to study
mary of Hg emissions from Athabasca oil sands upgrading the atmospheric deposition of Hg species in the AOSR (Par-
facilities (NPRI) for 2012–2015 and the temporal trend from sons et al., 2013; Kirk et al., 2014; Gopalapillai et al., 2019).
2004–2017 are available in Table 1 and Fig. 3, respectively. Air measurements were carried out at three sites in the
Based on NPRI, total anthropogenic Hg emissions in Canada AOSR: Patricia McInnes (2010–2018), Fort McKay (2014–
from the province of Alberta were 605 kg in 2015. Among 2018) and Lower Camp (2012–2014). Measurements were
these, fossil fuel burning activities such as coal-fired power made using Tekran 2537 Hg analysers for GEM and Tekran
plants, waste incineration facilities and other fossil fuel com- 1130/1135/2537 systems for speciated Hg (GOM and PBM)
bustion contributed an estimated 221, 120 and 72 kg, respec- fitted with PM2.5 and PM10 inlets (see map in Fig. 2 for
tively, which represents 68 % and, therefore, the bulk of total equipment placement and Figs. 4–6 for data). Standard op-
anthropogenic Hg emissions in Alberta. Iron and steel pro- erating procedures were provided by the Canadian Atmo-
duction together with the cement industry (emitting 55 and spheric Mercury Measurement Network (CAMNet; Steffen
46 kg, respectively) contribute another 14 %, and oil sands and Schroeder, 1999). Air measurements of oxidized Hg con-
upgrading was a minor contributor (∼ 25 kg) in 2015. centrations were carried out at only one site near Fort McKay
in 2015 (Parsons et al., 2013). Since Hg deposition to snow
is mainly derived from the ambient oxidized Hg concentra-
4 Model simulations tions, observations of snowpack Hg loadings provide addi-
tional constraint for modelled oxidized Hg concentrations in
Base model simulations at the three model simulation do- air.
mains (i.e., global, NA and AOSR) were performed using all Snow samples were collected from 2012 to 2015 at 454
sources of Hg emissions (as described earlier) and meteoro- sites located at varying distances from the major upgrading
logical conditions for the respective years from 2010–2015 facilities (< 1–231 km) to estimate total seasonal Hg load-
to allow evaluation of modelled air concentrations with mea- ings in surface snow in the AOSR (Gopalapillai et al., 2019;
sured air concentrations for all available years in the AOSR. Kirk et al., 2014). Specifically, 90 (2012), 86 (2013), 140
Snowpack Hg measurements in the AOSR started in 2012. (2014) and 138 (2015) samples were obtained from sites lo-
Thus, the model–measurement comparison of snowpack Hg cated close to the AOSR emission sources (< 25 km) and
and the oil sands Hg emissions impact study was conducted at background sites further away from sources (> 120 km).
for the years 2012–2015. Sample collection was carried out in early to mid-March of
Multiple controlled model simulations from 2012–2015 each year at approximate maximum snowpack depth based
were performed choosing appropriate geographic domains on Environment and Climate Change Canada’s National Cli-
to assess the relative role of Athabasca oil sands Hg emis- mate Data and Information Archive historical snow accu-
sions on Hg burden in the AOSR. The impact of Athabasca mulation data (GoC, 2019). Kirk et al. (2014) employed
oil sands emissions was assessed by zeroing out emissions ultra-clean handling and analysis protocols while taking care
of Hg from oil sands facilities in a controlled simulation to avoid local contamination from transportation since sites
using the AOSR domain. Contributions of Hg emissions were accessed by helicopter and snowmobile. Mercury anal-
from biomass burning (in North America) and global anthro- ysis in the snow was carried out using cold vapour atomic
pogenic sources to the AOSR Hg levels were obtained by fluorescence spectroscopy (Willis et al., 2018; Kirk et al.,
Atmos. Chem. Phys., 21, 12783–12807, 2021 https://doi.org/10.5194/acp-21-12783-2021A. Dastoor et al.: Impact of Athabasca oil sands operations 12789
Table 1. Athabasca oil sands Hg emissions (all in kg yr−1 ) reported to NPRI by oil sands processing facilities and used in the model. For the
location of facilities in the AOSR see Fig. 2.
Facility Latitude (◦ ) Longitude (◦ ) 2012 2013 2014 2015
Suncor Energy 57.0033 111.466 35 37 0.439 –
Syncrude – Mildred Lake 57.0405 111.619 17 23 30 9.9
Imperial Oil Resources – Cold Lake 54.597 110.399 7 7.4 8.8 11
Imperial Oil Resources – Kearl 57.3969 111.071 – 1.1 4.3 4
Sum of all four sources 59.0 68.5 43.5 24.9
2014; EPA, 1996; Bloom and Crecelius, 1983). The deter- tured the observed seasonal cycle (typical in the North-
mined snowpack Hg loading at the end of the winter sea- ern Hemisphere) with spring maxima and autumn minima,
son represents the lower limit of the net wintertime dry and shaped mainly by surface fluxes of Hg such as the domi-
wet deposition of Hg. Hg deposited to snowpacks is partially nance of re-emission fluxes of Hg from snow in winter and
reduced and re-volatilized to the air and lost during intra- spring and uptake of Hg by vegetation in summer and autumn
seasonal snowpack melting. Summertime measurements of (Zhou et al., 2021). Transport of Hg from biomass burn-
Hg deposition by scavenging in rain and direct uptake by ing (i.e., wildfires) events in northern and western Canada
vegetation, soils and waters were unavailable for model eval- yielded distinct Hg concentration peaks in TGM concen-
uation. trations in the AOSR (Figs. 4–6). For 2011, biomass burn-
ing provided a large contribution to overall TGM concentra-
tions, which peaked during these events at Patricia McInnis;
6 Results and discussion however, no concurrent observations were available for the
months of May and June. During the large wildfire events
6.1 Evaluation of model-simulated mercury in 2012 and 2015 (June–July), daily averaged TGM con-
concentrations in air centrations were generally < 2.5 ng m−3 , which were accu-
rately reproduced by the model. However, as shown in Fig. 5
GEM-MACH-Hg has been extensively evaluated with com- for the Lower Camp site in August 2013, there are dis-
prehensive worldwide (including Canada) observations, crepancies between modelled and observed wildfire events.
inter-compared with other Hg models and applied to mer- The impacts of biomass burning emissions on Hg burden in
cury assessments in previous studies (Angot et al., 2016; Canada and the uncertainties in wildfire Hg emissions asso-
Bieser et al., 2017; Dastoor et al., 2008; Dastoor and Durn- ciated with the characterization of wildfire events and emis-
ford, 2014; Durnford et al., 2010, 2012; Fraser et al., 2018; sion levels using satellite and field data were described in
Kos et al., 2013; Travnikov et al., 2017; Zhou et al., 2021; a previous study (Fraser et al., 2018). Low TGM concen-
AMAP, 2013; CMSA, 2016; UNEP, 2018). Model evalua- tration events in winter and early spring, such as those in
tion of ambient Hg in the AOSR is presented in this study. March 2014 at Patricia McInnis, were typically associated
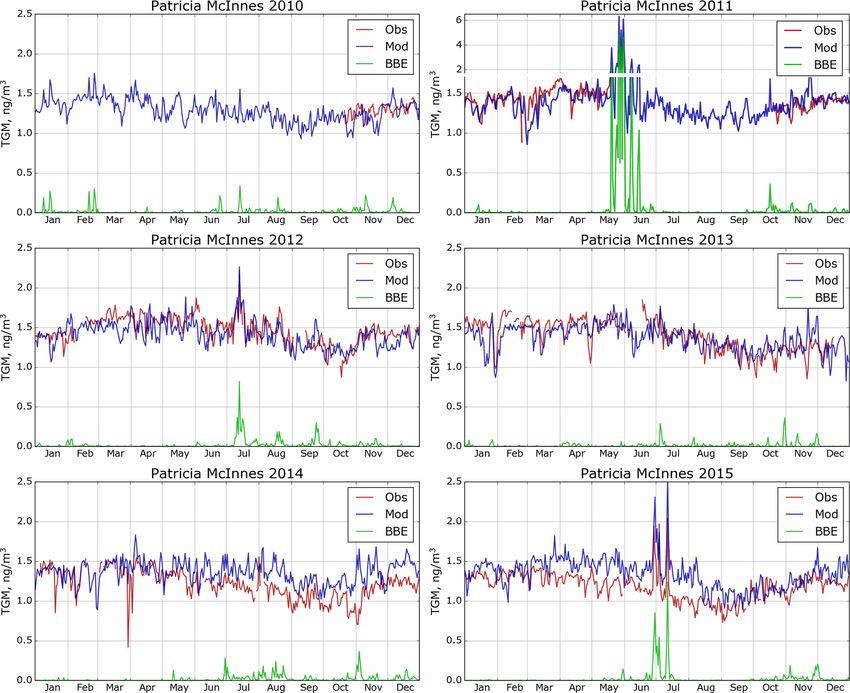
Figures 4–6 provide a comparison of simulated (blue trace) with clean air masses coming from the Arctic in AOSR.
and observed (red trace) daily averaged TGM concentra- Model–measurement agreement of TGM levels in the air is
tions in air at the three observation sites (Fig. 4: Patricia within the respective model and measurement uncertainties
McInnis, 2010–2015; Fig. 5: Lower Camp, 2012–2014; and and indicates that reported Hg emissions from AOSR facili-
Fig. 6: Fort McKay, 2014–2015) and how the model captured ties are reasonable.
biomass burning emissions (BBE) (green traces show mod- GOM and PBM observations were conducted at Fort
elled biomass burning contributions to TGM concentrations). McKay (a region dominated by natural boreal forest) us-
While some observations are incomplete (e.g., June 2013, ing PM2.5 (captures particle sizes < 2.5 µm) and PM10 (cap-
Patricia McInnis), the data provide a detailed picture of TGM tures particle sizes < 10.0 µm) inlets in AOSR for 2015,
surface concentrations near oil sands activities (see Fig. 2 but significant measurement data gaps were present partic-
for details). In general, data from all three observation sites ularly in winter and spring. Observed annual average con-
and model simulation results agreed well with an average centrations were 1.02 ± 2.59 (GOM) and 3.47 ± 4.79 pg m−3
squared Pearson correlation coefficient of 0.6 and measured (PBM) using the PM2.5 inlet and 0.60 ± 1.11 (GOM) and
and modelled median TGM concentrations (±standard devi- 4.25 ± 8.23 pg m−3 (PBM) using the PM10 inlet in 2015;
ation) of 1.34 ± 0.21 and 1.39 ± 0.17 ng m−3 (2011–2015) at these observations suggest a dominance of PBM in fine par-
Patricia McInnis, 1.36 ± 0.17 and 1.36 ± 0.18 ng m−3 (2013) ticles (< 2.5 µm) at the Fort McKay site (17 km northwest
at Lower Camp, and 1.22 ± 0.23 and 1.33 ± 0.19 ng m−3 of AR6). The model-simulated and observed average TOM
(2014–2015) at Fort McKay, respectively. The model cap- air concentrations and standard deviation (±1σ ) in 2015
https://doi.org/10.5194/acp-21-12783-2021 Atmos. Chem. Phys., 21, 12783–12807, 202112790 A. Dastoor et al.: Impact of Athabasca oil sands operations
were 4.74 ± 5.06 and 5.74 ± 7.20 pg m−3 , respectively; ob- used dated lake sediment cores to reconstruct deposition
served data from both inlets were combined to reduce mea- trends and anthropogenic enrichment in the region, but sev-
surement gaps. Episodes of high concentrations of partic- eral correction factors needed to be applied to estimate Hg
ulate Hg (up to 72.9 pg m−3 ), occurring predominantly on deposition fluxes, and only two lakes were cored in the di-
coarse (> 2.5 µm) particles, that were absent in the modelled rect vicinity of oil sands operations. By comparison, seasonal
PBM concentrations were observed in March. The sources snowpack Hg data provide the distribution of net total Hg de-
of coarse particles in the AOSR are currently unknown, but position in the region with a large number of sampling sites
fugitive dust from pet coke piles and roads as a result of a short distance (< 25 km) away from sources. However, it
oil sands mining activities was suggested by Gopalapillai should be noted that Hg deposition in the snow is partially
et al. (2019). It should be noted that uncertainty of a fac- reduced and reemitted as well as adsorbed in surface soils
tor of 2 or higher with oxidized Hg measurements has been due to diffusion and intra-seasonal melt; therefore, snowpack
reported (Kos et al., 2013; Gustin et al., 2015). Comparable Hg represents the lower limit of net wintertime deposition.
average GOM and PBM concentrations of 1.89 ± 8.31 and Observations at the sampling sites close to sources had the
3.82 ± 4.90 pg m−3 (mean ± 1σ , 2009–2011), respectively, highest snowpack Hg loadings with decreasing concentra-
have been measured at a site 8 km from a coal-fired power tions as one moves further away from the immediate source
plant in Genesee, AB (about 500 km southwest of Fort Mc- region; the same spatial pattern was predicted by the model
Murray). Seasonal cycles at the two sites (Fort McKay and and is most evident for the years with the largest emissions
Genesee) were similar, with TOM maxima in May–June. (2012 and 2013; Fig. 8). Snow Hg contents at the background
Since Hg deposition to snow is primarily driven by the uptake sites in the Peace–Athabasca Delta region in the north were
of ambient oxidized Hg species in snowfall and snowpack, significantly lower, which was also well reproduced by the
the robustness of model-simulated oxidized Hg in air was model. The figure shows high spatiotemporal variability in
further tested by comparing modelled snowpack Hg loadings snow Hg loadings, which are related to changes in meteoro-
with measurements (see next section). logical factors as well as oil sands emissions (as discussed
For the purpose of comparing ambient GEM concentra- later). The decline in both snowfall amounts and oil sands
tions in the AOSR with other Canadian regions, Fig. 7 pro- emissions led to lower snow Hg loadings in 2014 and 2015.
vides a map of modelled annual average surface air Hg con- Figure 9 shows the model-simulated average snow depths in
centrations of GEM for Canada in 2013. In general, model- the AOSR and the observed depths at the Mildred Lake site
estimated surface air GEM concentrations agreed well with close to the Syncrude upgrader. The model simulates snow
available observations (in circles), including western Canada, amounts and interannual variations accurately. The model-
the Pacific coast and the AOSR. There is a general gradi- estimated seasonal snow accumulations were 62, 183, 104
ent in GEM concentrations from higher concentrations in and 71 cm between October to May in 2012, 2013, 2014 and
the west (1.5 ng m−3 ) to lower concentrations in the east 2015, respectively. An intense intra-seasonal melting event at
(1.3 ng m−3 ). The average air concentrations of GEM in the the end of February was predicted by the model in each year,
AOSR (1.40 ng m−3 , 2012–2015) reflected the background which is in line with observations. The largest melting event
GEM levels in Canada. The simulated large-scale pattern in occurred in 2015, which caused over half of the snow accu-
GEM concentrations is consistent with, and reflects, a domi- mulation to melt and, thus, loss of half of seasonal snowpack
nant role of trans-Pacific transport of GEM from East Asian Hg loadings. Modelled snow Hg loadings are in agreement
Hg sources into Canada and the high Arctic. GEM concen- with Gopalapillai et al. (2019), who reported a temporal de-
trations are slightly higher in major urban centres and re- crease in snow Hg loadings near-field (< 8 km from AR6),
gions of current and past anthropogenic activities such as from an average load of 510 ng m−2 in 2008 to 175 ng m−2
energy production from coal-fired power plants and mining. in 2016. Relative importance of inter-annual changes in me-
The hotspot in Fig. 7 near the Saskatchewan–Manitoba bor- teorological conditions and oil sands emissions to wintertime
der is the former copper–zinc smelter near Flin Flon, MB, Hg deposition is discussed in a later section.
which ceased operations in 2010 (Ma et al., 2012). The soils Figure 10 compares average modelled and observed snow
in the surrounding region remain heavily contaminated with Hg loadings at the sampling locations within 25, 25–50, 50–
Hg. The re-emission of accumulated legacy mercury in soils 75, 75–120 and > 120 km from AR6. Inter-annual changes in
(Eckley et al., 2013) is responsible for the highly elevated meteorology and oil sands emissions led to decreases in to-
GEM concentrations in air. tal Hg loads from 0.52 ± 0.21 to 0.22 ± 0.09 µg m−2 within
25 km of AR6 (from 2012 to 2015) in the snowpack for
6.2 Evaluation of model-simulated mercury observation and from 0.39 ± 0.21 to 0.08 ± 0.06 µg m−2 for
accumulation in snow model estimates sampled at sites. The snow Hg loadings of
up to 0.7 µg m−2 were simulated by the model in the immedi-
Figure 8 compares total Hg loadings in snow simulated by ate vicinity of Hg-emitting sources for 2012 (Fig. 8). Emitted
the model with observations (in circles) at the end of winter amounts of Hg from oil sands facilities were reported to the
for the years 2012–2015 in the AOSR. Cooke et al. (2017) NPRI with the caveat that not all emissions, e.g., emissions
Atmos. Chem. Phys., 21, 12783–12807, 2021 https://doi.org/10.5194/acp-21-12783-2021A. Dastoor et al.: Impact of Athabasca oil sands operations 12791 Figure 4. Simulated and observed daily averaged surface air TGM concentrations in AOSR for the site Patricia McInnes (2010–2015). Obs – observations; Mod – model estimation; BBE – modelled biomass burning contributions. Note the larger range of the y axis to plot the strong biomass burning event in May and June of 2011. of mercury that are part of fugitive dust releases, are captured pared to observed values in 2015. A sensitivity model sim- by the inventory. Brief episodes of Hg on larger particles ulation was conducted for 2015 by replacing NPRI reported (2.5–10 µm size) were observed at Fort McKay in late win- Hg emissions from oil sands facilities in 2015 with 2014 val- ter, likely originating from fugitive dust in the AOSR. These ues. The sensitivity model simulation matched the observed possible sources of Hg emissions and related deposition (in Hg loadings in the snow in 2015 at all distances; these re- the vicinity of sources) were not included in the model. At sults suggest that either NPRI Hg emissions from oil sands > 120 km from AR6, snowpack loadings were very low for facilities were slightly under-represented or there was an un- all years at < 0.1 µg m−2 with small inter-annual variability accounted for area source (such as from fugitive dust) of Hg and indicate background Hg concentrations at this distance. in 2015. While the strong decrease away from the source is mir- Model estimates and observations agreed well for all dis- rored in Fig. 10 for the years 2012 and 2013 (dropping tances evaluated and demonstrate the model’s ability in cor- from about 0.4 µg m−2 at sites located < 25 km from AR6 rectly simulating the impacts of changes in Hg emissions to < 0.1 µg m−2 at sites > 120 km away), the weaker signa- and physicochemical processes in the cryosphere. The high ture from Fig. 8 for the years 2014 and 2015 is more clearly variability in the observed snowpack data within 50 km of represented in Fig. 10, consistent with declines in reported AR6 indicates that there are likely other local sources around oil sands emissions (see Table 1 and Fig. 3). Modelled snow mining facilities that impact local deposition (such as fugi- Hg loadings closer to the oil sands sources were lower com- tive dust from coke pile and roads). However, modelled esti- https://doi.org/10.5194/acp-21-12783-2021 Atmos. Chem. Phys., 21, 12783–12807, 2021
12792                                                             A. Dastoor et al.: Impact of Athabasca oil sands operations

Figure 5. Simulated and observed surface air TGM concentrations in AOSR for the site Lower Camp (2012–2014). Obs – observations; Mod
– model estimation; BBE – modelled biomass burning contribution.

Figure 6. Simulated and observed surface air TGM concentrations in AOSR for the site Fort McKay (2014 and 2015). Obs – observations;
Mod – model estimation; BBE – biomass burning contributions.

mates at sampling locations agreed with observed snow Hg            (higher in the east). Figure 11 shows good agreement with
loadings within 1 standard deviation and suggest that unac-         observed wet deposition fluxes (noted in circles) in coastal
counted for sources of Hg do not have a significant impact on       (Saturna Island, BC), rural (southern Alberta) and urban ar-
deposition in the AOSR, likely due to their episodic nature         eas (Egbert, ON). While direct measurements of annual to-
as suggested by observed ambient concentrations of particle-        tal deposition fluxes are not available, the distribution of
bound mercury.                                                      Hg deposition fluxes in Canada was found to be consistent
   Comparison of modelled annual wet and total deposition           with Canada-wide lake sediment inferred deposition fluxes
(wet plus dry deposition) fluxes of Hg in the AOSR with             (Muir et al., 2009). Average annual total deposition fluxes in
other locations in Canada is presented in Fig. 11 for 2013.         the AOSR were 16.9, 15.7, 18.3 and 17.5 µg m−2 in 2012,
In general, spatial distributions of wet and total deposition       2013, 2014 and 2015, respectively, slightly higher than in
fluxes followed patterns of precipitation (high in the east,        the other regions of northern Alberta (∼ 14 µg m−2 yr−1 ) and
south and mountainous regions of Canada), industrial activi-        lower than average Hg deposition flux in southern Alberta
ties (high in southern Canada), vegetation density (boreal and      (∼ 25 µg m−2 yr−1 ). The highest deposition up to 80 µg m−2
temperate forests) and Hg transport from the United States

Atmos. Chem. Phys., 21, 12783–12807, 2021                                            https://doi.org/10.5194/acp-21-12783-2021
A. Dastoor et al.: Impact of Athabasca oil sands operations                                                                   12793

                                                                      (up to 0.9 %) in low-OSE years 2014–2015, only very close
                                                                      to the upgraders (i.e., within 2.5 km). Wildfire activities are
                                                                      highly variable from year to year and can significantly impact
                                                                      GEM concentrations in the AOSR in summertime (Fraser et
                                                                      al., 2018). Biomass burning contributed to 1.0 %–2.2 % in-
                                                                      creases in average GEM concentrations in and around the
                                                                      AOSR (Fig. 12, right panels), making biomass burning a
                                                                      more important source of GEM than OSE in the region.
                                                                      Strong regional biomass burning events led to large increases
                                                                      in GEM concentrations of up to 35 % (2012–2015) in the
                                                                      AOSR and the surrounding regions.
                                                                         While average surface air TOM concentrations in the
                                                                      AOSR were only 3.3 pg m−3 (consistent with observations),
                                                                      hot spots were modelled in the immediate vicinity of the ma-
Figure 7. Model-simulated spatial distribution of annual average
                                                                      jor upgraders (> 25 pg m−3 within 5 km from AR6 in 2012–
surface air GEM concentrations in Canada in 2013; colours in cir-
                                                                      2013) in the AOSR (Fig. 13, left panels). In 2014–2015,
cles show observed concentrations for 2013 (large circles) and pre-
vious years (small circles).                                          TOM concentrations around AR6 were about half of 2012–
                                                                      2013 (12 pg m−3 ), consistent with reported changes in Hg
                                                                      emissions from the respective facilities. OSE are found to
occurred in southern Ontario in Canada due to the presence            be the main and major contributor of oxidized Hg concen-
of local anthropogenic mercury emissions in these regions.            trations in surface air close to oil sands sources, increas-
                                                                      ing background concentrations over 30 % within 100 km and
6.3   Impacts of oil sands developments and wildfires on              60 % within 50 km from AR6 in 2012–2013, particularly in
      mercury levels in air and deposition                            the northeast sector of the AOSR. Wildfire emissions played
                                                                      a minor role in ambient TOM concentrations in the region,
Employing GEM-MACH-Hg, the impacts of Hg emissions                    contributing to < 1 % increases in 2012, 2013 and 2015,
from oil sands developments in the AOSR on surface air con-           but increased to ∼ 6 % in 2014 as a result of higher wild-
centrations of Hg species (i.e., GEM and TOM), snowpack               fire activities. Hg emitted from oil sands operations as oxi-
Hg loadings and annual Hg deposition were investigated for            dized species is deposited efficiently by precipitation and up-
the years 2012–2015. Since northwest Canada is a region of            take from terrestrial surfaces in the vicinity of the sources.
high wildfire activity (Fraser et al., 2018), the relative role of    By comparison, most of the GEM emissions are transported
Hg emissions from biomass burning in North America on the             out of the region except for a small fraction being deposited
Hg burden in the AOSR was also examined.                              locally via direct vegetation uptake and conversion to oxi-
   Figures 12 and 13 provide spatial distributions of sim-            dized species and dry deposition. Oxidized Hg species emit-
ulated annual average surface air concentrations of GEM               ted from global sources do not reach the AOSR via long-
(globally transported and the dominant ambient Hg species)            range transport due to their short-lived nature. As a result,
and TOM (regionally transported and efficiently deposited             OSE-related Hg deposition in the AOSR consists primarily
Hg species) (left panels) for the years 2012 to 2015 along            of TOM, whereas long-range transport of GEM accounts for
with their contributions (as percentage increases) from oil           the deposition in the AOSR attributed to outside sources.
sands emissions (OSE, middle panels) and biomass burn-                Wildfire emissions are mostly assumed to be emitted as GEM
ing emissions (BBE, right panels) in the AOSR and the sur-            as indicated by observations (Friedli et al., 2001).
rounding region. GEM air concentrations were 1.4 ng m−3                  Figures 14 and 15 provide spatial distributions of modelled
in the AOSR in 2012–2015, which is within the range                   annual total mercury deposition (Fig. 14, left panels) and
of GEM concentrations observed in Alberta (i.e., 1.2–                 seasonally accumulated Hg loadings in the snow (Fig. 15,
1.5 ng m−3 in 2012). While annual average GEM concen-                 left panels) and their source attributions to OSE (Fig. 14,
trations were slightly elevated close to the major upgraders          middle panels; Fig. 15, right panels) and BBE (Fig. 14,
(> 1.5 within 5 km vs. 1.4 ng m−3 200 km away from AR6)               right panels) in the AOSR in 2012–2015. Mercury deposi-
in the AOSR, GEM concentrations were found to be ele-                 tion fluxes from 7–28 µg m−2 yr−1 (15.6–18.3 µg m−2 yr−1 ,
vated up to 1.8 ng m−3 in surrounding regions of the AOSR             averages) were modelled in the AOSR in 2012–2015, orig-
due to local wildfires in 2012–2015. Since the lifetime of            inating from all Hg emission sources – global primary and
GEM in the air is between 0.5–1 year, GEM concentra-                  legacy anthropogenic and geogenic (including oil sands and
tions are largely driven by global transport in the AOSR              biomass burning) emissions. Since the contribution of global
(and Canada) with only minor contributions from local emis-           transport of GEM to the ambient total Hg concentrations in
sions. Oil sands emissions increased atmospheric GEM con-             the AOSR is much larger than the contributions of OSE and
centrations up to 2.3 % in 2012 and 2013 and negligibly               BBE (Fig. 12) and GEM concentrations are typically 2–3 or-

https://doi.org/10.5194/acp-21-12783-2021                                           Atmos. Chem. Phys., 21, 12783–12807, 2021
12794 A. Dastoor et al.: Impact of Athabasca oil sands operations Figure 8. Seasonally accumulated Hg loadings in snow in AOSR from 2012 to 2015: modelled (background map) and observed values (colours in circles). Circle radii: 25, 50, 75, 120 km. ders of magnitude higher than TOM concentrations (which servations and prevailing wind direction and speed (Kirk et have higher contributions from OSE, Fig. 13), deposition of al., 2014). Average Hg deposition contributions due to BBE imported GEM makes up a major portion of the annual Hg (increases of 1.4 %–13 % ) were higher than OSE contribu- deposition in the AOSR on a broad spatial scale, despite its tions (increases of 0.3 %–1.3 %) across 200 km of oil sands lower Hg deposition efficiencies than TOM (Fig. 14). Sim- operations in 2012–2015. Wildfires in the region led to local- ilar to ambient TOM concentrations, modelling reveals the ized increases in Hg deposition of up to 193 % and 101 % in impact of OSE to Hg deposition to be greatest in the vicin- 2012 and 2014, especially northwest of the AOSR. Mercury ity of upgraders, i.e., average increases of 17 %, 20 %, 8 % emissions from electricity generation in southern Alberta ac- and 3 % within 20 km of AR6 in 2012, 2013, 2014 and 2015, counted for a general decrease in Hg deposition fluxes from respectively, and < 1 % beyond 50 km in all years. Model re- south to north around the AOSR. sults reveal a larger impact of OSE on Hg deposition in the Snowpack Hg accumulations from the start of the snow regions northeast of oil sands sources, consistent with ob- season to the end of winter (roughly coinciding with the Atmos. Chem. Phys., 21, 12783–12807, 2021 https://doi.org/10.5194/acp-21-12783-2021
A. Dastoor et al.: Impact of Athabasca oil sands operations                                                                      12795

Figure 9. Daily averaged model-simulated (blue) and observed snow depths (green) (cm) in 2012–2015 in the AOSR. Modelled values are
averaged over the entire AOSR domain, and the observation site is Mildred Lake, Alberta, a few kilometres east of the Syncrude oil sands
upgrader.

Figure 10. Average modelled (µg m−2 ; blue) and observed (µg m−2 ; red) end-of-winter Hg loadings in snowpack within 25, 25–50, 50–75,
and 75–120 and > 120 km distances from AR6 along with ±1 standard deviation. Modelled accumulated Hg in the snow was sampled at the
observation sites. Numbers in parentheses provide the number of observation sampling sites in each distance cluster.

maximum snow accumulation period) and their contributions             inhomogeneity in the accumulation of snow. Closer to OSE
from oil sands Hg emissions were estimated for 2012–2015              sources, total Hg loadings in snow reached up to 1.0 µg m−2
(Fig. 15). Background snow Hg loadings (without the im-               (< 20 km from AR6) in 2012–2014 (Fig. 15). In 2015, emis-
pact of OSE, middle panels) were spatially highly variable            sions from oil-sands-related activities were the lowest, and
(up to 1.4 µg m−2 ) in the region between 2012–2015. The              total Hg loadings corresponded to background emissions.
higher snow Hg background levels resulted from both the               The impact of OSE was notably greater on the snowpack
regional transport of Hg from southern Alberta and spatial            Hg loadings, including the spatial extent, than on the annual

https://doi.org/10.5194/acp-21-12783-2021                                            Atmos. Chem. Phys., 21, 12783–12807, 2021
You can also read