Comprehensive Insights Into the Occurrence, Source, Distribution and Risk Assessment of Polycyclic Aromatic Hydrocarbons in a Large Drinking ...
←
→
Page content transcription
If your browser does not render page correctly, please read the page content below
Comprehensive Insights Into the Occurrence, Source, Distribution and Risk Assessment of Polycyclic Aromatic Hydrocarbons in a Large Drinking Reservoir System Xiangyang Xu Hefei University of Technology School of Resources and Environmental Engineering Kangping Cui Hefei University of Technology School of Resources and Environmental Engineering Yihan Chen ( yhchen@hfut.edu.cn ) Hefei University of Technology School of Resources and Environmental Engineering Xing Chen Hefei University of Technology Institute of Industry & Equipment Technology Zhi Guo Hefei University of Technology School of Resources and Environmental Engineering Hongjie Chen National University of Singapore Environmental Research Institute Guangwei Deng Hefei University of Technology School of Management Yiliang He Shanghai Jiaotong University School of Environmental Science and Engineering Research Article Keywords: Polycyclic aromatic hydrocarbons, Fengshuba Reservior, Occurrence, Risk assessment, Indicator Posted Date: June 4th, 2021 DOI: https://doi.org/10.21203/rs.3.rs-542749/v1 License: This work is licensed under a Creative Commons Attribution 4.0 International License. Read Full License
1 Comprehensive insights into the occurrence, source, distribution and risk

 2 assessment of polycyclic aromatic hydrocarbons in a large drinking reservoir

 3 system

 4 Xiangyang Xu a, Kangping Cui a, Yihan Chen a, b*
 , Xing Chen c, Zhi Guo a, Hongjie

 5 Chen d, Guangwei Deng e, Yiliang He b*

 6

 7 a School of Resources and Environmental Engineering, Hefei University of Technology,

 8 Hefei 230009, China

 9 b School of Environmental Science and Engineering, Shanghai Jiao Tong University,

10 Shanghai 200240, China

11 c Key Lab of Aerospace Structural Parts Forming Technology and Equipment of Anhui

12 Province, Institute of Industry and Equipment Technology, Hefei University of

13 Technology, Hefei, 230009, China

14 d NUS Environmental Research Institute, National University of Singapore, 5A

15 Engineering Drive 1, #02-01, Singapore 117411, Singapore
16 e School of Management, Hefei University of Technology, Hefei 230009, China

17 Correspondence: Yihan Chen, PhD, School of Resources and Environmental
18 Engineering, Hefei University of Technology, 193 Tunxi Road, Hefei 230009, China.
19 Email: yhchen@hfut.edu.cn; Yiliang He, PhD, School of Environmental Science &
20 Engineering, Shanghai Jiao Tong University, 800 Dongchuan Road, Shanghai 200240,
21 China. Tel. 86-21-54744008. Email: ylhe@sjtu.edu.cn
22

23

24

25

26 Abstract

27 The resource, environment, and ecological value of drinking reservoirs have received

28 widespread concerns due to the pollution of persistent organic pollutants such as

29 polycyclic aromatic hydrocarbons (PAHs). Therefore, we comprehensively studied the

30 occurrence, source, distribution and risk assessment of representative PAHs in

31 Fengshuba Reservoir (FSBR) (large drinking reservoir, China). The total concentrations

32 of 16 USEPA PAHs in the water phase, porewater phase, sediment phase and soil phase

33 were in ranges of 109.72-393.19 ng/L, 5.75-35.15 μg/L, 364.4-743.71 μg/kg and

34 367.81-639.89 μg/kg, respectively. The naphthalene (Nap) was the dominant PAHs in

35 the water phase, while it was Nap and phenanthrene (Phe) in porewater, sediment and

36 soil phase. The main sources of PAHs in FSBR were biomass combustion. Redundancy

37 analysis indicated that, the NTU, NO2-, NH4+, Chl-α and IC were the dominant factor

38 influencing the PAHs distribution in water phase and the PAHs in sediment phase was

39 affected by T and NO3-. Pseudo-partitioning coefficients indicated that the PAHs in the

40 porewater phase was more likely to migrate to the sediment phase. Risk assessment

41 indicated that the PAHs both in the water and sediment phases were generally in a Low-

42 risk state, while the PAHs in the soil phase were in a Moderate-risk state and the Nap

43 was in a High-risk state, and exposure to the PAHs in FSBR through drinking and skin

44 exposure had little impact on consumers' health. In summary, Nap could be used as a

45 key indicator to evaluate the existence and potential risk of PAHs in FSBR.

46 Key Word: Polycyclic aromatic hydrocarbons; Fengshuba Reservior; Occurrence;

47 Risk assessment; Indicator.
48 1. Introduction

49 Polycyclic aromatic hydrocarbons (PAHs) are persistent pollutants that contain two

50 or more fused rings (Cao et al., 2017, El-Saeid et al., 2015), and are widely present in

51 various environmental media (Han et al., 2019, Saeedi et al., 2012, Mojiri et al., 2019,

52 Bianco et al., 2020). Due to their carcinogenicity, teratogenicity and mutagenicity and

53 the ability to migrate over long distances (He et al., 2020, Tobiszewski and Namiesnik,

54 2012), PAHs has attracted much attention for the harm to ecological environment and

55 human health (Lu et al., 2019). The United States Environmental Protection Agency

56 (USEPA) lists 16 kinds of PAHs as priority pollutants (Keith and Telliard, 1979), and

57 the International Agency for Research Cancer (IARC) lists many PAHs such as benzo

58 (a) pyrene (Bap) as carcinogenic pollutants. The sources of PAHs include natural

59 processes such as forest fires, as well as anthropogenic processes such as incomplete

60 combustion of fossil fuels and biomass (Dat and Chang, 2017), which can enter the

61 natural environment such as water body through a variety of ways (Palm et al., 2004).

62 With the world's socio-economic development and increasing demand for energy, the

63 high emissions of PAHs pose an increasing threat to global health (Idowu et al., 2019,

64 Kim et al., 2013).

65 The PAHs in the water environment tend to adsorb in the sediment due to the high

66 PAHs stability, low solubility and strong hydrophobicity (Doong and Lin, 2004). At the

67 same time, due to the frequent substances exchange between the sediment phase and

68 the aqueous phase (including the water and porewater phase), the adsorbed PAHs in

69 sediment phase will also be released into water for biological utilization, resulting in
70 secondary pollution and harm to ecological environment and human health (Hussain et

71 al., 2016, Yim et al., 2007, Han et al., 2020). The importance of drinking water

72 reservoirs to human beings is self-evident. However, the reports of PAHs in the water

73 environment are mainly focused on rivers (Doong and Lin, 2004, Sun et al., 2009),

74 lakes (Li et al., 2017, Qiao et al., 2006) and oceans (Araghi et al., 2014, Yuan et al.,

75 2015). There are few comprehensive studies on PAHs in reservoir systems, especially

76 large drinking water reservoirs (Jiao et al., 2009, Seopela et al., 2020) and the soil phase

77 of the water level drop zone of the reservoir. The Fengshuba Reservoir (FSBR) is

78 located at the source of the Dongjiang River Basin in southern China, providing

79 drinking water sources for nearly 40 million people in surrounding cities (Longchuan,

80 Guangzhou and Shenzhen). With the rapid economic development of Dongjiang River

81 Basin (He et al., 2013), the FSBR may be polluted by PAHs, which will threaten the

82 ecological environment and human health in the basin (Zheng et al., 2013). Hence,

83 assessing the occurrence and risk levels of PAHs in the FSBR will become crucial.

84 The purpose of this study is to systematically explore the occurrence, source, and

85 distribution of 16 USEPA PAHs in water phase, porewater phase, sediment phase and

86 soil phase in FSBR, and at the same time to evaluate the risks of the PAHs in water

87 phase and solid phase of the reservoir to ecology and human health. The relationship

88 between the PAHs and environmental parameters in different environmental media, and

89 finally determined the potential applicability of this potential indicator in the

90 management and control of the PAHs pollution in drinking water reservoirs. These

91 studies contribute to a better understanding of the PAHs environmental behavior in
92 reservoir systems and are expected to enrich the study of the PAHs in the water

 93 environment.

 94 2. Materials and Methods

 95 2.1 Study area and sampling

 96 The main water collecting sources of FSBR are Beiling River (basin area: 2363 km2)

 97 and Xinwu River (basin area: 2697 km2). The water surface area of FSBR is about 16.45

 98 km2, and the water depth is between 70 m and 100 m (Chen et al., 2017). Table S1

 99 showed the hydrological information of the reservoir in detail. Samples were taken from

100 five sampling sites (S1-S5) from July 18 to 20, 2015 (summer), November 25 to 27,

101 2015 (autumn) and March 14 to 16, 2016 (spring), respectively. For the water phase, 3

102 L of water samples were taken from the surface (50 cm below the water surface), the

103 middle (half of the water depth) and the bottom (2-4 m from the bottom), respectively.

104 And then the three water samples were mixed to form 9 L of water samples (S1-S5) at

105 the point. For sediment phase, a gravity sedimentation sampler was used to take

106 sediment samples (S1-S5) about 15 cm from the bottom of the water. In addition, only

107 in March 2016 (spring), when the water yield of the reservoir increased, that is, the

108 water level of the reservoir decreased, the surface soil samples (15 cm below the surface)

109 were taken from the water level drop zone at the same sampling point (S1-S5) (Chen et

110 al., 2020). In order to minimize sampling errors, samples were collected three times at

111 each sampling site. In addition, the samples were immediately transferred to the

112 laboratory after collection and stored in acidic plastic drums at -20 ℃.

113 2.2 Chemicals and standard products

114 This study involves the detection and quantification of 16 representative PAHs listed

115 by USEPA. PAHs Standards were classified according to the number of rings: 2-ring

116 PAHs (naphthalene (Nap)), 3-ring PAHs (acenaphthylene (Acy), acenaphthene (Ace),

117 fluorene (Flo), phenanthrene (Phe), anthracene (Ant)), 4-ring PAHs (fluoranthene (Fla),

118 pyrene (Pyr), benzo[a]anthracene (BaA), chrysene (Chr)), 5-ring PAHs

119 (benzo[b]fluoranthene (BbF), benzo[k]fluoranthene (BkF), benzo[a]pyrene (BaP),

120 dibenz[a,h]anthracene (DahA)), 6-ring PAHs (indeno[1,2,3-cd]pyrene (IcdP),

121 benzo[g,h,i]perylene (BghiP)). Standard Solution of the PAHs Isotope Tracer:

122 naphthalene-d8 (Nap-d8), acenaphthylene-d10 (Ace-d10), phenylene-d10 (Phe-d10)

123 and pyrene-d12 (Pyr-d12) were soluble in Methanol. All the abovementioned

124 compounds were purchased from Dr.Ehrenstorfer (Augsburg, Germany). Quantitative

125 internal standard: Anthracene-d10 was purchased from German DR Company as the

126 quantitative internal standard on machine. All the organic reagents in this experiment

127 were chromatography-grade, and the solid phase extraction HC-C18 column was

128 purchased from Shanghai Anpu Experimental Scientific Instrument Co., Ltd. The

129 physical and chemical properties of these 16 USEPA PAHs were listed in Table S2.

130 2.3 Environmental Factor Detection

131 The sediment samples were centrifuged at 5000 rpm for 10 min and the supernatant

132 was collected. Porewater is known as the filtrate obtained by filtered the supernatant

133 through a 0.45 μm glass fiber filter. Using Hydrolab multi-parameter water quality

134 analyzer (Hash, USA), the temperature (T), oxidation reduction potential (ORP),

135 dissolved oxygen (DO), pH, electrical conductivity (EC), chlorophyll-α (Chl-α) and
136 turbidity of the water samples and porewater samples were measured. Other

137 environmental parameters were measured according to the national standard methods:

138 dissolved total nitrogen (DTN), dissolved organic carbon (DOC), total phosphorus. In

139 addition, the sediment and soil samples were freeze-dried, and then ground and passed

140 through 100-mesh sieve. According to other studies, the basic environmental

141 parameters of the solid phase are T, EC, ORP, pH, total organic carbon (TOC), total

142 nitrogen (TN), total phosphorus (TP), and the percentage of clay, sand and silt.

143 2.4 Sample handling and analysis

144 2.4.1 Solid phase extraction of water samples

145 The water samples (1 L in triplicate) were filtered by 0.45 μm aqueous phase filter

146 membrane, and the filtrate was transferred into brown bottles, and 5 mL of methanol

147 was added to each bottle, and then a certain amount of standard solution of isotope

148 tracer was added and fully mixed before use. 5 mL of N-hexane: Dichloromethane (1:1),

149 5 mL of methanol, and 5 mL of distilled water were respectively used to activate the

150 HC-C18 column for 3 min. After connected the large-capacity sampling tube,

151 maintained the flow rate of 3-5 mL/min for water sample enrichment. After sample

152 enrichment was completed, the inner wall rinsed by ultrapure water and continued the

153 enrichment. and then use the vacuum pump to drain it after the completion 30min. Then,

154 use 5 mL of n-hexane: dichloromethane (1:1), and 5 mL of dichloromethane were used

155 for elution successively, and the elution was performed for about 3 minutes each time.

156 The eluent was collected in the test tube. Then, when the eluent was concentrated to

157 about 1 mL with a nitrogen blower, transferred to a quantitative concentration tube, and
158 added 3 mL of n-hexane: acetone (1:1) as the conversion solvent, continued to use the

159 nitrogen blower to concentrate to about 0.3 mL, added 50 μL internal standard

160 anthracene-d10 (800 μg/L) made the final concentrated solution 80 μg/L, and finally

161 calibrated to 0.5 mL with n-hexane: acetone (1:1), and then transferred to a brown

162 machine vial for later use.

163 2.4.2 Solid phase extraction of water samples

164 For the solid samples (sediment and soil samples), first freeze-dried for 24 hours,

165 ground them in a mortar and pass through a 100-mesh sieve, and then collected them

166 for later use. Then, took 1 g of the treated samples and 5 g of diatomite and mixed them

167 thoroughly, and put them into a 0.45 μm glass fiber membrane accelerated solvent

168 extraction cell, a certain amount of internal tracer markers was added and left overnight

169 before an accelerated solvent extractor was added. Then put it into an accelerated

170 solvent extraction instrument for extraction. Extraction conditions: the extraction

171 solvent was dichloromethane: acetone: n-hexane (1:1:1, V/V/V) mixed solution,

172 pressure 1500 psi, temperature 100°C, 5 min of preheating equilibrium time, 6 min of

173 static extraction time, the elution volume was 60% of the volume of the extraction tank,

174 the nitrogen purge time was 60 s, and 2 cycles of extraction process. Finally, the

175 extracted solution was subjected to the same concentration process as the above water

176 sample.

177 2.4.3 GC-MS instrumental analysis conditions

178 Gas chromatographic conditions: the temperature of the injection port was 280 ℃,

179 and splitless sampling; the carrier gas was high-purity helium with a flow rate of 1.0
180 mL/min; heating program: kept at 60 °C for 2 min, then increased to 210 ℃ at the rate

181 of 15 ℃/min and kept for 2 min, and increased to 300 ℃ at the rate of 3 ℃/min and

182 kept for 2 min, and ran at 315 °C for 5 min. Mass spectrometry conditions: the

183 temperature of the quadrupole was 150 °C, the temperature of the ion source was 230 °C,

184 and the temperature of the transmission line was 300 °C, and the ionization energy was

185 70 eV. Data collection method: adopt ion scanning mode, in which the solvent delay

186 time was 5 minutes, the peak time of the target compound, the quantification ion and

187 the qualifier ion were listed in Table S3.

188 Establishment of standard curve: with reference to the above conditions of instrument

189 analysis within the standard method of quantitative, and established standard curves of

190 internal standard method. The quantitative analysis of water samples: the sample was

191 carried out according to the above-mentioned instrument analysis conditions, and

192 quantitative analysis using internal standard method with the curve, and used the tracer

193 recovery rate as the correction factor, and divided by the concentration factor of 2000,

194 which was the actual concentration (ng/L) of water samples. The quantitative analysis

195 of solid samples: samples with reference to the above analysis instrument analysis

196 conditions. The internal standard method was used to mark the curve for quantitative

197 analysis, and the tracer recovery was used as the correction factor. The concentration in

198 the sample divided by the concentration ratio was the actual concentration in the

199 sediment (μg/kg).

200 2.5 Sources of PAH

201 A large number of studies have shown that the ratio isomers of the PAHs is of great
202 significance for study the source of the PAHs (Hartmann et al., 2004, Zhang et al., 2006,

203 Yunker et al., 2002, Sarria-Villa et al., 2016). These ratios such as Fla/(Fla + Pyr),

204 Phe/Ant, Nap/Phe, Ant/(Ant + Phe), Fla/(Fla + Pyr), InP/(InP + BghiP) can be used to

205 study the sources of the PAHs in water, sediment and soil (Budzinski et al., 1997,

206 Tobiszewski and Namiesnik, 2012). Since no high-ring PAHs such as IcdP and BghiP

207 were detected in the water phase, the ratio of Fla/(Fla + Pyr) and Ant/(Ant + Phe) were

208 used to study the main sources of water and solid phase of FSBR. The ratio of Fla/(Fla

209 +Pyr) < 0.4 (De La Torre-Roche et al., 2009) indicates that petroleum sources are

210 dominant, and the ratio of Flu/(Flu +Pyr) between 0.4 to 0.5 indicates that liquid

211 petrochemical combustion is dominant, and the ratio of Fla/(Fla +Pyr) > 0.5 indicates

212 that biomass burning such as grass, wood, and coal is dominant. The ratio of Ant/(Ant

213 + Phe) < 0.1 (Pies et al., 2008) indicates that the petroleum source is dominant, and the

214 ratio of Ant/(Ant + Phe) > 0.1 indicates that the pyrolysis source is dominant.

215 2.6 Risk assessment

216 Ecological risk assessment: the risk quotient (RQ) method was used to evaluate the

217 ecological toxicity of the PAHs in the FSBR (Cao et al., 2010, Zhang et al., 2017, Yu et

218 al., 2021). The risk level of the PAHs was characterized by the RQ, which was defined

219 as follows:
 CPAHs
220 =
 (1)

221 CPAHs and CQV in the above formula were expressed as the actual concentration of

222 certain PAHs in each medium and the corresponding quality value of certain PAHs in

223 each medium. The ratio of the actual concentrations (ACs) of the PAHs to the negligible
224 concentrations (NCs) and maximum permissible concentrations (MPCs) of the PAHs

225 in the corresponding medium was used to evaluate the risk level of the PAHs in water,

226 sediment and soil phase, which was defined as follows:
 C
227 = CACs (2)
 NCs

 C
228 = C ACs (3)
 MPCs

229 Furthermore, according to the current research, the following formulas (4), (5) and

230 (6) were used to calculate RQ∑PAHs, RQ∑PAHs (NCs) and RQ∑PAHs (MPCs) in various

231 environmental medium, which were defined as follows:

232 ∑ = ∑16
 =1 RQ (RQ > 1) (4)

233 ∑ ( ) = ∑16
 =1 RQ NCs (RQNCs > 1) (5)

234 ∑ ( ) = ∑16
 =1 RQ PMCs (RQMPCs > 1) (6)

235 Health risk assessment: the incremental lifetime cancer risk (ILCRs) recommended

236 by USEPA combined with toxic equivalent of BaP (TEQBaP) was used to quantitatively

237 characterize the potential carcinogenic risk of human body by the PAHs in the water of

238 FSBR (Nadal et al., 2004, Meng et al., 2019, Yu et al., 2021). Human body are mainly

239 exposed to the PAHs in surface water and groundwater bodies through ingestion and

240 skin contact, resulting in potential carcinogenic risks. The calculation formulas (3), (4)

241 and (5) are as follows:

242 TEQBaP = ∑16
 =1 Ci × TEF (7)
 TEQBaP ×IRW×CSFi ×EF×ED
243 ILCRsingestion = (8)
 ×

 TEQBaP ×SA×Kp ×ABS×ET×CSFi ×EF×ED
244 ILCRsskin contact = (9)
 ×

245 where TEQBaP represents the toxicity equivalent concentration (ng/L), ILCRsingestion
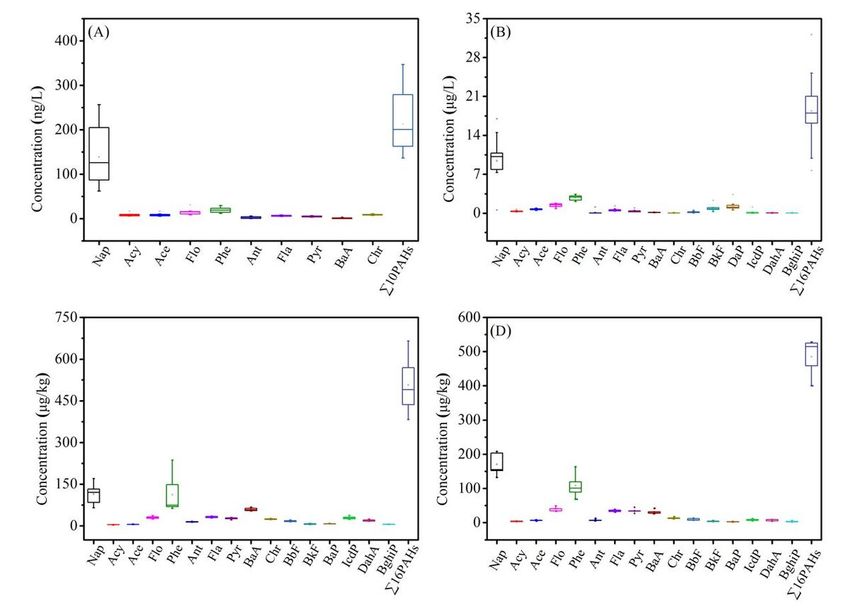
246 represents the incremental lifetime cancer risk caused by ingestion and ILCRsskin contact

247 represents the incremental lifetime cancer risk caused by contact.

248 2.7 Data analysis

249 Before the statistical analysis of the data, first of all, SPSS 26.0 (IBM, USA) Shapiro-

250 Wilk test was used to check whether the measured data met the normal distribution, and

251 then the One-way ANOVA test (for normal distribution) or the Kruskal-Wallis test (for

252 non-normal distribution) were used to analyze the inherent correlation of the data. Use

253 Origin 9 software (Originlab, USA) and R language (Microsoft, USA) for data

254 visualization. Use Canoco 5 (Microcomputer Power, UBA) software and R language

255 (Microsoft, USA) to perform redundancy analysis (RDA) and ANOSIM analysis on the

256 measured data of PAHs. If P value is involved, then P ≤ 0.05 or P ≤ 0.01 indicates that

257 the test results of the measured data were statistically significant.

258 3. Result and discussions

259 3.1 Distribution of the PAHs

260 3.1.1 The PAHs in aqueous phase

261 The concentrations of 16 PAHs in the water samples from FSBR were shown in the

262 Fig. 2 (A) and Table S4. Among the 16 PAHs, 6 of the PAHs were not detected (5-ring:

263 BbF, BkF, BaP, IcdP; 6-ring: DahA, BghiP), the detection rate of BaA was 50%, and

264 the detection rate of the remaining PAHs were 100%. The total concentrations of 10

265 remaining PAHs (∑10PAHs) ranged from 110.04 ng/L to 389.88 ng/L, with an average

266 of 213.14 ng/L and a median of 198.37 ng/L. Therefore, it can be seen from the results

267 that the FSBR as a source of drinking water had been contaminated. Among these 10
268 PAHs, the concentration of Nap ranged from 62.09 to 256.44 ng/L (average: 125.72

269 ng/L, median: 138.44 ng/L), which was significantly higher than others, indicating that

270 Nap abound in the reservoir. The possible reason was that Nap has the highest solubility

271 in water (Tobiszewski and Namiesnik, 2012). In addition, the 5-ring and 6-ring PAHs

272 were not detected in any water samples because of their extremely low solubility in

273 water, which makes it easier for high-ring PAHs to be enriched in the solid phase. This

274 phenomenon also occurs in the Moscow River, Russia water body, which the high-ring

275 PAHs were not detected (Eremina et al., 2016). Comparing with other studies, the total

276 concentration of the PAHs in the water phase of FSBR was similar to the total

277 concentration of the PAHs in Luan River Basin, China (∑PAHs: 9.75-309.75 ng/L) (Li

278 et al., 2010), which was higher than that in River Tiber, Italy (23.9-72.0 ng/L)

279 (Patrolecco et al., 2010), Ili-Balkhash Basin, arid Central Asia (7.58-70.98 ng/L) (Shen

280 et al., 2021), and lower than that in Loskop dam, South Africa (0.150-49.8 μg/L)

281 (Seopela et al., 2020).

282 In porewater samples (Fig. 2 (B) and Table S4), except for the detection rate of IcdP

283 and DahA at 93.3%, the detection rate of the remaining 14 PAHs was 100%. The total

284 concentrations of the 16 USEPA the PAHs (∑16PAHs) ranged from 5.75 μg/L to 34.96

285 μg/L, with an average of 18.33 μg/L and a median of 18.56 μg/L. These data were

286 significantly higher than those in the water phase, mainly because of sediments. The

287 sediment phase was also a sink of the PAHs in the water body, and the porewater was

288 obtained by centrifugation of the sediment phase (Bigus et al., 2014, Guo et al., 2017).

289 In fact, this was consistent with what has been reported by other studies (Maskaoui et
290 al., 2002). Similar to the aqueous phase, the concentration of Nap was also the highest

291 (average: 9.42 μg/L, median: 10.16 μg/L), followed by Phe (2.80 μg/L, 2.88 μg/L) in

292 porewater phase of FSBR. Looking at the water and porewater phase, it can be inferred

293 that the PAHs in the water phase were an important source of PAHs in the porewater

294 phase. Comparing with other studies, the total concentration of the PAHs in the

295 sediments of FSBR was higher than that in Lake Taihu, China (∑16PAHs: 2.01-19.90

296 μg/L) (Zhang et al., 2011), and lower than that in Lanzhou Reach of Yellow River,

297 China (48.2-206 μg/L) (Yu et al., 2009).

298 3.1.2 PAHs in solid phase

299 As shown in Fig. 2 (C) and Table S4, all 16 PAHs were detected in all sediment

300 samples. The total concentrations of these 16 PAHs (∑16PAHs) ranged from 364.4

301 μg/kg to 743.71 μg/kg, with an average of 506.81 μg/kg and a median of 470.22 μg/kg.

302 Similar to the occurrence of the PAHs in the porewater phase, the concentration of Nap

303 (114.43 μg/kg, 120.77 μg/kg) and Phe (112.26 μg/kg, 74.57 μg/kg) were significantly

304 higher than the others. Due to the occurrence of the PAHs in aqueous phase, Nap and

305 Phe may have a tendency to accumulate from aqueous phase to sediment phase (Han et

306 al., 2020). Comparing with other studies, the total concentration of the PAHs in the

307 sediments of FSBR higher than that in Chenab River, Pakistan (∑16PAHs: 7.41-600

308 μg/kg) (Hussain et al., 2016), Gorgan Bay, Caspian Sea (107.87-516.18 μg/kg) (Araghi

309 et al., 2014), and lower than that in Dianchi Lake, China (210-11070 μg/kg) (Zhao et

310 al., 2014) and Loskop dam, South Africa (61.6-2618 μg/kg) (Seopela et al., 2020).

311 For the solid phase (Fig. 2 (D) and Table S4), the 16 PAHs were detected in all
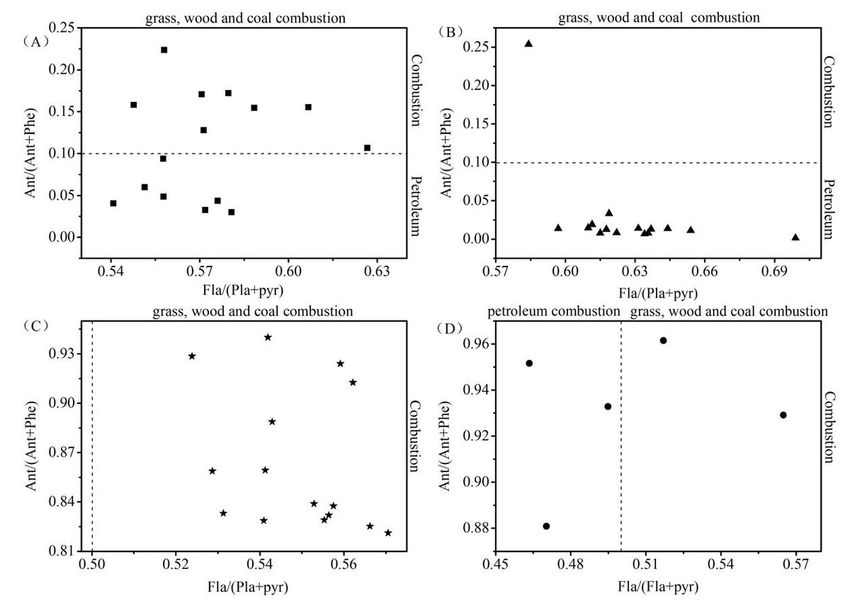
312 samples. The total concentration of these 16 PAHs (∑16PAHs) ranged from 367.81

313 μg/kg to 639.89 μg/kg, with an average of 485.18 μg/kg and a median of 453.29 μg/kg.

314 Comparing with the sediment, the overall occurrence level of PAHs in the soil phase in

315 the drawdown area was similar to that in the sediment phase. The distribution of the

316 PAHs in soil phase of FSBR was closely related to human activities (Li et al., 2020).

317 There are more intensive human activities at S5, including agriculture, fishing and fish

318 breeding, while the human activities at S4 were lesser. Among them, the point with the

319 highest concentration was S5 (528.18 μg/kg), and the point with the lowest

320 concentration was S4 (400.33 μg/kg). Similar to the occurrence of the PAHs in

321 porewater and sediment samples, the Nap (170.25 μg/kg, 154.92 μg/kg) and Phe

322 (108.43 μg/kg, 100.98 μg/kg) have the highest concentration. It can be seen from the

323 results that the occurrence of Nap and Phe in soil phase was the same as that of Nap

324 and Phe in water and sediment phase, which also proves that PAHs are more likely to

325 be deposited in solid phase in water environment (Doong and Lin, 2004). However,

326 since there are few reports on the occurrence of PAHs in the soil in the drawdown area

327 of reservoirs, the results of this study cannot be compared with those of other studies.

328 At the same time, it also reflects that the pollution of PAHs in soil in water-leveling and

329 fluctuating areas is worthy of further study, especially for those large drinking water

330 reservoirs.

331 3.2 Sources of PAHs

332 For the water phase, from Fig. 3 (A) and Table S5, the ratio of Fla/(Fla + Pyr) in the

333 water samples was 0.54-0.63 > 0.5, indicating that the PAHs in the water phase were
334 mainly derived from grass, wood and coal combustion, and the ratio of Ant/(Ant + Phe)

335 in the water samples was 0.03-0.22, indicating that the PAHs in the water phase also

336 came from combustion of petroleum. For the porewater phase, according to Fig. 3 (B)

337 and Table S5, the ratio of Fla/(Fla + Pyr) in the porewater samples was 0.58-0.70 > 0.5,

338 indicating that the PAHs in the porewater phase were mainly derived from the grass,

339 wood and coal combustion and the ratio of Ant/(Ant + Phe) in the porewater samples

340 was almost all < 0.1, indicating that PAHs in the porewater phase were also mainly

341 derived from petroleum sources. For the sediment phase (Fig. 3 (C) and Table S5), the

342 ratio of Fla/(Fla + Pyr) in sediment samples was 0.52-0.57 > 0.5, indicating that the

343 PAHs in the sediment phase were derived from the grass, wood and coal combustion

344 and the ratio of Ant/(Ant + Phe) in the sediment samples was 0.82-0.94 > 0.1, indicating

345 that the PAHs in the sediment phase were mainly derived from combustion. For the soil

346 phase, according to Fig. 3 (D) and Table S5, the ratio of Flu/(Flu + Pyr) in soil samples

347 was 0.46-0.56, indicating that the PAHs in the soil phase were mainly derived from the

348 mixed sources of petroleum combustion and grass, wood and coal combustion, and the

349 ratio of Ant/(Ant + Phe) in the soil samples were 0.88-0.96 > 0.1, indicating that PAHs

350 in the soil phase were also mainly derived from combustion. In conclusion, the PAHs

351 in FSBR were mainly derived from biomass combustion sources such as grass, wood

352 and coal, which may be due to the fact that FSBR is located in the natural environment

353 area at the source of Dongjiang River, far away from mega-cities such as Guangzhou,

354 Shenzhen and Hong Kong, and the forest coverage rate of Dongjiang River Basin

355 reached 71.8% in 2009 (Ding et al., 2016). Compared with the four water bodies’ bank
356 in Jamshedpur, India, where urbanization was accelerating, the main source of PAHs in

357 water bodies was related to combustion and diagenesis (Ambade and Sethi, 2021), and

358 for the Lake Ijssel, the Netherlands (Niu and van Gelder, 2020), its water source mainly

359 comes from the Rhine River and passes through big cities like Amsterdam, making the

360 PAHs in the lake mainly come from the coal combustion and petroleum source.

361 3.3 Seasonal variations of PAHs in reservoirs

362 For the water phase, the concentration of 2-ring PAHs in spring (191.45 ± 75.00 ng/L)

363 was significantly lower than the concentration of 2-ring PAHs in summer (125.20 ±

364 11.46 ng/L) and autumn (96.64 ± 23.83 ng/L) (one-way ANOVA, F = 5.42, P < 0.05)

365 (Fig. 4 (A)). The concentration of 3-ring PAHs in autumn (38.79 ± 5.51 ng/L) was also

366 significantly lower than the concentration of 3-ring PAHs in summer (58.88 ± 3.35 ng/L)

367 and spring (63.39 ± 13.17 ng/L) (one-way ANOVA, F = 11.96, P < 0.01). The

368 concentration of 4-ring PAHs in summer (17.38 ± 1.47 ng/L) was lower than the

369 concentration of 4-ring PAHs in spring (23.25 ± 5.31 ng/L) (one-way ANOVA, F = 5.61,

370 P < 0.05). In addition, this distribution trend was similar to the order of local rainfall:

371 Autumn (28.5 mm) < Summer (218 mm) < Spring (316 mm) (Table S1). It also

372 indicated that season had a significant effect on the distribution of total concentration

373 of PAHs in the aqueous phase (Li et al., 2020).

374 For the PAHs in the porewater phase, the concentrations of 3-ring PAHs

375 hydrocarbons in spring (4.71 ± 0.81 μg/L) were lower than those in summer (5.75 ±

376 0.22 μg/L) and autumn (5.60 ± 0.68 μg/L) (one-way ANOVA, F = 4.14, P < 0.043) (Fig.

377 3 (B)). The concentration of 6- ring PAHs in spring (0.04 ± 0.01 μg/L) was significantly
378 lower than that of 6-ring PAHs in summer (0.19 ± 0.12 μg/L) and autumn (0.06 ± 0.03)

379 (one-way ANOVA, F = 6.57, P < 0.05). In addition, the variation trend of the total

380 concentration of the PAHs was similar to that of Hydraulic retention time (days) in

381 FSBR: 49 days in spring < 122 days in summer < 246 days in autumn (Table S1).

382 For the PAHs in sediments, the concentration of 2-ring PAHs in autumn (88.26 ±

383 29.30 μg/kg) was significantly lower than that in spring (114.43±24.45 μg/kg) (one-

384 way ANOVA, F = 6.10, P < 0.05) (Fig3 (C)). The 3-ring PAHs concentrations in

385 summer (253.98 ± 53.14 μg/kg) were significantly higher than those in autumn (124.16

386 ± 11.08 μg/kg) and spring (120.15 ± 7.21 μg/kg) (Kruskal-Wallis H, P < 0.05). The

387 concentrations of 6-ring PAHs in summer (27.40 ± 2.78 μg/kg) were significantly

388 higher than those in spring (22.88 ± 1.83 μg/kg) (one-way ANOVA, F = 4.17, P < 0.05.).

389 It is worth noting that there were significant differences in the PAH composition

390 between the water phase and the pore water phase and the sediment and soil phases

391 (ANOSIM, P < 0.01). It was further confirmed that the environmental behavior of the

392 PAHs in storage systems with different environmental media was complex and diverse.

393 At the same time, this also emphasized that when facing the problem of the PAHs

394 pollution in large drinking water reservoirs, we should comprehensively consider the

395 impact of multiple environmental media (environmental factors) on their environmental

396 behavior.

397 3.4 Relationship between environmental parameters and PAHs

398 Redundancy analysis (RDA) is a commonly used multivariate analysis method that

399 can be used to analyze the relationship between two sets of variables (Takane and
400 Hwang, 2005). This study used RDA to further explore the relationship between

401 environmental parameters and the PAHs in various media of FSBR (Opere et al., 2020).

402 The blue arrows indicate specific PAHs, and the red arrows indicate specific

403 environmental parameters. And these environmental parameters are shown in detail in

404 Table S5-S8.

405 For the water phase, the RDA results (Fig. 5 (A)) showed that 49.7% of the changes

406 in PAHs were explained by these five significant environmental parameters: NTU

407 (24.0%, P = 0.002), NO2- (20.3%, P = 0.004), Chl-α (16.4%, P = 0.002), NH4+ (5.3%,

408 P = 0.036), IC (4.3%, P = 0.05). This result indicated that these environmental

409 parameters have a significant impact on the distribution of the PAHs in the water phase

410 of the FSBR. At the same time, it was worth noting that NTU and Chl-α were related

411 to turbidity, thus affecting the photodegradation of PAHs in water (Sanches et al., 2011).

412 The distribution of PAHs in the porewater phase was slightly affected by environmental

413 parameters, such as pH (4.0%, P = 0.09) and NO3- (3.0%, P = 0.166), and the P value

414 was greater than 0.05 for porewater phase (Fig. 5 (B)). For the sediment phase, the RDA

415 results showed (Fig. 5 (C)) that 26.8% of the changes in PAHs can be explained by

416 environmental parameters, such as T (35.6%, P = 0.002) and NO3- (17.9%, P = 0.006).

417 For the soil in the drawdown zone, the results of RDA showed (Fig. 4 (D)) that these

418 environmental parameters have little effect on the PAHs in the soil in the drawdown

419 zone of FSBR, but the changes in pH, DOC, TOC and NO3- had significant influence

420 on the distribution of Acy.

421 3.5 Pseudo-partitioning coefficient calculation
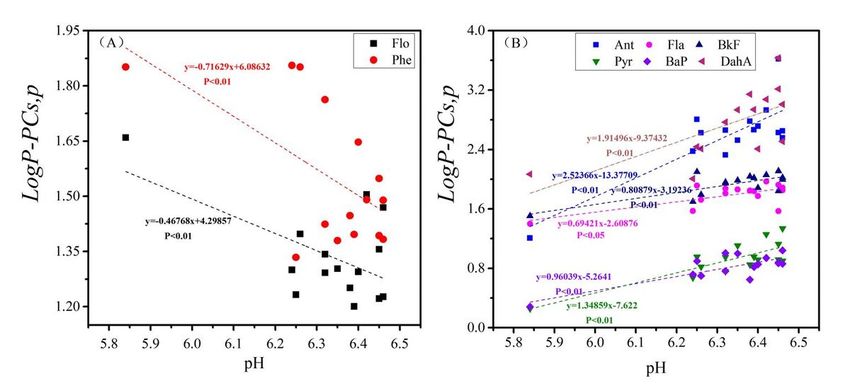
422 In order to better understand the potential dynamics between the PAHs in sediment

423 and aqueous phase (water and porewater phase), the pseudo-partition coefficient (P-PC)

424 method (Bai et al., 2014) was used. According to the following formula to explore their

425 distribution behaviors: P-PCs,w (sediment phase to water phase) = Cs/Cw, P-PCs,p

426 (sedimentary phase to porewater phase) = Cs/Cp , where Cs, Cw and Cp refer to the

427 actual measured concentration of the PAHs in sediment phase (μg/kg), water phase

428 (μg/L) and porewater phase (μg/L), respectively. The data of P-PCs,w and P-PCs,p

429 were shown in Table S9 and S10.

430 At the same time, some studies have reported that the distribution of the PAHs

431 between sediment and aqueous phase may also be affected by basic environmental

432 factors (such as pH, TOC and DOC) (Ekpo et al., 2012, Nascimento et al., 2017). In

433 this study, Pearson analysis was used to explore the relationship between P-PC (LogP-

434 PCs,w and LogP-PCs,p) and the level of pH in the corresponding system. In the

435 sediment to water phase system, only the value of Phe (LogP - PCs,w) and the pH value

436 of water phase were positively correlated. It was indicated that the pH of water phase

437 may affect the distribution behavior of Phe between water phase and sediment phase,

438 while other target PAHs had no significant correlation with the level of pH. In the

439 sediment to porewater system, it can be seen that the values of Ant, Fla, Pyr, BkF, BaP

440 and DahA (LogP - PCs,p) were positively correlated with the pH of the porewater phase,

441 while the values of Flo and Phe (LogP - PCs,p) were negatively correlated with the pH

442 of porewater (Fig. 6), indicating that the pH of porewater may affect the distribution of

443 Ant, Fla, Pyr, BkF, BaP, DahA, Flo, and Phe between the porewater phase and the
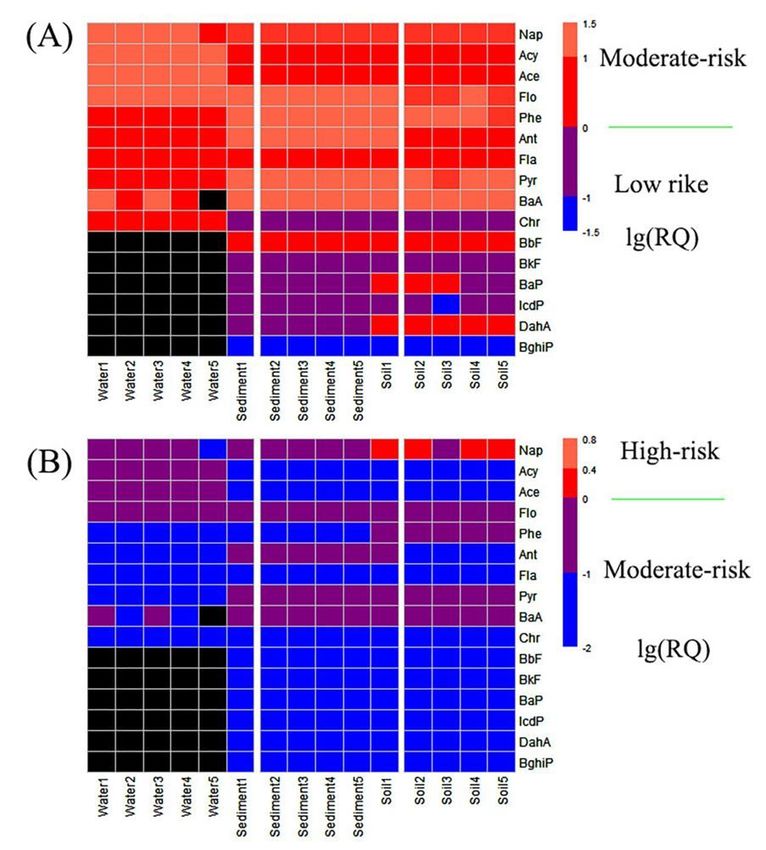
444 sedimentary phase.

445 3.6 Ecological and health risk assessment

446 3.6.1 Ecological Risk Assessment

447 Table S11 and Fig. 7 showed the NCs and MECs of the 16 USEPA PAHs in different

448 environmental media, as well as the RQNCs, RQMECs and RQ∑PAHs of the USEPA PAHs

449 in water phase, sediment phase and soil phase of FSBR. As can be seen from Table S11,

450 12 and Fig. 7, RQNCs and RQMECs in the water samples were both significantly greater

451 than 1, and RQMECs were also significantly lower than 1. Meanwhile, the total RQ of

452 PAHs in the water phase of FSBR were found to be RQ∑PAH(NCs) = 88.88 and

453 RQ∑PAH(MECs) = 0, therefore, the PAHs in the water phase of FSBR was in a state of

454 Low-risk (Tobiszewski and Namiesnik, 2012). The value of RQNCs of Chr, BkF, BaP,

455 IcdP, BghiP in sediment samples were approximately 0 and the value of RQMECs were

456 almost 0, so their impact on the ecological environment was very low, while the other

457 PAHs were in a state of Moderate-risk. And the total RQ of the PAHs in the sediment

458 phase were found to be RQ∑PAH(NCs) = 276.30 and RQ∑PAH(MECs) = 0, so the PAHs of the

459 sediment phase in FSBR was in a state of Low-risk level. The value of RQNCs of Chr,

460 BkF, IcdP, and BghiP in the soil samples were approximately 0 and the value of RQMECs

461 were almost 0, which had a very low impact on the ecological environment, and other

462 PAHs were in a state of Moderate-risk in the ecological environment, except for Nap

463 (RQNCs = 121.60, RQMECs = 1.22) was in a High-risk state. And the total RQ of PAHs in

464 the soil phase of the drawdown zone were found to be RQ∑PAH(NCs) = 324.22 and

465 RQ∑PAH(MECs) = 1.22, therefore, the PAHs in the soil phase of FSBR was in a Moderate-
466 risk1 state (Table S13). Compared with the FSBR in the nature reserve, the RQs study

467 of PAHs in coastline waters on Khark Island, SW Iran (Akhbarizadeh et al., 2016) that

468 is affected by the petroleum industry shows that PAHs are at a medium to high potential

469 risk. This also reflects from the side that it was very correct to list the FSBR as a

470 protected area (Chen et al., 2019).

471 3.6.2 Health risk assessment

472 According to equations (7), (8) and (9) and other parameters listed in Table S13, the

473 total carcinogenic risk (∑ILCRs) of PAHs in the FSBR was 4.53×10⁻⁸ a -1 to 2.27×10⁻⁷

474 a-1, with an average of 9.34×10⁻⁸ a-1 and a median of 8.07×10⁻⁸ a-1. The carcinogenic

475 risk value (ILCRsintake) produced by direct ingestion was 4.53×10⁻⁸ a-1 to 2.27×10⁻⁷ a-1,

476 with an average of 9.34×10⁻⁸ a-1 and a median of 8.07×10⁻⁸ a-1; the carcinogenic risk

477 value (ILCRsskin contact) produced through skin contact was 1.30×10⁻¹³ a-1 to 6.53×10⁻¹³

478 a-1, with an average of 2.68×10⁻¹³ a-1 and a median of 2.32×10⁻¹³ a-1. By comparison, it

479 can be concluded that the risk of carcinogenesis through ingestion was about 100 times

480 that of skin exposure. The total carcinogenic risk (∑ILCRs) of PAHs in the water of

481 FSBR was significantly lower than the carcinogenic risk recommended by USEPA (10-

 6
482 - 10-4 a-1), indicating that the impact of PAHs on health risks was negligible. Compared

483 with the PAHs in the Shitoumen Reservoir, China (Sun et al., 2015) that posed a

484 potential carcinogenic risk to local residents, the PAHs in the water body of the FSBR

485 had almost no harm to the surrounding residents.

486 4. Conclusions

487 The total concentrations of 16 USEPA PAHs in water phase, porewater phase,
488 sediment phase and soil phase of FSBR ranged from 109.72 – 393.19 ng/L, 5.75 – 35.15

489 μg/L, 364.4 - 743.71 μg/kg, 367.81 - 639.89 μg/kg, respectively. The Nap was the

490 dominant PAHs in the water phase, while it was Nap and Phe were dominant in

491 porewater, sediment and soil phase. The main sources of PAHs in FSBR were grass,

492 wood, biomass and coal combustion. In addition, the distribution of the PAHs in the

493 water phase was affected by seasonal hydrological conditions, and Redundancy

494 analysis showed that, the PAHs in the water phase was also affected by environmental

495 parameters such as turbidity, NO2-, NH4+, Chl-α and IC. The distribution of the PAHs

496 in sediment phase was affected by T and NO3+, while the PAHs in porewater and soil

497 phase was slightly affected by environmental parameters. Pseudo-partitioning

498 coefficients indicated that the PAHs in the porewater phase were more likely to migrate

499 to the sediment phase. Risk assessment showed that the PAHs in the water and sediment

500 phases were generally in a Low-risk state, while the PAHs in the soil phase were

501 generally in a Moderate-risk1 state and the Nap was in a High-risk state. The health risk

502 assessment indicated that exposure to the PAHs in FSBR through drinking and skin

503 exposure had little impact on consumers' health. In summary, Nap could be used as a

504 key indicator to evaluate the existence and potential risk of PAHs in FSBR.

505 Acknowledgements: The authors are grateful for the financial support from the

506 National Natural Science Foundation of China (Grant No. 42007330), and National

507 Science and Technology Major Projects of Water Pollution Control and Management

508 of China (Grant No. 2014ZX07206001).

509 Conflicts of Interest: The authors declare no conflicts of interest.
510 Declaration 511 Ethics approval and consent to participate 512 Not applicable 513 514 Consent for publication 515 Not applicable 516 517 Availability of data and materials 518 1. The datasets generated during and/or analysed during the current study are 519 available from the corresponding author on reasonable request. 520 2. All data generated or analysed during this study are included in this published 521 article (and its supplementary information files). 522 523 Competing interests 524 The authors declare that they have no competing interests. 525 526 Funding 527 1. National Natural Science Foundation of China (Grant No. 42007330) 528 2. National Science and Technology Major Projects of Water Pollution Control 529 and Management of China (Grant No. 2014ZX07206001). 530 531 Authors' contributions 532 Yiliang He and Kangping Cui conceived of the presented idea. Material preparation, 533 data collection and analysis were performed by Yihan Chen. The first draft of the 534 manuscript was written by Xiangyang Xu. Xing Chen, Zhi Guo, Hongjie Chen and 535 Guangwei Deng commented on previous versions of the manuscript. All authors 536 read and approved the final manuscript.
Reference:
Akhbarizadeh, R., Moore, F., Keshavarzi, B. & Moeinpour, A. (2016) Aliphatic and polycyclic aromatic
 hydrocarbons risk assessment in coastal water and sediments of Khark Island, SW Iran. Mar
 Pollut Bull, 108 (1-2), 33-45. https://doi.org/10.1016/j.marpolbul.2016.05.004
Ambade, B. & Sethi, S. S. (2021) Health Risk Assessment and Characterization of Polycyclic Aromatic
 Hydrocarbon from the Hydrosphere. Journal of Hazardous, Toxic, and Radioactive Waste, 25
 (2). https://doi.org/10.1061/(ASCE)HZ.2153-5515.0000586
Araghi, P. E., Bastami, K. D. & Rahmanpoor, S. (2014) Distribution and sources of polycyclic aromatic
 hydrocarbons in the surface sediments of Gorgan Bay, Caspian Sea. Mar Pollut Bull, 89 (1-2),
 494-498. https://doi.org/10.1016/j.marpolbul.2013.12.001
Bai, Y., Meng, W., Xu, J., Zhang, Y., Guo, C., Lv, J. & Wan, J. (2014) Occurrence, distribution,
 environmental risk assessment and source apportionment of polycyclic aromatic hydrocarbons
 (PAHs) in water and sediments of the Liaohe River Basin, China. Bull Environ Contam Toxicol,
 93 (6), 744-751. https://doi.org/10.1007/s00128-014-1390-7
Bianco, F., Race, M., Papirio, S. & Esposito, G. (2020) Removal of polycyclic aromatic hydrocarbons
 during anaerobic biostimulation of marine sediments. Sci Total Environ, 709, 136141.
 https://doi.org/10.1016/j.scitotenv.2019.136141
Bigus, P., Tobiszewski, M. & Namiesnik, J. (2014) Historical records of organic pollutants in sediment
 cores. Mar Pollut Bull, 78 (1-2), 26-42. https://doi.org/10.1016/j.marpolbul.2013.11.008
Budzinski, H., Jones, I., Bellocq, J., Piérard, C. & Garrigues, P. (1997) Evaluation of sediment
 contamination by polycyclic aromatic hydrocarbons in the Gironde estuary. Marine Chemistry,
 58 (1), 85-97. https://doi.org/10.1016/S0304-4203(97)00028-5
Cao, H., Chao, S., Qiao, L., Jiang, Y., Zeng, X. & Fan, X. (2017) Urbanization-related changes in soil
 PAHs and potential health risks of emission sources in a township in Southern Jiangsu, China.
 Sci Total Environ, 575, 692-700. https://doi.org/10.1016/j.scitotenv.2016.09.106
Cao, Z., Liu, J., Luan, Y., Li, Y., Ma, M., Xu, J. & Han, S. (2010) Distribution and ecosystem risk
 assessment of polycyclic aromatic hydrocarbons in the Luan River, China. Ecotoxicology, 19
 (5), 827-837. https://doi.org/10.1007/s10646-010-0464-5
Chen, Y., Cui, K., Huang, Q., Guo, Z., Huang, Y., Yu, K. & He, Y. (2020) Comprehensive insights into the
 occurrence, distribution, risk assessment and indicator screening of antibiotics in a large
 drinking reservoir system. Sci Total Environ, 716,
 137060.https://doi.org/10.1016/j.scitotenv.2020.137060
Chen, Y., Li, P., Huang, Y., Yu, K., Chen, H., Cui, K., Huang, Q., Zhang, J., Yew-Hoong Gin, K. & He, Y. (2019)
 Environmental media exert a bottleneck in driving the dynamics of antibiotic resistance genes
 in modern aquatic environment. Water Res, 162, 127-
 138.https://doi.org/10.1016/j.watres.2019.06.047
Chen, Y., Yu, K., Zhou, Y., Ren, L., Kirumba, G., Zhang, B. & He, Y. (2017) Characterizing spatiotemporal
 variations of chromophoric dissolved organic matter in headwater catchment of a key drinking
 water source in China. Environ Sci Pollut Res Int, 24 (36), 27799-
 27812.https://doi.org/10.1007/s11356-017-0307-5
Dat, N. D. & Chang, M. B. (2017) Review on characteristics of PAHs in atmosphere, anthropogenic
 sources and control technologies. Sci Total Environ, 609, 682-693.
 https://doi.org/10.1016/j.scitotenv.2017.07.204
De La Torre-Roche, R. J., Lee, W. Y. & Campos-Diaz, S. I. (2009) Soil-borne polycyclic aromatic
 hydrocarbons in El Paso, Texas: analysis of a potential problem in the United States/Mexico
 border region. J Hazard Mater, 163 (2-3), 946-958.
 https://doi.org/10.1016/j.jhazmat.2008.07.089
Ding, J., Jiang, Y., Liu, Q., Hou, Z., Liao, J., Fu, L. & Peng, Q. (2016) Influences of the land use pattern
 on water quality in low-order streams of the Dongjiang River basin, China: A multi-scale
 analysis. Sci Total Environ, 551-552, 205-216. https://doi.org/10.1016/j.scitotenv.2016.01.162
Doong, R. A. & Lin, Y. T. (2004) Characterization and distribution of polycyclic aromatic hydrocarbon
 contaminations in surface sediment and water from Gao-ping River, Taiwan. Water Res, 38 (7),
 1733-1744. https://doi.org/10.1016/j.watres.2003.12.042
Ekpo, B. O., Oyo-Ita, O. E., Oros, D. R. & Simoneit, B. R. (2012) Distributions and sources of polycyclic
 aromatic hydrocarbons in surface sediments from the Cross River estuary, S.E. Niger Delta,
 Nigeria. Environ Monit Assess, 184 (2), 1037-1047. https://doi.org/10.1007/s10661-011-2019-
 5
El-Saeid, M. H., Al-Turki, A. M., Nadeem, M. E., Hassanin, A. S. & Al-Wabel, M. I. (2015) Photolysis
 degradation of polyaromatic hydrocarbons (PAHs) on surface sandy soil. Environ Sci Pollut Res
 Int, 22 (13), 9603-9616. https://doi.org/10.1007/s11356-015-4082-x
Eremina, N., Paschke, A., Mazlova, E. A. & Schuurmann, G. (2016) Distribution of polychlorinated
 biphenyls, phthalic acid esters, polycyclic aromatic hydrocarbons and organochlorine
 substances in the Moscow River, Russia. Environ Pollut, 210, 409-418.
 https://doi.org/10.1016/j.envpol.2015.11.034
Guo, J., Chen, J. & Wang, J. (2017) Sedimentary records of polycyclic aromatic hydrocarbons in China:
 A comparison to the worldwide. Critical Reviews in Environmental Science and Technology,
 47 (17), 1612-1667. https://doi.org/10.1080/10643389.2017.1393262
Han, B., Liu, A., He, S., Li, Q. & Zheng, L. (2020) Composition, content, source, and risk assessment of
 PAHs in intertidal sediment in Shilaoren Bay, Qingdao, China. Mar Pollut Bull, 159, 111499.
 https://doi.org/10.1016/j.marpolbul.2020.111499
Han, J., Liang, Y., Zhao, B., Wang, Y., Xing, F. & Qin, L. (2019) Polycyclic aromatic hydrocarbon (PAHs)
 geographical distribution in China and their source, risk assessment analysis. Environ Pollut,
 251, 312-327. https://doi.org/10.1016/j.envpol.2019.05.022
Hartmann, P. C., Quinn, J. G., Cairns, R. W. & King, J. W. (2004) The distribution and sources of
 polycyclic aromatic hydrocarbons in Narragansett Bay surface sediments. Mar Pollut Bull, 48
 (3-4), 351-358. https://doi.org/10.1016/j.marpolbul.2003.08.014
He, Y., Lin, K. & Chen, X. (2013) Effect of Land Use and Climate Change on Runoff in the Dongjiang
 Basin of South China. Mathematical Problems in Engineering, 2013, 1-14.
 https://doi.org/10.1155/2013/471429
He, Y., Yang, C., He, W. & Xu, F. (2020) Nationwide health risk assessment of juvenile exposure to
 polycyclic aromatic hydrocarbons (PAHs) in the water body of Chinese lakes. Sci Total Environ,
 723, 138099. https://doi.org/10.1016/j.scitotenv.2020.138099
Hussain, I., Syed, J. H., Kamal, A., Iqbal, M., Eqani, S. A., Bong, C. W., Taqi, M. M., Reichenauer, T.
 G., Zhang, G. & Malik, R. N. (2016) The relative abundance and seasonal distribution
 correspond with the sources of polycyclic aromatic hydrocarbons (PAHs) in the surface
 sediments of Chenab River, Pakistan. Environ Monit Assess, 188 (6), 378.
 https://doi.org/10.1007/s10661-016-5359-3
Idowu, O., Semple, K. T., Ramadass, K., O'Connor, W., Hansbro, P. & Thavamani, P. (2019) Beyond the
 obvious: Environmental health implications of polar polycyclic aromatic hydrocarbons. Environ
 Int, 123, 543-557. https://doi.org/10.1016/j.envint.2018.12.051
Jiao, W., Lu, Y., Wang, T., Li, J., Han, J., Wang, G. & Hu, W. (2009) Polycyclic aromatic hydrocarbons
 in soils around Guanting Reservoir, Beijing, China. Chemistry and Ecology, 25 (1), 39-48.
 https://doi.org/10.1080/02757540802657193
Keith, L. & Telliard, W. (1979) ES&T Special Report: Priority pollutants: I-a perspective view.
 Environmental Science & Technology, 13 (4), 416-423. https://doi.org/10.1021/es60152a601
Kim, K. H., Jahan, S. A., Kabir, E. & Brown, R. J. (2013) A review of airborne polycyclic aromatic
 hydrocarbons (PAHs) and their human health effects. Environ Int, 60, 71-80.
 https://doi.org/10.1016/j.envint.2013.07.019
Li, C., Huo, S., Yu, Z., Xi, B., Yeager, K. M., He, Z., Ma, C., Zhang, J. & Wu, F. (2017) National
 investigation of semi-volatile organic compounds (PAHs, OCPs, and PCBs) in lake sediments
 of China: Occurrence, spatial variation and risk assessment. Sci Total Environ, 579, 325-336.
 https://doi.org/10.1016/j.scitotenv.2016.11.097
Li, R., Hua, P., Zhang, J. & Krebs, P. (2020) Effect of anthropogenic activities on the occurrence of
 polycyclic aromatic hydrocarbons in aquatic suspended particulate matter: Evidence from Rhine
 and Elbe Rivers. Water Res, 179, 115901. https://doi.org/10.1016/j.watres.2020.115901
Li, Y., Liu, J., Cao, Z., Lin, C. & Yang, Z. (2010) Spatial distribution and health risk of heavy metals and
 polycyclic aromatic hydrocarbons (PAHs) in the water of the Luanhe River Basin, China.
 Environ Monit Assess, 163 (1-4), 1-13. https://doi.org/10.1007/s10661-009-0811-2
Lu, J., Zhang, C., Wu, J., Lin, Y., Zhang, Y., Yu, X. & Zhang, Z. (2019) Pollution, sources, and ecological-
 health risks of polycyclic aromatic hydrocarbons in coastal waters along coastline of China.
 Human and Ecological Risk Assessment: An International Journal, 26 (4), 968-985.
 https://doi.org/10.1080/10807039.2018.1548899
Maskaoui, K., Zhou, J. L., Hong, H. S. & Zhang, Z. L. (2002) Contamination by polycyclic aromatic
 hydrocarbons in the Jiulong River Estuary and Western Xiamen Sea, China. Environmental
 Pollution, 118 (1), 109-122. https://doi.org/10.1016/S0269-7491(01)00208-1
Meng, Y., Liu, X., Lu, S., Zhang, T., Jin, B., Wang, Q., Tang, Z., Liu, Y., Guo, X., Zhou, J. & Xi, B. (2019)
 A review on occurrence and risk of polycyclic aromatic hydrocarbons (PAHs) in lakes of China.
 Sci Total Environ, 651 (Pt 2), 2497-2506. https://doi.org/10.1016/j.scitotenv.2018.10.162
Mojiri, A., Zhou, J. L., Ohashi, A., Ozaki, N. & Kindaichi, T. (2019) Comprehensive review of polycyclic
 aromatic hydrocarbons in water sources, their effects and treatments. Sci Total Environ, 696,
 133971. https://doi.org/10.1016/j.scitotenv.2019.133971
Nadal, M., Schuhmacher, M. & Domingo, J. L. (2004) Levels of PAHs in soil and vegetation samples
 from Tarragona County, Spain. Environ Pollut, 132 (1), 1-11.
 https://doi.org/10.1016/j.envpol.2004.04.003
Nascimento, R. A., de Almeida, M., Escobar, N. C. F., Ferreira, S. L. C., Mortatti, J. & Queiroz, A. F. S.
 (2017) Sources and distribution of polycyclic aromatic hydrocarbons (PAHs) and organic matter
 in surface sediments of an estuary under petroleum activity influence, Todos os Santos Bay,
 Brazil. Mar Pollut Bull, 119 (2), 223-230. https://doi.org/10.1016/j.marpolbul.2017.03.069
Niu, L. & van Gelder, P. (2020) Distribution and source assessment of polycyclic aromatic hydrocarbons
 levels from Lake IJssel (the Netherlands) and their responses to hydrology. Water Environ Res,
 92 (8), 1214-1229. https://doi.org/10.1002/wer.1317
Opere, W. M., John, M. & Ombori, O. (2020) Occurrence of Enteric Viruses in Surface Water and the
 Relationship with Changes in Season and Physical Water Quality Dynamics. Adv Virol, 2020,
 9062041. https://doi.org/10.1155/2020/9062041
Palm, A., Cousins, I., Gustafsson, O., Axelman, J., Grunder, K., Broman, D. & Brorstrom-Lunden, E.
 (2004) Evaluation of sequentially-coupled POP fluxes estimated from simultaneous
 measurements in multiple compartments of an air-water-sediment system. Environ Pollut, 128
 (1-2), 85-97. https://doi.org/10.1016/j.envpol.2003.08.023
Patrolecco, L., Ademollo, N., Capri, S., Pagnotta, R. & Polesello, S. (2010) Occurrence of priority
 hazardous PAHs in water, suspended particulate matter, sediment and common eels (Anguilla
 anguilla) in the urban stretch of the River Tiber (Italy). Chemosphere, 81 (11), 1386-1392.
 https://doi.org/10.1016/j.chemosphere.2010.09.027
Pies, C., Hoffmann, B., Petrowsky, J., Yang, Y., Ternes, T. A. & Hofmann, T. (2008) Characterization and
 source identification of polycyclic aromatic hydrocarbons (PAHs) in river bank soils.
 Chemosphere, 72 (10), 1594-1601. https://doi.org/10.1016/j.chemosphere.2008.04.021
Qiao, M., Wang, C., Huang, S., Wang, D. & Wang, Z. (2006) Composition, sources, and potential
 toxicological significance of PAHs in the surface sediments of the Meiliang Bay, Taihu Lake,
 China. Environ Int, 32 (1), 28-33. https://doi.org/10.1016/j.envint.2005.04.005
Saeedi, M., Li, L. Y. & Salmanzadeh, M. (2012) Heavy metals and polycyclic aromatic hydrocarbons:
 pollution and ecological risk assessment in street dust of Tehran. J Hazard Mater, 227-228, 9-
 17. https://doi.org/10.1016/j.jhazmat.2012.04.047
Sanches, S., Leitao, C., Penetra, A., Cardoso, V. V., Ferreira, E., Benoliel, M. J., Crespo, M. T. & Pereira,
 V. J. (2011) Direct photolysis of polycyclic aromatic hydrocarbons in drinking water sources. J
 Hazard Mater, 192 (3), 1458-1465. https://doi.org/10.1016/j.jhazmat.2011.06.065
Sarria-Villa, R., Ocampo-Duque, W., Paez, M. & Schuhmacher, M. (2016) Presence of PAHs in water
 and sediments of the Colombian Cauca River during heavy rain episodes, and implications for
 risk assessment. Sci Total Environ, 540, 455-465.
 https://doi.org/10.1016/j.scitotenv.2015.07.020
Seopela, M. P., McCrindle, R. I., Combrinck, S. & Augustyn, W. (2020) Occurrence, distribution, spatio-
 temporal variability and source identification of n-alkanes and polycyclic aromatic
 hydrocarbons in water and sediment from Loskop dam, South Africa. Water Res, 186, 116350.
 https://doi.org/10.1016/j.watres.2020.116350
Shen, B., Wu, J., Zhan, S. & Jin, M. (2021) Residues of organochlorine pesticides (OCPs) and polycyclic
 aromatic hydrocarbons (PAHs) in waters of the Ili-Balkhash Basin, arid Central Asia:
 Concentrations and risk assessment. Chemosphere, 273, 129705.
 https://doi.org/10.1016/j.chemosphere.2021.129705
Sun, C., Zhang, J., Ma, Q. & Chen, Y. (2015) Human Health and Ecological Risk Assessment of 16
 Polycyclic Aromatic Hydrocarbons in Drinking Source Water from a Large Mixed-Use
 Reservoir. Int J Environ Res Public Health, 12 (11), 13956-13969.
 https://doi.org/10.3390/ijerph121113956
Sun, J. H., Wang, G. L., Chai, Y., Zhang, G., Li, J. & Feng, J. (2009) Distribution of polycyclic aromatic
 hydrocarbons (PAHs) in Henan Reach of the Yellow River, Middle China. Ecotoxicol Environ
 Saf, 72 (5), 1614-1624. https://doi.org/10.1016/j.ecoenv.2008.05.010
Takane, Y. & Hwang, H. (2005) On a test of dimensionality in redundancy analysis. Psychometrika, 70
 (2), 271-281. https://doi.org/10.1007/s11336-003-1089-x
You can also read