Botulinum toxin injection changes resting state cerebellar connectivity in cervical dystonia
←
→
Page content transcription
If your browser does not render page correctly, please read the page content below
www.nature.com/scientificreports
OPEN Botulinum toxin injection
changes resting state cerebellar
connectivity in cervical dystonia
Pavel Hok1,2,6, Lenka Hvizdošová1,2,6, Pavel Otruba1,2, Michaela Kaiserová1,
Markéta Trnečková1,5, Zbyněk Tüdös3,4, Petr Hluštík1,2, Petr Kaňovský1,2 & Martin Nevrlý1,2*
In cervical dystonia, functional MRI (fMRI) evidence indicates changes in several resting state
networks, which revert in part following the botulinum neurotoxin A (BoNT) therapy. Recently,
the involvement of the cerebellum in dystonia has gained attention. The aim of our study was to
compare connectivity between cerebellar subdivisions and the rest of the brain before and after BoNT
treatment. Seventeen patients with cervical dystonia indicated for treatment with BoNT were enrolled
(14 female, aged 50.2 ± 8.5 years, range 38–63 years). Clinical and fMRI examinations were carried out
before and 4 weeks after BoNT injection. Clinical severity was evaluated using TWSTRS. Functional
MRI data were acquired on a 1.5 T scanner during 8 min rest. Seed-based functional connectivity
analysis was performed using data extracted from atlas-defined cerebellar areas in both datasets.
Clinical scores demonstrated satisfactory BoNT effect. After treatment, connectivity decreased
between the vermis lobule VIIIa and the left dorsal mesial frontal cortex. Positive correlations between
the connectivity differences and the clinical improvement were detected for the right lobule VI, right
crus II, vermis VIIIb and the right lobule IX. Our data provide evidence for modulation of cerebello-
cortical connectivity resulting from successful treatment by botulinum neurotoxin.
Abbreviations
BoNT Botulinum neurotoxin A
CD Cervical dystonia
DBS Deep brain stimulation
EPI Echo-planar imaging
FLAME FMRIB’s Local Analysis of Mixed Effects
fMRI Functional MRI
FoV Field of view
FSL FMRIB’s Software Library
FEW Family-wise error
MR Magnetic resonance
ROI Regions of interest
SMA Supplementary motor area
TR/TE Repetition time/echo time
TWSTRS Toronto Western Spasmodic Torticollis Rating Scale
W0 Week 0
W4 Week 4
Botulinum neurotoxin A (BoNT) injections are currently the preferred, even if symptomatic, treatment of focal
dystonia28. Although the primary BoNT site of action is at the neuromuscular junction, the clinical effect in
1
Department of Neurology, University Hospital Olomouc, I. P. Pavlova 6, 77900 Olomouc, Czech
Republic. 2Department of Neurology, Faculty of Medicine and Dentistry of Palacký University Olomouc,
Olomouc, Czech Republic. 3Department of Radiology, University Hospital Olomouc, Olomouc, Czech
Republic. 4Department of Radiology, Faculty of Medicine and Dentistry of Palacký University Olomouc, Olomouc,
Czech Republic. 5Department of Computer Science, Faculty of Science of Palacký University Olomouc, Olomouc,
Czech Republic. 6These authors contributed equally: Pavel Hok and Lenka Hvizdošová. *email: martin.nevrly@
fnol.cz
Scientific Reports | (2021) 11:8322 | https://doi.org/10.1038/s41598-021-87088-z 1
Vol.:(0123456789)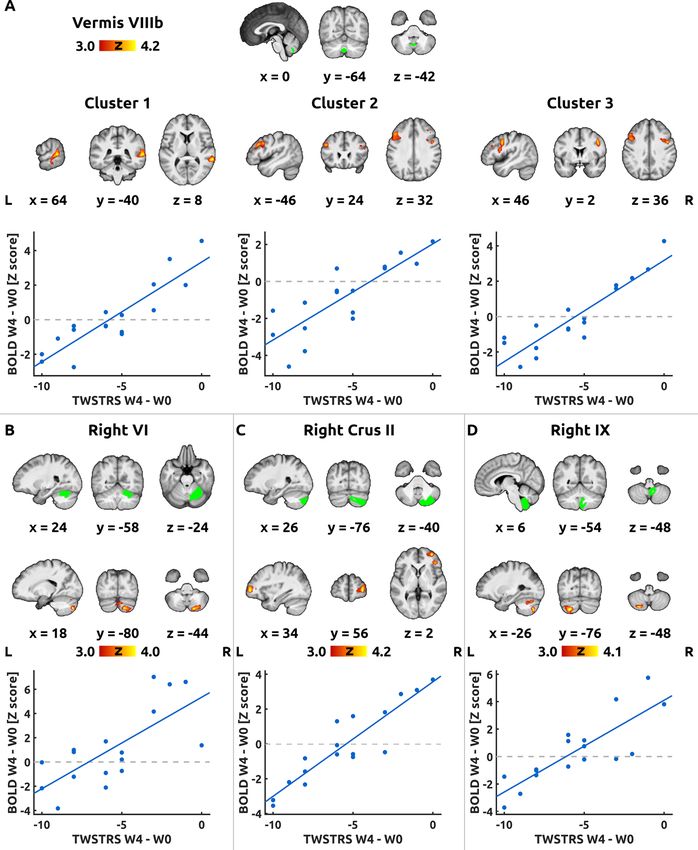
www.nature.com/scientificreports/
dystonia is assumed to be mediated by dynamic changes at multiple levels of the sensorimotor system, which was
demonstrated in several n europhysiological1,23,33, functional MRI38,41 and clinical studies e.g.,14,22,32.
In idiopathic cervical dystonia (CD), no consistent morphological tissue abnormalities have so far been
observed in structural quantitative MRI or histopathological studies3,25. However, functional MRI (fMRI) evi-
dence demonstrates changes in multiple resting state networks (e.g.,12, which partly normalize with botulinum
neurotoxin A (BoNT) therapy, suggesting primarily functional disruption of the motor control25,34. Nevertheless,
there are only a few publications discussing resting state fMRI in C D9,11,12,30,35,40,51. These studies demonstrate
functional connectivity changes at either cortical or subcortical levels thought to reflect defective planning,
disturbed spatial cognition, and compensatory executive control of accurate m ovements12.
Recently, the role of the cerebellum in the pathophysiology of dystonia has been d iscussed2,9,20,21,50,52. Promi-
nent cerebellar involvement has been reported both in task-related and in resting-state 9 fMRI studies. Inter-
20
estingly, cerebellum was the only region showing consistent post-mortem histopathological changes across 6
patients with CD45 and one of the two brain areas specifically associated with secondary CD9. However, the effects
of BoNT-A on resting state cerebello-cortical connectivity have not yet been investigated in sufficient detail. The
only studies assessing the effect of BoNT-A on resting state connectivity either did not evaluate any cerebellar
regions of i nterest6 or evaluated the cerebellum as a single region of interest (ROI)12. The remaining studies of
resting-state connectivity in CD did not assess the effects of treatment and included patients with different times
since their previous BoNT-A injection35,40. The lack of detailed analysis of treatment-related changes in cerebellar
functional connectivity thus poses a surprisingly significant knowledge gap, especially considering the potentially
important role of the cerebellum in the pathophysiology of dystonia.
Therefore, the aim of our study was to compare the whole-brain functional connectivity of cerebellar
regions before and after treatment initiation. Due to expected variability in the clinical effect of the first BoNT-
A injection31, the analysis focused on a relationship between the functional connectivity and the individual
amount of clinical improvement.
Methods
The diagnosis of CD was determined following a comprehensive neurological examination by a movement dis-
orders specialist, based on history of typical clinical symptoms for at least 12 months and polyelectromyographic
examination of neck muscles. All subjects had a recent magnetic resonance imaging (MRI) of the brain with no
structural abnormality. Each patient was informed in detail about the goal and the course of investigation and
signed an informed consent form. The study protocol was approved by the local ethics committee (Ethics Com-
mittee of the University Hospital and the Faculty of Medicine and Dentistry of Palacký University Olomouc,
Czech Republic), in accordance with the principles and recommendations of the Declaration of Helsinki, 1975
and later revisions.
Patients. Seventeen patients with CD indicated for treatment with BoNT were enrolled (14 female, aged
50.2 ± 8.5 years, range 38–63 years). Clinical and functional MRI examinations were carried out immediately
before and 4 weeks after the first BoNT injection.
The severity of CD was evaluated using the Toronto Western Spasmodic Torticollis Rating Scale (TWSTRS)8
at two sessions: at Week 0 (W0—on the day of the first fMRI examination immediately before the BoNT injec-
tion) and at Week 4 (W4- on the day of the second fMRI examination four weeks after the BoNT injection).
The BoNT treatment was indicated and carried out according to national and international standards and there
was no investigational treatment involved. In all patients, the injected muscles were determined on the basis of
a polyelectromyographic examination, provided by 4-channel Keypoint workstation, Medtronic, Minneapolis,
MN, USA. The details of the electromyographic examination and BoNT injection were described in our previ-
ous work33. All patients were treated with onabotulinum toxin type A (Botox,Allergan, Inc, Irvine, CA, USA in
concentrations of 25 IU/ml. The demographic and clinical data of the patients are presented in Table 1.
Data acquisition. The acquisition of MRI data was performed at W0 and W4 visits using 1.5-T scanners
(Siemens Aera, Avanto, and Symphony, Erlangen, Germany) with standard head coils. To avoid any possible
effects due to scanner used, the schedule was either matched or counter-balanced. To provide maximum comfort
and minimize head motion, the patient’s head was immobilized with cushions. During the acquisition, patients
were asked to lie still with their eyes closed and not to think about anything in particular. The MRI protocol
consisted of a functional T2*-weighted BOLD image acquisition using a gradient-echo echo-planar imaging
(EPI) sequence with 30 axial slices parallel to the anterior commissure-posterior commissure line, 5 mm slice
thickness, repetition time/echo time (TR/TE) = 2500/40 ms, flip angle 80°, field of view (FoV) = 220 mm, matrix
64 × 64, resolution 3.4 × 3.4 × 5.0 mm, 192 volumes. Furthermore, gradient-echo phase and magnitude field map
images with identical geometry were acquired to allow correction of the B0 imaging distortions. For anatomical
reference, a high-resolution three-dimensional MPRAGE scan was also acquired.
Data Pre‑processing. Initially, the fMRI data were checked for susceptibility or severe motion artifacts,
but no subject had to be excluded. The statistical analysis of BOLD time-series was performed in FEAT Version
6.00, part of FSL (FMRIB’s Software Library, www.fmrib.ox.ac.uk/fsl), version 5.0.929. The built-in pre-process-
ing pipeline included: correction of B0 distortions, motion correction using MCFLIRT, non-brain removal, and
spatial smoothing using a Gaussian kernel with 8.0 mm FWHM. In each patient, affine registration matrices
between the functional images from either session and a single anatomical reference image were obtained. The
anatomical reference was chosen based on a quality assessment of both available T1-weighted scans. Finally, a
non-linear registration of the anatomical image to the MNI 152 standard space using FNIRT was c alculated24.
Scientific Reports | (2021) 11:8322 | https://doi.org/10.1038/s41598-021-87088-z 2
Vol:.(1234567890)
www.nature.com/scientificreports/
Sex Age Total BoNT-A dose (Botox) TWSTRS at Week 0 TWSTRS at Week 4
F 39 150 15 6
F 55 200 11 5
F 38 100 12 4
F 50 200 16 6
F 47 200 16 6
M 49 150 12 6
F 61 150 13 10
F 49 125 14 12
F 60 200 21 13
F 60 200 18 13
F 44 200 13 13
F 58 200 10 5
F 63 175 13 12
M 43 100 17 11
F 40 125 14 9
F 56 175 18 10
M 41 100 10 7
Mean 50.2 161.8 14.3 8.7
Table 1. Demographic and clinical data of subjects. List of 17 subjects with thein sex and age, total dose of
BoNT used for single application and score of TWSTRS at W0 and W4. Abbreviations: F—female, M-male.
Next, residual motion-related artifacts were regressed out from functional time-series using ICA-AROMA noise
component classification tool48 and high-pass temporal filtering with sigma = 60.0 s was applied. In a parallel
pre-processing pipe-line, the same ICA-AROMA noise components were regressed from data with no spatial
smoothing applied. This unsmoothed dataset was used to extract both the signal of interest and non-neuronal
nuisance signal.
Extraction of time‑series. The time-series for seed-based connectivity were extracted using anatomi-
cally defined ROIs based on the FSL built-in Probabilistic Cerebellar Atlas parcellation with 50% probability
threshold15, see Fig. 1, Panel F. At this threshold, mask of label 9 (Vermis Crus I) contained 0 voxels and was
therefore discarded. Next, binarized masks were transformed into each individual’s functional space using an
inverted non-linear transformation field estimated in the pre-processing pipeline, resampled using trilinear
interpolation and thresholded at 0.5. After the resampling, mask of label 15 (Vermis VIIb) contained 0 voxels in
number of subjects and was discarded as well. The final set of ROIs consisted therefore of 26 regions. In each of
the ROIs, the first eigenvariate was extracted and used as a representative de-meaned time-series.
To provide a broader context for the changes in the cerebellar networks, we performed a supplementary
exploratory connectivity analysis using several regions of interest in the cerebral cortex and basal ganglia selected
a priori as a reference. The specific procedures of the supplementary analysis are described in Supplementary
Methods, the remaining procedures were identical to the main analysis.
Additionally, nuisance signal from six sources in the white matter and one source in the lateral ventricles was
obtained as described e lsewhere27.
Statistical analysis of imaging data. The seed-based functional connectivity analysis was carried out
using FILM55. For each ROI, a separate single-subject analysis was performed with a single regressor of inter-
est and its temporal derivative to account for non-uniform slice timing and hemodynamic delay, 6 estimated
motion parameters and 6 nuisance signal regressors from the white matter and 1 from the ventricles (see Extrac-
tion of Time-series section).
In the main group analysis, (1) we analyzed changes in functional connectivity, controlling for each indi-
vidual’s change in TWSTRS score from W0 to W4 (before and after BoNT-A) by including change in TWSTRS
as a covariate; and (2) we also investigated the relationship between the change in functional connectivity with
the change in TWSTRS score. To this end, pair-wise within-subject differences were modeled with an additional
(explanatory) variable consisting of the corresponding within-subject changes in TWSTRS. The purpose of the
(explanatory) variable was twofold: (1) to serve as a regressor (covariate) controlling for the individual variability
in clinical effect when assessing the average changes in functional connectivity, and (2) to serve as a predictor
of changes specifically linked to the clinical effect of BoNT-A. The second approach exploits the individual
variability in treatment response, which is less likely to be affected by other factors that could bias the average
differences. To incorporate both pair-wise differences and the TWSTRS change regressor/predictor, a two-step
analysis was employed. Within-subject differences were first computed using a fixed effects analysis. The esti-
mated beta values and variances were then carried over to the final mixed effects (fixed effects + random effects)
analysis with group mean as the first regressor and the TWSTRS change as the second one. The final step thus
Scientific Reports | (2021) 11:8322 | https://doi.org/10.1038/s41598-021-87088-z 3
Vol.:(0123456789)www.nature.com/scientificreports/
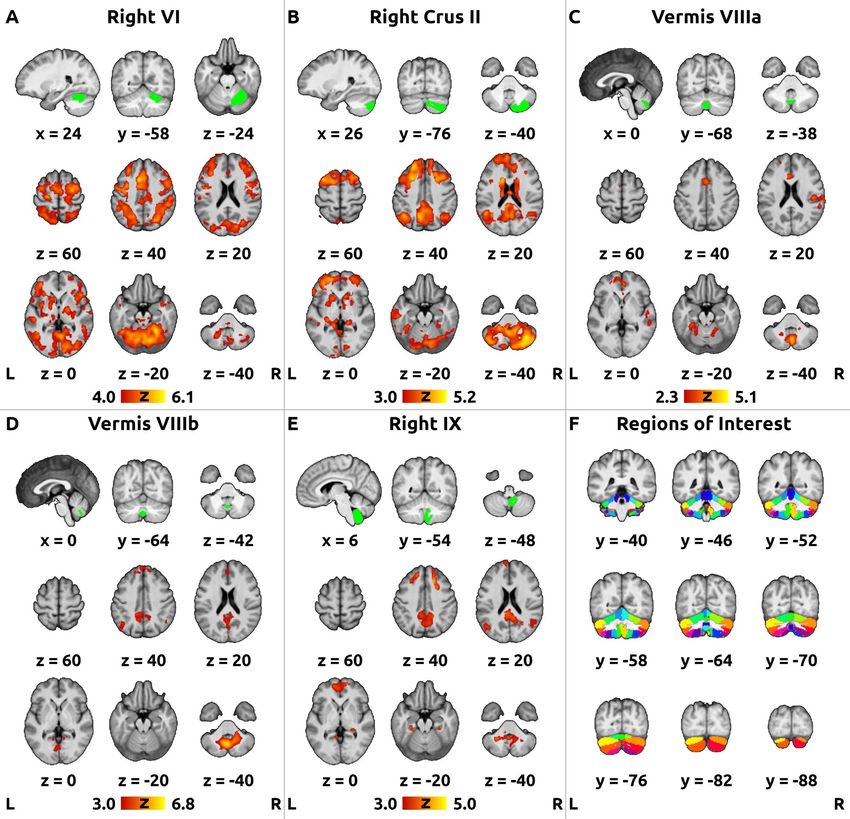
Figure 1. Mean functional connectivity of selected regions of interest. Figure shows mean post-hoc functional
connectivity averaged across both sessions (baseline + follow-up) for the seeds with significant treatment-related
changes and correlations in the main analysis: (A) Right Lobule VI, (b) Right Crus II, (C) Vermis VIIIa, (D)
Vermis VIIIb, and (E) Right Lobule IX. The green overlays in the top row of panels A-E show the respective
regions of interest (ROI) in the cerebellum. The red-yellow overlays in the bottom rows of panels A-E show the
functional connectivity of each ROI across the whole brain, thresholded at different cluster-forming levels to
produce visually comparable statistical maps (panel A: Z > 4.0; panels B, D,E: Z > 3.0; panel C: Z > 2.3) with the
corrected cluster significance level of p < 0.05. An average T1-weighted image with the MNI152 standard space
coordinates was used as a background. Right is right according to neurological convention.
yielded 2 pairs of contrasts: W0 > W4 and W4 > W0; Positive Correlation with TWSTRS Change and Negative
Correlation with TWSTRS Change. The final mixed effects analysis was performed using FLAME (FMRIB’s Local
Analysis of Mixed Effects) with the “stage 1” s etting54. The whole-brain analysis was limited to the MNI standard
brain mask24 minus a white-matter mask as described elsewhere27. The Z (Gaussianized T statistic images were
thresholded using clusters determined by Z > 3 and family-wise error (FWE and Bonferroni corrected (account-
ing for the number of ROI and two contrasts per contrast pair cluster significance threshold was p < 0.00096
(calculated as 0.05 / [26 * 2]. In the exploratory evaluation of the non-hypothesized cortical and subcortical ROIs
(supplementary analysis, we applied the same Bonferroni correction as in the main analysis (see Supplementary
Methods, similar to the exploratory approach described by Delnooz et al. 12.
Scientific Reports | (2021) 11:8322 | https://doi.org/10.1038/s41598-021-87088-z 4
Vol:.(1234567890)www.nature.com/scientificreports/
Figure 2. Pair-wise differences in connectivity. Panel A shows significant pair-wise changes in functional
connectivity of the seed in the Vermis VIIIa between the baseline visit (W0) and the follow-up (W4), i.e.,
contrast W4 > W0. No other ROIs showed average changes in functional connectivity after BoNT-A treatment.
The green overlay in the top row shows the region of interest in the cerebellum. The blue overlay in the bottom
row shows the significant decrease in functional connectivity (positive connectivity turning to negative) in the
left superior frontal gyrus, thresholded at Z > 3.0 and Bonferroni-corrected cluster significance level p < 0.00096.
For remaining conventions, see Fig. 1. Panel B shows box plot of individual blood oxygen level-dependent
(BOLD) response (Z score) averaged across the cluster in the left superior frontal gyrus from Panel A.
Significant clusters were anatomically classified according to an overlap with the Harvard–Oxford Corti-
cal and Subcortical Structural A tlases13, and the Probabilistic Cerebellar Atlas labels15. The resulting statistical
images were rendered in Mango v4.0 (Research Imaging Institute, UT Health Science Center at San Antonio,
TX, United States).
Post‑hoc plots. To determine the type of change detected using the group contrasts, such as loss of positive
or negative functional connectivity, gain of positive or negative connectivity, or both, a post-hoc analysis was
performed using the masks of significant clusters in group analysis. First, mean Z scores were extracted from
individual statistical maps using Featquery tool (part of FSL), which incorporates the back-transformation of
the cluster masks from the standard into the individual functional space. Finally, the values were visualized as
box plots (contrasts W0 > W4 and W4 > W0) or scatter plots with linear fit (contrasts Positive Correlation with
TWSTRS Change and Negative Correlation with TWSTRS Change).
Post‑hoc visualization of the average connectivity of cerebellar ROIs. To determine the func-
tional role of the ROIs with significant effects in the main analysis, a post-hoc connectivity analysis was per-
formed. The average effects over the two sessions (W0 + W4) were pooled to visualize the functional networks
associated with individual ROIs regardless of treatment. No Bonferroni correction was applied to the post-hoc
statistical maps (mean connectivity) produced solely for visualization purposes. Additionally, to allow interpre-
tation, the cluster-forming threshold was adjusted retrospectively to produce visually comparable co-activation
levels across all functional connectivity maps.
Results
Clinical data. All patients were injected into the muscles identified by clinical evaluation and by polyelec-
tromyography. The mean total dose of onabotulinumtoxin per patient was 161.8 ± 39.6 IU. The mean value of
TWSTRS at Week 0 was 14.3 ± 3.1 and, at Week 4, it was 8.7 ± 3.2 (p = 0.00002, one-sided paired t-test), see
Table 1. The significant decrease in TWSTRS four weeks after injections suggests a good clinical effect of BoNT
treatment.
Imaging data. The first pair of contrasts (W0 > W4 and W4 > W0) revealed a significant decrease in con-
nectivity (W0 > W4) between the vermis lobule VIIIa and the left dorsal mesial frontal cortex (Fig. 2, panel A).
The functional connectivity changed from positive to negative after treatment (Fig. 2, panel B). No other ROIs
showed average changes in functional connectivity after BoNT-A treatment. This result represents an average
effect of the BoNT-A treatment after correcting for inter-individual differences in the clinical effect (determined
as a change in TWSTRS). In other words, the functional connectivity decreased after treatment regardless of
actual clinical improvement.
Changes in functional connectivity that were correlated with the individual differences in clinical effect were
assessed using the second set of contrasts (Positive Correlation with TWSTRS Change and Negative Correlation
with TWSTRS Change). Positive correlations between the connectivity differences (W0 > W4) and the clinical
improvement (TWSTRS W0 > W4) were detected for the right lobule VI, right crus II, vermis VIIIb and the right
lobule IX (Fig. 3). No significant negative correlation was observed after Bonferroni correction. All clusters of
treatment-related differences and correlations (including those not reaching significance after correction) are
summarized in Table 2.
Scientific Reports | (2021) 11:8322 | https://doi.org/10.1038/s41598-021-87088-z 5
Vol.:(0123456789)www.nature.com/scientificreports/
Figure 3. Correlations between the functional connectivity and TWSTRS. Figure shows significant clusters of
correlation between the changes in Toronto Western Spasmodic Torticollis Rating Scale (TWSTRS) and changes
in functional connectivity from the baseline visit (W0) to the follow-up (W4). Each panel shows significant
clusters for a different region of interest (ROI): (A) Vermis VIIIb, (B) Right Lobule VI, (C) Right Crus II, and
(D) Right Lobule IX. The green overlays in the top row in each panel show the ROI in the cerebellum. The red-
yellow overlays in the bottom rows show the significant clusters, thresholded at Z > 3.0 and Bonferroni-corrected
cluster significance level p < 0.00096. Below each map, a scatter plot of TWSTRS change in the abscissa against
blood oxygen level-dependent (BOLD) response (Z score) in the ordinate demonstrates the individual values. A
linear fit line was added for visualization purposes. For remaining conventions, see Fig. 1.
There were no significant effects after Bonferroni correction in the supplementary analysis of cortical and
subcortical ROIs, see Supplementary Results and Supplementary Table S1.
The post-hoc visualization of average connectivity (W0 + W4) for those ROIs with significant clusters in the
main analysis is displayed in Fig. 1. Lobule VI was functionally associated predominantly with the bilateral pre-
motor cortices, supplementary motor area (SMA), anterior cingulate cortex, and bilateral intraparietal sulcus; the
right crus II, vermis VIIIb and right lobule IX showed mainly connectivity with the bilateral posterior cingulate
cortex, precuneus, parietooccipital and mesial prefrontal cortex; vermis VIIIa showed mainly connectivity with
the anterior cingulate cortex and the right temporoparietal junction (Fig. 1).
Discussion
In presented study, we investigated alterations in cerebellar functional connectivity and the possible modifying
effect of BoNT injections in CD by means of resting-state fMRI and atlas-based parcellation.
Scientific Reports | (2021) 11:8322 | https://doi.org/10.1038/s41598-021-87088-z 6
Vol:.(1234567890)www.nature.com/scientificreports/
Zmax MNI
Seed Contrast Cluster Index Cluster P value Volume (cm3) Zmax coordinates Atlas
79.8% R CRBL
Right VI Positive corr 1 8.30E−04 4.08 3.99 18–80–44 Crus II
10.0% R CRBL VIIb
63.7% R Frontal Pole
18.6% R Inferior
1 8.24E−05 6.11 4.20 34 56 2 Frontal G, p.t
12.7% R Inferior
Frontal G, p.o
Right Crus II Positive corr
70.7% L Frontal Pole
17.4% L Middle
2 1.34E − -02 2.62 3.68 − 40 38 8 Frontal G
6.1% L Inferior
Frontal G, p.t
92.3% L Superior
Frontal G
Vermis VIIIa AW0 > BW4 1 6.77E−04 3.21 3.92 − 12 24 60
7.7% L Paracingu-
late G
31.6% R Supramar-
ginal G, p.d
28.2% R Middle
Temporal G, t-o.p
1 1.54E−04 4.20 4.16 64−40 8
22.5% R Middle
Temporal G, p.d
14.9% R Superior
Temporal G, p.d
86.3% L Middle
Frontal G
2 3.19E−04 3.81 3.84 −46 24 32 8.4% L Inferior
Frontal G, p.o
5.0% L Precentral G
44.1% R Precentral G
30.0% R Middle
3 4.46E−04 3.63 3.96 46 2 36 Frontal G
25.3% R Inferior
Frontal G, p.o
50.5% R CRBL
Crus II
4 1.39E−03 3.06 4.31 34–76−46 22.5% R CRBL VIIb
Vermis VIIIb Positive corr 19.4% R CRBL Crus I
6.5% R CRBL VI
53.6% L CRBL VI
30.1% CRBL Vermis
VI
22.5% L Lingual G
5 5.39E−03 2.42 3.84 −6 − 74 −28
8.6% R Lingual G
6.0% L Occipital
Fusiform G
5.3% L CRBL Crus I
60.1% R Frontal Pole
20.6% R Frontal
6 5.39E−03 1.74 3.56 46 22–6 Orbital C
14.2% R Inferior
Frontal G, p.t
46.2% L Middle
Temporal G, t-o.p
34.1% L Planum
7 3.09E−02 1.66 3.75 −56–48 4
Temporale
16.8% L Superior
Temporal G, p.d
32.5% L CRBL
Crus II
1 6.57E−04 4.16 4.13 −26–76 −48 31.5% L CRBL Crus I
Right IX Positive corr 20.6% L CRBL VI
15.4% L CRBL VIIb
2 4.76E−02 1.76 4.06 8−34–42 100% Brain-Stem
Scientific Reports | (2021) 11:8322 | https://doi.org/10.1038/s41598-021-87088-z 7
Vol.:(0123456789)www.nature.com/scientificreports/
Table 2. List of significant clusters in the contrasts PreW0 – > W4, W4 > W0, Post contrast and correlation
with TWSTRS change. Table lists significant t-test clusters in the contrast W0 > W4, W4 > W0, positive, and
negative correlation (corr.) with TWSTRS (Toronto Western Spasmodic Torticollis Rating Scale) change. Bold
indicates clusters significant after Bonferroni correction. Anatomical labels with the highest probability per
voxel are provided including the proportion of labeled voxels. Only labels consisting at least 5% of activated
voxels are shown. Note that cerebellar labels may overlap with cortical labels. Abbreviations: C, cortex;
CRBL, cerebellum; G, gyrus; L, left; MNI, Montréal Neurological Institute; p.d., posterior division; p.o., pars
opercularis; p.t., pars triangularis; R, right; t-o.p., temporooccipital part; W0, Week 0; W4, Week 4; Z
max,
maximum Z score.
It has been repeatedly suggested that CD is a network d isorder4,35,39,46. Previous studies reported rather dif-
fuse or non-overlapping structural25,44,49 and functional10,35,47 changes in multiple brain regions, including the
sensorimotor cortices, basal ganglia, thalamus, and, more recently, cerebellum. In fact, it has been suggested
that dystonia is caused by a combined dysfunction of several network nodes or their abnormal c onnectivity39.
However, it remains unknown, which option describes the best the pathophysiology of d ystonia35.
The role of the cerebellum in the pathophysiology of CD is still controversial as it is not clear whether func-
tional changes in the cerebellum are the source or a consequence of dystonia38. Still, cerebellum showed consistent
post-mortem histopathological changes across 6 patients with C D45 and was one of the two brain regions spe-
9
cifically associated with secondary CD . Although damage to the cerebellum is usually associated with negative
symptoms (a loss of function), it can be argued that different kinds or localizations of lesions may produce differ-
ent clinical presentations based on the affected p athways38. Abnormalities in the anterior lobe of the cerebellum
may be associated with dysfunction of the cortical sensorimotor areas in d ystonia43. Filip et al.20 have found
cerebellar dysfunction mainly localized in the left posterior hemisphere. They have also demonstrated that CD
was associated with decreased functional connectivity between the left cerebellar lobule VI and the contralateral
prefrontal cortex, and between the left cerebellar crus I and the ipsilateral middle temporal gyrus. However, the
study by Filip et al.20 analyzed cerebellar connectivity during a visuospatial task and only from a limited number
of seeds (lobule VI, crus I and vermis VIIb), therefore the results are not directly comparable to ours.
In this study, we observed that resting-state connectivity from a number of cerebellar seeds in the posterior
vermis and right posterior cerebellar hemisphere decreased with treatment. Moreover, the higher was the clini-
cal benefit of the treatment, the larger was the decrease in functional connectivity (Fig. 3). The cerebellar seeds
associated with these changes were found in the following areas: right lobule VI, right crus II, vermis VIIIa and
VIIIb, and right lobule IX.
In agreement with previous data in healthy individuals7, the mean functional connectivity maps in Fig. 1
demonstrate that lobule VI is connected to the somatomotor, ventral attention, dorsal attention and frontoparietal
control networks (Yeo et al., 2011), whereas the crus II and lobule IX predominantly connect to the frontopa-
rietal control (crus II) and default mode network (both crus II and lobule IX) as defined by Yeo et al. (2011).
Although the lobule VIII has been implicated in motor control7,16, in our cohort, vermis VIIIa was associated
with the nodes of the ventral attention network, while vermis VIIIb was connected to the hubs of the default
mode network (Yeo et al. 2011).
Among the observed treatment-related effects, one stood out: the connectivity from the vermis VIIIa to the
left superior frontal gyrus decreased irrespective of the individual differences in the clinical outcome (Fig. 2).
Superior frontal gyrus (BA6/9/10) has been reported as one of the regions showing higher resting-state functional
connectivity in CD than in the control group, for a compound cortico-subcortical motor s eed12,35 or sensorimotor
cortex19, and has also manifested different structural connectivity pattern26 and increased gray matter volume37 in
other focal dystonias. Our treatment-related effect might be relevant, though possibly related to secondary phe-
nomena following the BoNT treatment, e.g., behavioral or affective changes associated with motor improvement.
However, the remaining significant changes in connectivity scaled with the degree of clinical motor improve-
ment. The change in TWSTRS was either correlated with the strength of intra-cerebellar functional connections,
as in the case of seeds in the right lobule VI and right lobule IX, or with cerebro-cerebellar connections, as in the
case of seeds in the right crus II and vermis VIIIb (Fig. 3).
The right lobule VI, which is predominantly associated with the sensorimotor control areas, showed in good
responders decreasing connectivity with the right crus II (Fig. 3, panel B), a cerebellar region associated with
the default mode n etwork7. In contrast, the right lobule IX showed decreasing connectivity with the left crus II
(Fig. 3, panel D). In this case, both regions are functionally associated with the default mode network7.
With respect to the cerebro-cerebellar connections, the clinical improvement (change in TWSTRS) was cor-
related with the functional connectivity strength between the right crus II and the right lateral prefrontal cortex,
i.e., a component of the frontoparietal control network53. Furthermore, correlation with change in TWSTRS was
observed between the vermis VIIIb and clusters in the right temporoparietal junction, left middle frontal gyrus,
and right premotor cortex, which represent nodes of the ventral attention, frontoparietal control, and dorsal
attention networks, r espectively53, Yeo et al. (2011).
In summary, BoNT injection followed by successful control of CD signs led to (1) decrease in intrinsic con-
nectivity in the posterior cerebellum, including connectivity between motor and more cognitive regions of the
cerebellum. Furthermore, (2) the vermis VIIIa and VIIIb, implicated in motor control, showed decreased con-
nectivity with bilateral dorsolateral frontal and premotor and right temporoparietal cortices, and (3) the crus II,
predominantly involved in cognitive functions, showed decreased connectivity with the right prefrontal cortex.
Scientific Reports | (2021) 11:8322 | https://doi.org/10.1038/s41598-021-87088-z 8
Vol:.(1234567890)www.nature.com/scientificreports/
The decreasing cerebro-cerebellar connectivity after treatment is in line with evidence for abnormally
“increased” (i.e., less negative) connectivity in CD between the sensorimotor cortex and a cerebellar seed in
vermis defined as an overlap of dystonia-related brain lesions9. Our findings also have to be considered in the
context of previous published papers on central treatment effects in idiopathic dystonia e.g.,12,18,38.
Our previous study showed decreased activation during complex finger tapping task throughout the senso-
rimotor system after BoNT treatment, including the anterior cerebellum38. Although this could be viewed as
decreasing task-driven cerebro-cerebellar connectivity, thus compatible with our current results, a direct com-
parison of task-related and resting-state data is not straightforward. A previous resting-state fMRI study in CD
patients that assessed BoNT effect revealed no difference in the cerebellar n etwork12. However, cerebellar con-
nectivity was assessed in that study on a global scale, de facto using a single cerebellar seed. Though reasonable in
search for large effects, such approach could possibly miss changes on a fine scale of individual cerebellar lobuli.
Further evidence for the role of the cerebellum comes from structural imaging studies. In patients with vari-
ous types of dystonia chronically treated with deep brain stimulation (DBS), voxel-based morphometry revealed
increased gray matter density in the cerebellar vermis, supplementary motor area (SMA) and anterior cingulate
cortex, which was more profound in good r esponders18. Together with our data, this study suggests a prominent
role of the cerebellum and its frontal connections in the normalization of the motor function, though the exact
mechanisms in DBS and BoNT may considerably differ.
It should be acknowledged that the mechanism of BoNT effect on central structures has not been fully
elucidated. The established mechanisms are summarized by Marchand-Pauvert et al.36, including blockade of
the gamma motor endings, plasticity evoked by blockade of the neuromuscular transmission, and retrograde
transport and transcytosis of BoNT. Although it is not entirely clear, which of the mechanisms plays a key role in
the clinical improvement after BoNT, there is multiple evidence from recent studies about modulation of activ-
ity of various structures in the central nervous system after BoNT both in motor and sensory areas. We suggest
that in focal dystonias, BoNT-induced effects encompass complex mechanisms beyond chemodenervation of
the injected m uscles5.
In conclusion, the presented data provide evidence for modulation of cortico-cerebellar connectivity resulting
from successful treatment by BoNT.
Received: 20 June 2020; Accepted: 19 March 2021
References
1. Abbruzzese, G. & Berardelli, A. Neurophysiological effects of botulinum toxin type A. Neurotox Res. 9, 109–114. https://doi.org/
10.1007/bf03033927 (2006).
2. Avanzino, L. & Abbruzzese, G. How does the cerebellum contribute to the pathophysiology of dystonia?. Basal Ganglia Knowl.
Gaps Parkinson’s Dis. Other Movement Disorders 2, 231–235. https://doi.org/10.1016/j.baga.2012.05.003 (2012).
3. Balint, B. et al. Dystonia. Nat. Rev. Dis. Primers 4, 25. https://doi.org/10.1038/s41572-018-0023-6 (2018).
4. Battistella, G., Termsarasab, P., Ramdhani, R. A., Fuertinger, S. & Simonyan, K. Isolated focal dystonia as a disorder of large-scale
functional networks Cereb. Cortex 27, 1203–1215. https://doi.org/10.1093/cercor/bhv313 (2017).
5. Berardelli, A. & Conte, A. Dystonias. Handb. Exp. Pharmacol. https://doi.org/10.1007/164_2019_339 (2019).
6. Brodoehl, S. et al. Cause or effect: Altered brain and network activity in cervical dystonia is partially normalized by botulinum
toxin treatment. NeuroImage Clin. 22, 101792. https://doi.org/10.1016/j.nicl.2019.101792 (2019).
7. Buckner, R. L., Krienen, F. M., Castellanos, A., Diaz, J. C. & Yeo, B. T. T. The organization of the human cerebellum estimated by
intrinsic functional connectivity. J. Neurophysiol. 106, 2322–2345. https://doi.org/10.1152/jn.00339.2011 (2011).
8. Consky, E. & Lang, A. Clinical Assessments of patients with Cervical Dystonia. In Therapy with Botulinum Toxin (ed. Jankovic, J.)
(Taylor & Francis, 1994).
9. Corp, D. T. et al. Network localization of cervical dystonia based on causal brain lesions. Brain 142, 1660–1674. https://doi.org/
10.1093/brain/awz112 (2019).
10. de Vries, P. M. et al. Changed patterns of cerebral activation related to clinically normal hand movement in cervical dystonia. Clin.
Neurol. Neurosurg. 110, 120–128. https://doi.org/10.1016/j.clineuro.2007.09.020 (2008).
11. Delnooz, C. C. S., Pasman, J. W., Beckmann, C. F. & van de Warrenburg, B. P. C. Altered striatal and pallidal connectivity in cervical
dystonia. Brain Struct. Funct. 220, 513–523. https://doi.org/10.1007/s00429-013-0671-y (2015).
12. Delnooz, C. C. S., Pasman, J. W., Beckmann, C. F. & van de Warrenburg, B. P. C. Task-free functional MRI in cervical dystonia
reveals multi-network changes that partially normalize with botulinum toxin. PLoS ONE 8, e62877. https://doi.org/10.1371/journ
al.pone.0062877 (2013).
13. Desikan, R. S. et al. An automated labeling system for subdividing the human cerebral cortex on MRI scans into gyral based regions
of interest. Neuroimage 31, 968–980. https://doi.org/10.1016/j.neuroimage.2006.01.021 (2006).
14. Deuschl, G. et al. Clinical and polymyographic investigation of spasmodic torticollis. J. Neurol. 239, 9–15. https://doi.org/10.1007/
bf00839204 (1992).
15. Diedrichsen, J., Balsters, J. H., Flavell, J., Cussans, E. & Ramnani, N. A probabilistic MR atlas of the human cerebellum. Neuroimage
46, 39–46. https://doi.org/10.1016/j.neuroimage.2009.01.045 (2009).
16. Diedrichsen, J., King, M., Hernandez-Castillo, C., Sereno, M. & Ivry, R. B. Universal transform or multiple functionality? Under-
standing the contribution of the human cerebellum across task domains. Neuron 102, 918–928. https://doi.org/10.1016/j.neuron.
2019.04.021 (2019).
17. Eickhoff, S. B. et al. Assignment of functional activations to probabilistic cytoarchitectonic areas revisited. Neuroimage 36, 511–521.
https://doi.org/10.1016/j.neuroimage.2007.03.060 (2007).
18. Fečíková, A. et al. Benefits of pallidal stimulation in dystonia are linked to cerebellar volume and cortical inhibition. Sci. Rep. 8,
17218. https://doi.org/10.1038/s41598-018-34880-z (2018).
19. Feng, L. et al. Brain connectivity abnormalities and treatment-induced restorations in patients with cervical dystonia. Eu. J. Neurol.
https://doi.org/10.1111/ene.14695 (2020).
20. Filip, P. et al. Disruption in cerebellar and basal ganglia networks during a visuospatial task in cervical dystonia (Disord, 2017).
https://doi.org/10.1002/mds.26930
21. Filip, P., Lungu, O. V. & Bareš, M. Dystonia and the cerebellum: a new field of interest in movement disorders?. Clin. Neurophysiol.
124, 1269–1276. https://doi.org/10.1016/j.clinph.2013.01.003 (2013).
Scientific Reports | (2021) 11:8322 | https://doi.org/10.1038/s41598-021-87088-z 9
Vol.:(0123456789)www.nature.com/scientificreports/
22. Gelb, D. J., Yoshimura, D. M., Olney, R. K., Lowenstein, D. H. & Aminoff, M. J. Change in pattern of muscle activity following
botulinum toxin injections for torticollis. Ann. Neurol. 29, 370–376. https://doi.org/10.1002/ana.410290407 (1991).
23. Gilio, F. et al. Effects of botulinum toxin type A on intracortical inhibition in patients with dystonia. Ann. Neurol. 48, 20–26 (2000).
24. Grabner, G. et al. Symmetric atlasing and model based segmentation: an application to the hippocampus in older adults. Med.
Image Comput. Comput. Assist. Interv. 9, 58–66 (2006).
25. Gracien, R.-M. et al. Multimodal quantitative MRI reveals no evidence for tissue pathology in idiopathic cervical dystonia. Front.
Neurol. 10, 914. https://doi.org/10.3389/fneur.2019.00914 (2019).
26. Hanekamp, S. & Simonyan, K. The large-scale structural connectome of task-specific focal dystonia. Hum. Brain Mapp. 41, 3253–
3265. https://doi.org/10.1002/hbm.25012 (2020).
27. Hok, P. et al. Differential effects of sustained manual pressure stimulation according to site of action. Front. Neurosci. 13, 722.
https://doi.org/10.3389/fnins.2019.00722 (2019).
28. Jankovic, J. Treatment of cervical dystonia with botulinum toxin. Mov. Disord. 19(Suppl 8), S109-115. https://doi.org/10.1002/
mds.20024 (2004).
29. Jenkinson, M., Beckmann, C. F., Behrens, T. E. J., Woolrich, M. W. & Smith, S. M. FSL. Neuroimage 62, 782–790. https://doi.org/
10.1016/j.neuroimage.2011.09.015 (2012).
30. Jiang, W. et al. Alterations of interhemispheric functional connectivity and degree centrality in cervical dystonia: a resting-state
fMRI study. Neural Plast. 2019, 7349894. https://doi.org/10.1155/2019/7349894 (2019).
31. Jost, W. H. et al. Effectiveness of botulinum neurotoxin type A injections in naïve and previously-treated patients suffering from
Torti- or Laterocollis or -caput: Results from a German-Austrian open-label prospective post-marketing surveillance study. J.
Neurol. Sci. 399, 44–50. https://doi.org/10.1016/j.jns.2019.02.017 (2019).
32. Kaňovský, P., Dufek, J., Halačková, H. & Rektor, I. Change in the pattern of cervical dystonia might be the cause of benefit loss
during botulinum toxin treatment. Eur. J. Neurol. 4, 79–84. https://doi.org/10.1111/j.1468-1331.1997.tb00303.x (1997).
33. Kaňovský, P. et al. Change in lateralization of the P22/N30 cortical component of median nerve somatosensory evoked potentials
in patients with cervical dystonia after successful treatment with botulinum toxin A. Mov. Disord. 13, 108–117. https://doi.org/
10.1002/mds.870130122 (1998).
34. Lehéricy, S., Tijssen, M. A. J., Vidailhet, M., Kaji, R. & Meunier, S. The anatomical basis of dystonia: current view using neuroimag-
ing. Mov. Disord. 28, 944–957. https://doi.org/10.1002/mds.25527 (2013).
35. Li, Z. et al. Alterations of resting-state fMRI measurements in individuals with cervical dystonia. Hum. Brain Mapp. 38, 4098–4108.
https://doi.org/10.1002/hbm.23651 (2017).
36. Marchand-Pauvert, V. et al. Beyond muscular effects: depression of spinal recurrent inhibition after botulinum neurotoxin A. J.
Physiol. (Lond.) 591, 1017–1029. https://doi.org/10.1113/jphysiol.2012.239178 (2013).
37. Martino, D. et al. Cortical gray matter changes in primary blepharospasm: a voxel-based morphometry study. Mov. Disord. 26,
1907–1912. https://doi.org/10.1002/mds.23724 (2011).
38. Nevrlý, M. et al. Changes in sensorimotor network activation after botulinum toxin type A injections in patients with cervical
dystonia: a functional MRI study. Exp. Brain Res. 236, 2627–2637. https://doi.org/10.1007/s00221-018-5322-3 (2018).
39. Neychev, V. K., Gross, R. E., Lehéricy, S., Hess, E. J. & Jinnah, H. A. The functional neuroanatomy of dystonia. Neurobiol. Dis. 42,
185–201. https://doi.org/10.1016/j.nbd.2011.01.026 (2011).
40. Norris, S. A. et al. Regional, not global, functional connectivity contributes to isolated focal dystonia. Neurology 95, 2246–2258.
https://doi.org/10.1212/WNL.0000000000010791 (2020).
41. Opavský, R., Hluštík, P., Otruba, P. & Kaňovský, P. Somatosensory cortical activation in cervical dystonia and its modulation with
botulinum toxin: an fMRI study. Int. J. Neurosci. 122, 45–52. https://doi.org/10.3109/00207454.2011.623807 (2012).
42. Opavský, R., Hluštík, P., Otruba, P. & Kaňovský, P. Sensorimotor network in cervical dystonia and the effect of botulinum toxin
treatment: A functional MRI study. J. Neurol. Sci. Spec. Section ECF 2009 A New Treatment Era Muliple Sclerosis Options Challenges
Risks Europ Charcot Foundation Symp. 306, 71–75. https://doi.org/10.1016/j.jns.2011.03.040 (2011).
43. Piccinin, C. C. et al. Infratentorial gray matter atrophy and excess in primary craniocervical dystonia. Parkinsonism Relat. Disord.
20, 198–203. https://doi.org/10.1016/j.parkreldis.2013.10.026 (2014).
44. Prell, T. et al. Structural brain abnormalities in cervical dystonia. BMC Neurosci. 14, 123. https://doi.org/10.1186/1471-2202-14-
123 (2013).
45. Prudente, C. N. et al. Neuropathology of cervical dystonia. Exp. Neurol. 241, 95–104. https://doi.org/10.1016/j.expneurol.2012.
11.019 (2013).
46. Prudente, C. N., Hess, E. J. & Jinnah, H. A. Dystonia as a network disorder: what is the role of the cerebellum?. Neuroscience 260,
23–35. https://doi.org/10.1016/j.neuroscience.2013.11.062 (2014).
47. Prudente, C. N. et al. A functional magnetic resonance imaging study of head movements in cervical dystonia. Front. Neurol.
https://doi.org/10.3389/fneur.2016.00201 (2016).
48. Pruim, R. H. R. et al. ICA-AROMA: A robust ICA-based strategy for removing motion artifacts from fMRI data. Neuroimage 112,
267–277. https://doi.org/10.1016/j.neuroimage.2015.02.064 (2015).
49. Ramdhani, R. A. et al. What’s special about task in dystonia? A voxel-based morphometry and diffusion weighted imaging study.
Mov. Disord. 29, 1141–1150. https://doi.org/10.1002/mds.25934 (2014).
50. Sadnicka, A., Hoffland, B. S., Bhatia, K. P., van de Warrenburg, B. P. & Edwards, M. J. The cerebellum in dystonia - help or hin-
drance?. Clin. Neurophysiol. 123, 65–70. https://doi.org/10.1016/j.clinph.2011.04.027 (2012).
51. Sarasso, E. et al. Sensory trick phenomenon in cervical dystonia: a functional MRI study. J. Neurol. https://d oi.o
rg/1 0.1 007/s 00415-
019-09683-5 (2020).
52. Shakkottai, V. G. et al. Current opinions and areas of consensus on the role of the cerebellum in dystonia. Cerebellum 16, 577–594.
https://doi.org/10.1007/s12311-016-0825-6 (2017).
53. Vincent, J. L., Kahn, I., Snyder, A. Z., Raichle, M. E. & Buckner, R. L. Evidence for a frontoparietal control system revealed by
intrinsic functional connectivity. J. Neurophysiol. 100, 3328–3342. https://doi.org/10.1152/jn.90355.2008 (2008).
54. Woolrich, M. W., Behrens, T. E. J., Beckmann, C. F., Jenkinson, M. & Smith, S. M. Multilevel linear modelling for FMRI group
analysis using Bayesian inference. Neuroimage 21, 1732–1747. https://doi.org/10.1016/j.neuroimage.2003.12.023 (2004).
55. Woolrich, M. W., Ripley, B. D., Brady, M. & Smith, S. M. Temporal autocorrelation in univariate linear modeling of FMRI data.
Neuroimage 14, 1370–1386. https://doi.org/10.1006/nimg.2001.0931 (2001).
Author contributions
Pa.H., L.H. and M.N. wrote the main manuscript. Pa.H. and L.H. both authors contributed equally to this work.
M.N., P.O., M.K. and L.H. made clinical evaluations of subjects and BoNT injections. Pa.H. and M.T. prepared
figures. M.N., Pa.H., Z.T. and Pe.H. made functional MRI examinations of subjects. M.N., Pa.H., Pe.H. and P.K.
prepared the whole protocol. Pe.H. and P.K. made critical review of manuscript.
Scientific Reports | (2021) 11:8322 | https://doi.org/10.1038/s41598-021-87088-z 10
Vol:.(1234567890)www.nature.com/scientificreports/
Funding
Research was supported by grant of the Czech Health Research Council (AZV MZ ČR) NV16-30210A and
Supported by Ministry of Health, Czech Republic – conceptual development of research organization (FNOl,
00098892). All rights reserved.
Competing interests
The authors declare no competing interests.
Additional information
Supplementary Information The online version contains supplementary material available at https://doi.org/
10.1038/s41598-021-87088-z.
Correspondence and requests for materials should be addressed to M.N.
Reprints and permissions information is available at www.nature.com/reprints.
Publisher’s note Springer Nature remains neutral with regard to jurisdictional claims in published maps and
institutional affiliations.
Open Access This article is licensed under a Creative Commons Attribution 4.0 International
License, which permits use, sharing, adaptation, distribution and reproduction in any medium or
format, as long as you give appropriate credit to the original author(s) and the source, provide a link to the
Creative Commons licence, and indicate if changes were made. The images or other third party material in this
article are included in the article’s Creative Commons licence, unless indicated otherwise in a credit line to the
material. If material is not included in the article’s Creative Commons licence and your intended use is not
permitted by statutory regulation or exceeds the permitted use, you will need to obtain permission directly from
the copyright holder. To view a copy of this licence, visit http://creativecommons.org/licenses/by/4.0/.
© The Author(s) 2021
Scientific Reports | (2021) 11:8322 | https://doi.org/10.1038/s41598-021-87088-z 11
Vol.:(0123456789)You can also read