Corporate Presentation October 2021 - Athens Exchange Group
←
→
Page content transcription
If your browser does not render page correctly, please read the page content below

Corporate Presentation
October 2021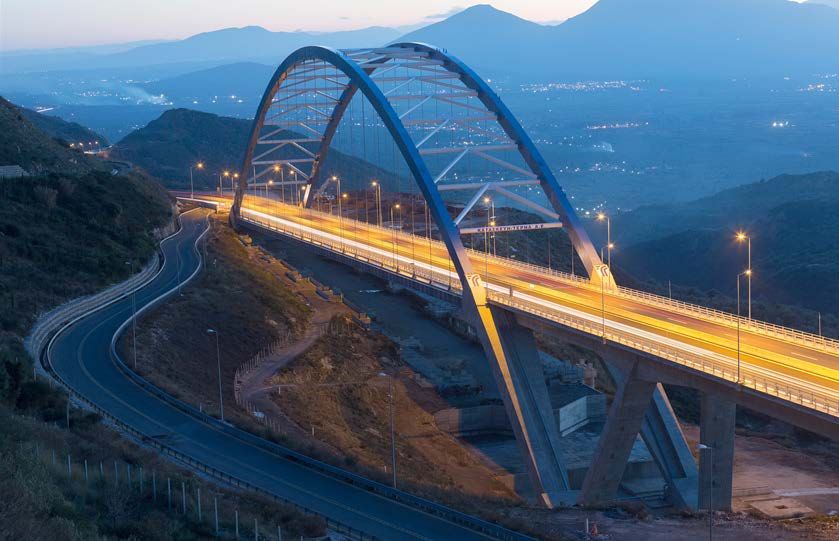
Group Structure

                  2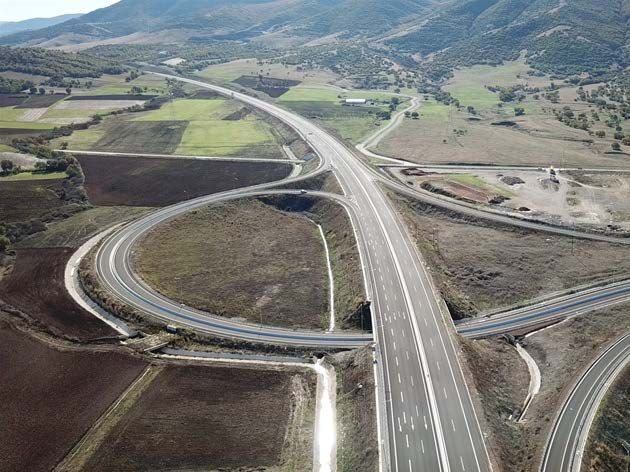
Table of Contents

  Section 1.     Group Overview                      Page   4
  Section 2.     1H2021 Results Review               Page   16
  Section 3.     Divisions Overview                  Page   21
  Section 4.     Key Takeaways                       Page   46
  Section 5.     Corporate & Social Responsibility   Page   48
  Section 6.     Macro Backdrop                      Page   51

  Appendix I.    Financial Data                      Page   56
  Appendix II.   Share Price Performance             Page   60

                                                            3
Group Overview
GEK TERNA Group at a Glance
Business Overview H1 2021 Results1
GEK TERNA Group (“GEK TERNA” or the “Group”) is one of the leading
industrial groups in Greece with operations also in Central and Southeastern €439m €136m 31.0%
Europe Revenue Adj. EBITDA(2) Adj. EBITDA(2)
Margin
Grou Structure
The Group has top position in the fields of infrastructure, energy production,
supply and trade from thermal sources and RES, concessions, waste
management €9m €946m(4) €77m
Realized investments of more than €2.5bn during the recent years Net Income Market Cap Capex
Investments of over €6.5bn in projects that the Group promotes or
participates in
The Group employees about 3,700 people
€2,272m €1,046m €4.5bn
Profitability driven by divisions with high visibility of future cashflows Debt Cash Construction
The Group’s Market Capitalization stands at €946m(4) Backlog
Adj. EBITDA1 Breakdown by Business Segment Indicative Projects Underway
High Egnatia Odos
visibility3 50% 89% 98% 98% 102% 83% Total Project Budget: €2.7bn (acquisition cost € 1.5bn,
EBITDA € 0.7bn construction cost, financials etc.)
306
280 281 285 35 years concession / GEK Terna’s %: 75%
Kafireas Wind Park
129 157 177 194
136 Total Project Budget: €569m
115
67 330 MW in Greece (South Evia) have started construction
105 67
126 103 46
32 50 28
16 19 6
(1) (11) (12) (9) (5) Hellinikon Integrated Casino Resort
(5)
2017 2018 2019 2020 H1-20 H1-21 Total project budget: c. €1bn
35 years concession / GEK Terna’s participation(6): 100%
Contsruction Concessions RES Other
1. Excluding discontinued operations. Adjusted for non-cash items 4. As of October 4, 2021
2. EBITDA + any non-cash items 5. H1 2021 excludes discontinued operations. Not directly comparable with H1 2020
3. Refers to the % of Adj. EBITDA coming from Concessions & Renewable Energy Sources 6. As of 23rd September 5
GEK TERNA History – Corporate Milestones
1999
1994
1969 1997 Terna and GEK join
1972 Listing of Terna and GEK
GEK is Incorporation of Terna forces, forming one of
Terna is established on the Athens Stock
established Energy the largest Group in
Exchange
Greece
2007 2000
Terna Energy IPO The first wind park starts
Concession commencement of operations in Greece
Nea Odos Incorporation of HERON
2008
Concession commencement of Kentriki and Olympia 2002
Odos The Group’s restructuring is completed with the
GEK & Terna merge into one entity, forming GEK absorption of GEK’s construction division by TERNA
TERNA GEK is the holding company of the Group
2020 - 2021
Construction and Concession commencement for Kastelli Airport
2018
Awarded the construction and a 35 year concession for the development and
Achieved 100% ownership in Nea and Kentriki Odos
operation of the Hellinikon Integrated Casino Resort (through the JV with Mohegan
Gaming)
6
Group Structure - Activities
GEK TERNA
Other
Construction RES Concessions
Segments
& PFIs
100% 37% 100%
Motorways
Thermal Operation &
Concessions
Energy Maintenance
100%
100% 100%
Real Estate
I Assets2
100%
100% 75%
GEK TERNA Concessions & PFIs rationale:
• Improve operating performance II
• Increase efficiency of capital investment decisions
50% 17%1
• Empower management
• Strengthen management accountability Komotini
• Improve monitoring CCGT
32.5%3
Kastelli Airport
35%4
Full Consolidation
Hellinikon IRC
Equity Consolidation
1. Other shareholders: VINCI (29.9%); HOCHTIEF (17%); J&P AVAX (19.1%); AKTOR (17%)
2. All Real Estate Segment subsidiaries are fully consolidated. Two Real Estate JVs/Associates are consolidated under the Equity method
3. Other Shareholders: Greek State (45 9%); GMR (21.6%)
4. Other Shareholders: Mohegan Gaming & Entertainment (65%) 7
Key Investment Highlights
A leader in its core markets with great positioning in upcoming infrastructure and energy transition
developments, generating recurrent cash flows with very long-term visibility

                            Leading industrial company with top positions in construction, concession, energy
                            production and the largest renewable energy portfolio of a Greek company

                                 Well diversified and cash generative business profile with presence in defensive
                                 segments with long-term recurring cash flow

                                     Favorable positioning in terms of key megatrends in infrastructure, sustainability
                                     and energy transition

                                        Business units that collaborate to generate incremental value

                                     Experienced in successful delivery of complicated projects

                                 Story of consistent organic growth and value creation

                            Strong management team with extensive experience long track record in the company

                                                                                                                          8
FCF Contribution per Segment & Key Projects
Highly visible FCF streams from concessions and energy

 Annual FCF Available to GEK TERNA Shareholders by Division, post servicing of Project Finance / Non-Recourse loans

   Operational     Pipeline

                                                                                                                                €4m - €6m         > €300m
                                                                                                                €25m - €35m
                                                                                                €35m - €45m

                                                                              €115m - €145m

           Expected Concessions FCF between €95m - €115m

                                                     (1)                                 (2)
 Nea & Kentriki         Egnatia              Casino        Kastelli Airport        RES         Thermal Energy   Construction   Other Activities Free Cash Flow to
     Odos                                                                                                                                          the Parent
                                                                                                                                                     2025

      1.   To be determined upon final participation %
      2.   Assuming no further expansion Capex
                                                                                                                                                             9
Capital Allocation
Target Capital Allocation of FCF to GEK TERNA
> €300m
35%-45%
.
. 8%-12% Gross Corporate Debt
New Investments Coverage at c.2.0-2.5x
Corporate Residual
.
Leverage
Shareholder
Growth with capital
Remuneration
deployment directed
towards expansionary
capex for high return Current corporate debt at
projects (then limited €0.62bn (bonds)
maintenance) Maintain a strong credit
Funds further levered with profile
Project Finance/ Non- Bonds expire within 2025- • Flexibility on how to allocate
recourse facilities 2027 remaining FCF between
Bond maturity designed to further debt repayments and
consider new projects shareholder remuneration
w.a. coupon of 3.0% • Ongoing share buy back
program
1. Gross Corporate Debt Coverage defined as corporate debt (c.620m) divided by FCF to GEK Terna ( >€300m)
10Optimal Balance Sheet Structure
GEK TERNA Group funding strategy is based on autonomous funding by business unit
Debt Breakdown by Segment H1 2021
5% Most of the debt sits at Energy from Renewables and Concessions, the
Energy
business units with the highest debt capacity
27% 36%
Concessions Total Debt Infrastructure and Terna Energy debt is primarily project finance
€2.3bn
Parent Company Holdco debt consists of bonds, serviced by upstream dividends
Construction 32% The Group has issued two corporate bonds of €500m and 120m, maturing
in 2027 and 2025 respectively
Recent bond covenants allow significant headroom for further growth
27%
Parent Company investments
Debt Total Debt
The group allocates debt according to debt capacity per business unit and
€2.3bn
Non-Recourse Debt / market conditions
Project Finance 73%
Weighted average corporate bonds coupon at 3.0%, as of Sept 2021
Debt Breakdown by Entity Corporate Bonds Maturity
(1) 2021
GEK Terna SA 620 620
No corporate debt
2022 maturity until 2025
Terna Energy
20 809 829
S A(2) 2023
(3)
Terna SA 63 47 110 2024
G e k T e r n a (4) 2025 120
259 259
Motorways SA Short term
2026
Motoraways
475 475 Long term
O p C o s(5) 2027 500
1. €500m bond maturing in 07/2027 and €120m bond maturing in 04/2025 4. €259.0m syndicated bond loan maturing in 07/2034
2. €359m (amortising, non-recourse) maturing in 2037, €290m (amortising, recourse) maturing in 5. €474.7m syndicated bond loan maturing in 06/2037
2032, €150m (bullet) maturing in 2026, and another €30.8m, maturing after 2027
3. €62.3m working capital, €30m (bullet) maturing in 06/2026 and €17m (bullet) maturing in 10/2025 11Investment plan
Upcoming equity commitment1 well supported by existing liquidity
Upcoming Equity Commitments Available Liquidity
Upcoming Equity Commitments for the projects of : Available cash at hand (ex-RES division)
• Heron I & II acquisition of €751m as of 1H21
• Kasteli Airport
• Hellinikon IRC
• Egnatia Motorway Concession
• Komotini CCGT Strong cashflow generation from operating
350 assets of c.€100m p.a.(ex-Terna Energy)
Healthy headroom for additional corporate
leverage (gross corporate coverage at
200
c.2.0-2.5x)
80 No corporate maturities until 2025
2021 2022 2023
1. Committed equity contributions of parent company
12Group Vision & Strategy
Key strategy pillars are focused on sustainable growth, cash generation, synergies across segments,
business resilience and high reputational standards
Grow concessions portfolio
through participation in
tenders and leveraging More than double renewable
Solidify leading position in
construction business energy installed capacity
construction
within the next 5 years
Strengthen leading position in core
Further growth and Commitment to natural
business activities in Greece
generation of FCF to equity environment
Achieve high growth rates Value creation for
Sustainable growth Continuous
by selectively investing in employees, partners,
and strong commitment to
value enhancing projects customers and shareholders
generation of high reputational
FCF to equity standards
Expansion in new business
Maintain resilient business activities and new
profile with high cash flow technologies Targeted social contribution
visibility
Selectively expand in adjacent
Focus on new technologies and
businesses with collaborating
innovation to enhance
potential with existing business
performance and growth
such as waste management
13Strategic Initiatives & Implementation by Business
Focus on new landmark contract wins such as signing of new public projects (c.€450m motorway North extension),
Construction the Hellinikon casino (c.€800m contract) and Kastelli airport (c.€500m contract)
Aim to seize the upside in construction as funds will flow into landmark developments
Optimal Group capital structure provides headroom for further growth in the segment both strategically and
opportunistically as new opportunities arise in the post-pandemic era
Concessions
Leading position in the domestic market will enable the Group to operate as a concessionaire in new projects
Terna Energy aims to grow its installed capacity in the next 5 years, targeting 3GW of installed capacity
Renewable
Energy Growth in the segment to further support the Group’s cash flow visibility
Sources
Steady growth-oriented strategy
Market Healthy capital structure enables the Group to reap the benefits of the expected market uptick
Positioning Major recent contract wins are a testament of the Groups’ commitment to pursuing new opportunities in the market
Maintain market leading position across the Group’s segments
Capture market opportunities, strengthening the Group’s core legacy business
Grow project portfolio with new projects offering high cash flow visibility and secured streams
14Sustainability as Key Focus of the Group’s Operations
Sustainable Promoting Human Strengthening the Shaping a Responsible
Environmental Protection
Development Values Group’s Social Footprint Market
• Stakeholders engagement • Integral part of strategy • Ensuring health and • Ongoing engagement with • Creation and distribution
• Identification and Safety at work local communities to build of Economic Value by
• Takes measures to reduce long-term relationships of generating and distributing
evaluation of important
adverse environmental • Continuous talent trust with its stakeholders economic value to all
economic, social &
impacts development and retention stakeholders
environmental impacts
• Engagement tools to gain
• Optimize impact through • Compliance with • Protection of human and a deeper understanding of • Ensuring business ethics
best practices, sustainable environmental legislation labour rights the inhabitants’ paramount and compliance through
initiatives and reliable needs, taking into account thorough implementation
partnerships • Protecting and preserving
the most important issues of Code of Conduct
• The Group acts under the biodiversity
of concern
United Nations
Sustainable Development
Goals (SDGs)
151H2021 Results Review
1H2021 Highlights
Increase of turnover and operating profitability (adjusted EBITDA) from continuing operations
The Group also recorded a significant expansion of its construction backlog, which along with the
projects to be signed amounts to €4.5bn (signed and pending to be signed)
Τotal investments implemented by the Group or in which the Group participates, currently exceeding
€6.5bn(1)
During the first half of 2021, the consolidated sales of GEK TERNA Group amounted to €439.4m
compared to €419.9m in the corresponding period of 2020
Operating profits (adjusted EBITDA) settled at €136.3m compared to €114.8m in the corresponding
period of 2020
The Net Debt of the Group (cash and cash equivalents minus debt) amounted to c.€1,226.4m
on 30.06.2021 compared to €1,317.2m on 31.12.2020.
1. Including the concession agreement of Egnatia Odos and the Integrated Tourist Complex with Casino in Hellinikon
17Developments during the period by activity
Activity Revenue €m(1) Comments
Turnover amounted to €69.9m compared to €67.2m in the corresponding period of
2020
Operating profitability (adjusted EBITDA) amounted to €46.2m compared to €49.9m in
H1
67 the corresponding period of 2020
2020
The GEK Terna SA.- EGIS PROJECTS S.A. consortium has been declared the
H1 Preferred Bidder for Egnatia Odos Motorway
70
2021
Concessions Kasteli Airport master plan was approved
The procedures concerning the undertaking of the Hellinikon project are evolving
In RES, strong profitability and cash flow generation continued, while the increased
revenue is attributed to the increase in fully operational parks
H1 Installed capacity amounts to 895MW, with a target of 3,000MW within the next 5
109 years
2020
H1 In Thermal Energy, the Group has reached an agreement of the acquisition of 75%
125 and 50% of the companies HERON II and HERON ENERGY respectively. In addition,
2021
Energy Production GEK Terna and MOTOR OIL Groups announced the joint development, construction
and operation of the Combined Cycle Gas Turbine Station in Komotini
A rapid recovery is expected due to the current backlog of €4.5bn(2) including a
H1 number of high quality construction projects, including the new International airport in
258
2020
Heraklion and the Hellinikon Casino
H1
Construction 248 Profitability supported by sales mix and profitability enhancement initiatives
2021
H1
6 The Group is planning to divest in the future from specific real estate assets
2020
H1 Mining is still on investment phase – no results generated
7
Real Estate Mining 2021
1. Revenues post intra-segment elimination
2. Signed and pending to be signed
18Consolidated Adj. EBITDA1 evolution
Adj EBITDA1 grew by 18.7% vs H1 2021 with main contribution coming rebounding construction
21 1 136
4
(4) (1)
115
Improved sales
mix and margin
enhancement
initiatives
H1 2020 EBITDA Construction Concession Energy RES Thermal Energy Other H1 2021 EBITDA
1. Adjusted for non-cash items, ex-discontinued operations in US
19Optimal Balance Sheet Structure - Group
Group Net Debt Bridge (€m)
1.317
1.226
94 41
(136)
(86)
Net Debt FY2020 Cash from Operations Changes in WC Capex Other Adjustments Net Debt H1-21
(before WC)
Group Net Leverage Evolution Group Cost of Debt Evolution
5,0x
5,4%
(1) 3,94%(1)
3,7x 4,4% 2.97% (excl.
4,3x
IRS)
FY2019 FY2020 H1-21 FY2019 FY2020 H1-21
1. Annualised
20Divisions Overview
21Concessions Segment
22Concessions overview
Kentriki Odos Concessions(2) 2019 2020 1H20 1H21 Parking
Total length: 231km Revenue 187.1 151.3 67.2 69.8 Parking stations all over Greece
Equity invested €67m (100%) Growth % (5.0%) (19.2%) (18.8%) 3.9% 2,235 total spaces
Senior bank debt (non recourse): Adj. EBITDA(3) 103.1 105.3 49.9 46.2 c.€10m investment
€451m Ownership varies per project, ranging
Margin % 55.1% 69.6% 74.3% 66.2%
Expiration: 2037 between 20% and 100%
EBIT 51.7 44.1 19.2 12.1
Nea Odos Waste Management/E-Ticket 1
Net Results 54.1 27.3 8.9 (6.4)
Ionian Road & Central Greece 2 waste management projects
Motorway (100% ownership)
c.€26m investment
Total length: 378.7km (159km newly
built) 1 E-ticket project
c.€8m investment
Equity invested €192m (100%)
`
Senior bank debt (non recourse):
€175m Kastelli Airport
Expiration: 2037
New airport in Crete
Olympia Odos 3,200m runway
Total length: 365km 71,620m2 terminal
Equity invested €209m (100%) 15m passengers per year
Senior bank debt (non recourse): Equity: €158.4m (100%); €36m
€675m subordinated loan
Expiration: 2041 Term: 35 years
Participation: 17% 32.5% stake
Egnatia Odos Hellinikon Casino
Total length: 883km 5-star hotel and casino
Budget: > €2.7bn Budget : €1 bn
Equity invested €400m (100%) Term: 35 years / 100% stake
Expiration: 2056
Participation: 75%
1. Through participation in Terna Energy
2. All P&L figures are shown before any inter-segmental eliminations
3. Adjusted for non-cash items 23GEK Terna Group Concession Portfolio
The Group is ready to invest on the awarded projects c.596m of equity with an average remaining life of c.35 years
Equity to be deployed
Project % Stake Commercial Operation Concession Expiration
(€m) (2)
Peloponnese waste management1 100% 16 2023 2047
Kastelli airport 33% 160 2025 2055
Hellinikon casino 100%(3) n/a 2025 2055
Egnatia Odos 75% 300 2023 2056
Total 596
…already invested c.317m of equity in projects with an average remaining life of c.25 years
Project % Stake Equity Invested (€m)(2) Commercial Operation Concession Expiration
E65 & Nea Odos motorways 100% 254 2018 2037
Olympia Odos 17% 35 2018 2044
Epirus waste management1 100% 10 2019 2047
Other (Parking, e-Ticket) 10%-20% 18 n/a n/a
Total 317
1. Reported under Terna Energy
2. Incl. Shareholders loans
3. Due to be decided 24Ionia Odos & Kentriki Odos at a Glance
Overview Main Concession Highlights
Key metrics (2020A) “Ionia Odos” Concession Project
Concession Grant: 2007
Concession End: 2037
Nea Odos Total Length: 380kmm
AADT: 35,493 17 Toll Stations: 9 on Ionia Odos and 8 on PATHE
E-65
Project Budget: over €1.1bn
Motorway 19,404
LIGHT Technical features of the two motorways: 32 bridges, 4
tunnels, 30ICs and semi-ICs and 185 underpasses and
Ionia Odos 16,088 overpasses
Motorway HEAVY
“Kentriki Odos” Concession Project
Concession Grant: 2007
P.A.TH.E.
Motorway
Kentriki Odos Concession End: 2037
AADT: 14,482 Total Length: 231kmm, currently operational 136km
10 Toll Stations: 4 on the Central Greece Motorway and 6 on
7,232 the Skarfia - Raches Fthiotidas
LIGHT
Project Budget: over €1.4bn
Technical features of the two motorways: 146 bridges, 7
7,250
HEAVY tunnels, 15 nodes and 88 fauna passages
Inflation protected pricing
Partial exposure to traffic volumes
Financial Projections
P.A.TH.E.
183.5km:
172.5km from Metamorfossi I/C to Skarfia, Prefecture of Fthiotida 2020A Period: 2021-2037
379.6km
11km connecting branch Schimatari - Chalkida
Crosses two regions and three counties Cumulative Revenue1 €136m c.€4.9bn
196km from Antirrio to Ioannina, crossing two regions and four counties
Revenue CAGR1 n/a c.4.8%
Ionia
Serves and connects the ports of Patra, Astakos and Igoumenitsa
Cumulative EBITDA1 €94m c.€2.7bn
E65 Motorway:
174km Central Greece Motorway (E-65) connecting PATHE Average EBITDA Margin1 69.1% c.54.9%
231.0km
Kentriki
Motorway to Egnatia Odos
57km – PATHE section from Skarfia to Raches Fthiotidas Cumulative Distributions2 n/a c.€1.05bn
Key asset that connects Eastern and Western Greece
Net Debt 430 n/a
1. Combined figures of Nea Odos and Kentriki Odos for the period 2021-2037
2. Distributions attributable to Gek Terna’s share
25Egnatia Odos at a Glance
Overview Main Concession Highlights
Concession Period: 35 years
Key metrics (2027E)
Toll Stations: 18 frontal stations and 43 lateral toll
stations
Transactions: 217.6m
` Project Budget: over €2.7bn (acquisition cost €
1.5bn, € 0.7bn construction cost, financials etc.)
141.7m
LIGHT Traffic History: Road axis has a long and stable
traffic history over performing against the national
24.0m GDP rate
HEAVY
Macroeconomic Environment: The Greek
economy is at an infection point while infrastructure
privatization initiatives (either concluded or planned)
shall positively affect the motorway
Inflation protected pricing
Partial exposure to traffic volumes
Financial Projections
Period: 2027-2056
Cumulative Revenue c.€11.4bn
658km:
Revenue CAGR c.2.2%
Spanning from Greece’s northwest coast to the borders with
Main Axis
Turkey, passing through the Thessaloniki metropolitan area
Cumulative EBITDA c.€6.9bn
Vital part of the Greek motorway network connecting all major
883km
cities, ports and airports in Northern Greece
Average EBITDA Margin c.60.9%
225km:
The three vertical axis connect Greece to three neighboring Cumulative Distributions1 c.€3.1bn
Vertical
countries (Albania, FYROM, Bulgaria) with fully controlled
access from Egnatia Odos
Net Debt (2027E) c.€1.2bn
1. Distributions attributable to Gek Terna’s share
26Kastelli Airport at a Glance
Overview Main Concession Highlights
More than 90% correlation between Heraklion
Key metrics
airport traffic and major (G7) advanced economies.
It is one the most significant investments that have
Pax (2019A): 8m taken place in the island of Crete and one of the
country’s top infrastructure projects.
Airport Capacity: 15m
passengers p.a. Construction is undertaken by the construction arm
of GEK TERNA under a turnkey contract
Main Runway: 3.2klm c. 60% of average annual revenues stem from
Terminal: c.70,000sqm quasi-regulated aero-activities (via a contractually
predefined mechanism for the establishment of the
charge to departing passengers)
Assumptions do not take into account the
commercial exploitation of c. 400 acres of land.
Financial Projections
Period: 2025-2054
Cumulative Revenue c.€6.6bn
Revenue CAGR c. 4.6%
Kastelli airport is planned to replace the existing “Kazantzakis” Heraklion
International Airport which is the 2nd busiest airport in Greece
35-year concession period out of which 5 years is the construction phase Cumulative EBITDA c.€4.3bn
Shareholding Structure: 45.9% Greek State, 32.5% Terna and 21.6% GMR
Average EBITDA Margin c.64.1%
Currently, two other airports are serving passenger traffic in Crete (a) at
Chania (2.7mn pax in 2015), and (b) in Sitia Airport (27k pax in 2015)
Cumulative Distributions1 c.€1.1bn
1. Distributions attributable to Gek Terna’s share
27Hellinikon IRC at a Glance
Overview Main Concession Highlights
Asset: Integrated Casino Resort (“IRC”) operating license for a Site: The site is unique, located in the south coast line of the
concession period of 30 years. greater Athens area within the overall Hellinikon Project (largest
waterfront development in Europe’s history) and in proximity to the
Location: The IRC will be developed/ constructed by the
Athens center and major transport/ transit hubs
concessionaire in a unique location within the overall Hellinikon
project. Macroeconomic / Tourism: The Greek economy is at an infection
Project Budget: c. €1bn (net of VAT) point while tourism is expected to recover fast as vaccination
progresses
Targeted IRR: 15%
Industry: The IRC market in Europe is underdeveloped with
smaller size developments while the Hellinikon IRC will capture
several major European cities within a 2 hour flight radius
Recent Developments Project Characteristics
As of 23rd of September, Gek Terna owns 100% of the project. In Hotel: Five-star (5*) hotel with a capacity of c. 3,440 beds and with
more detail, the below changes were announced:
a net room area of c. 120,000sqm
The acquisition of all the shares of MGE HELLINIKON BV by
GEK TERNA Casino: Space of 15,000sqm with 200 tables and 2,000 slot
Entrance of MGGR LLC (100% owned by GEK TERNA), which machines
is a successor and replaces all obligations and rights of
MOHEGAN GAMING ADVISORS LLC Conference and Exhibition Center: Total area of c. 23,700sqm
The above changes have as axis the further strengthening of the Sports and Cultural Events Meeting Place: c. 10,500 seats
Greek partner GEK TERNA
28Construction Segment
Construction
Significant increase in construction backlog to €4.5bn through new contract wins
Construction Outlook Projects completed & under construction
Casino resort Limassol Nikola Tesla Airport
Backlog increased to an all-time high of 4.5bn following signing of new
contracts: Hellinikon Casino (0.6bn) and Kentriki Odos North
Extension (€0.4bn)
Impeccable track record in delivering complex projects on time and on
Ionia Odos Kastelli Airport
budget, such as the Stavros Niarchos Cultural Centre and Ionia Odos
Significant infrastructure projects are expected to be tendered over the
next quarters
P&L1 Select Projects Under Execution
2019 2020 H1-20 H1-21 Project Contract (€bn)
Revenue 739.1 525.9 254.8 248.1
Kastelli Airport 0.5
Growth % (27.1%) (28.9%) (29.9%) (2.6%)
Kentriki Odos (South extension) 0.3
Adj. EBITDA(2) 16.2 19.0 6.4 27.7
Margin % 2.2% 3.6% 2.5% 11.2% Kentriki Odos (North extension) 0.4
EBIT 3.6 6.9 (0.2) 22.9
Casino Resort Limassol 0.1
Net Results (10.2) (9.7) 1.4 11.1
1. All figures are shown before any inter-segmental eliminations
2. Adjusted for non-cash items
30Construction Highlights
Infrastructure Buildings Industrial Energy
Ionia Odos Agia Nappa Marina Shell Tank Farm HERON II Power Plant
Construction and delivery of Klokova Construction of two towers (115m high); Construction of ten product tanks with a Combined Cycle Power Plant with a
tunnel (3km) in record time (24m months) complex of villas and commercial buildings total capacity of 28,000m3 nominal capacity of 435 MW
Kallidromos Tunnel Stavros Niarchos Cultural Centre Hellenic Petroleum Refinery Dafnozonara Hydro Plant
Project involves a 12m high cement dam
Double tube tunnel with a length of 9,025m Spans in a 170,000sqm park, including Construction of a new fuel production unit
alongside the powerhouse
with cross passages every 500m National Library of Greece & Greek opera in Thessaloniki
Athens Metro Riffa Views Development Kleemann Hellas HQ PPC Power Plant Megalopolis
Egaleo-Haidari extension constitutes a Construction of 326 residential two-storey Comprises 2 underground floors and 16 Combined Cycle Power Plant with a
section of Line 3, c. 1,418km long villas in Bahrain upper levels with a total height of 50m nominal capacity of 811 MW
31Greek Construction Sector – Recently Completed Projects
The infrastructure budget for the pipeline stands at c.€43.4bn, c.4x higher than the budget for completed
projects during the 2014-2019 period
Infrastructure Budget of Completed and Pipeline Projects (€bn)
43,4 Tourist Product
Upgrading
Energy
Rail
Water & Sewage
8,9
Motorway
2014-2019 2020-2026
Source: PwC report – Infrastructure in Greece
32Greek Construction Sector – Pipeline
Upcoming pipeline with a total budget of c.€50bn, in a sector where the Group has a leading position
Projects per Phase
Total Budget Number of Projects
€ 13,2bn
(26%) 37
31%
Phase A: Projects that are in the process of
52 planning, designing and maturing
44%
Phase B: Projects that are in the process of
bidding and contracting
€ 30,4bn
€ 6,9bn (60%) Phase C: Projects that are already in construction
(14%) 29
25%
Phase A Phase B Phase C Phase A Phase B Phase C
Infrastructure Projects
Type of Project Number of projects Total Budget (€m) Remaining Budget (€m)
Power Generation 8 12,582 11,602
Interconnection 7 15,931 13,712
Rail Upcoming Projects 21 11,343 8,671
Motorways 11 6,575 5,997
Tourist Product 15 2,340 1,811
Waste Management 16 1,776 1,560
Total 781 50,547 43,353
Source: PwC report – Infrastructure in Greece
Note:
1. Some projects have been grouped together and thus projects depicted at the tables do not add up to 118 projects 33Constructions – Historical Performance
Consistently positive operational profitability even during financial crisis, at a sector with strong correlation
with GDP
Revenue Evolution1 (€bn)
1,8
13%
1,6
11%
6% 9%
Average EBIT 2%
1,4
2% 0%
margin 4.1%
1,2
4%
1% 0% 1,0 1,0 1%
nm
1
1,0
0,8 0,8
0,8
0,7 0,7
0,6
0,5 0,5
0,5
0,4
0,3 0,2
0,2
0
2011 2012 2013 2014 2015 2016 2017 2018 2019 2020 H1 20 H1 21
Revenue EBIT margin
Average figures (€bn) Cumulative figures (€bn)
2010 - 2020 2010 - 2020
Revenue 0.76 Revenue 7.57
EBITDA 0.06 EBITDA 0.60
EBIT 0.04 EBIT 0.36
EBIT margin 4.1% EBIT margin 4.7%
Source: Company Financial Statements
Note: Excluding intersegment eliminations
34Backlog1,2,3 overview
Backlog Breakdown by Geography
Largest project: Design and Construction of new international airport in
7% Heraklion, Crete (€475m)
Greece Other projects include the construction of motorways, office buildings and power
projects for clients such as the Ministry of Public Works
Total Backlog: Accounts for c93% of backlog
€4.5bn
Largest Project: Execution of buildings in Agia Napa in Cyprus (€141m)
Other projects include construction of airports, roads and marinas in a number of
Overseas
93% countries including Cyprus, Serbia, Bahrain & UAE
Accounts for c7% of backlog
Construction Backlog Evolution (€bn)
GEK Terna Group traditionally acts as
concessionaire in projects representing a
4,5
significant portion of the backlog
3,9
3,3
3,1
2,8
2,5
2,1 2,2
1,9 1,9 1,8 1,6 1,7 1,6
2008 2009 2010 2011 2012 2013 2014 2015 2016 2017 2018 2019 2020 Q3 2021
1. As of Sept 2021
2. Including signed and pending to be signed projects
3. Signed and pending to be signed 35Renewable Energy
36Energy Production – Renewable Energy (Terna Energy)
Largest renewable energy platform in Greece with substantial operations abroad
Overview Installed capacity split by country2
Terna Energy is the largest renewables energy group in Greece (763 MW) with
significant activities in Poland (102 MW) and Bulgaria (30 MW)
Total installed capacity amounts to 895(1) MW
30
Strong and visible cash flow generation through a mix of Feed-in-Tariffs and 102
off-take agreements
Greece
The company is also engaged in waste management and has been awarded
two waste management concessions in Greece 895(1) MW
Poland
Plant in Epirus commenced operations in Mar 2019 while the plant in
Peloponnese is expected to commence operations in 2020
Bulgaria
330 MW in Greece (South Evia – Project Kafireas) will start construction soon, 763
consisting of
150 MW in South Evia owned by TE
Recently acquired 270MW wind park in same area (180 MW will start)
P&L(2)
2019 2020 H1 - 20 H1 - 21
Revenue 237.3 273.4 92.3 98.4
Growth % 9.7% 15.2% (17.5%) 6.6%
Adj. EBITDA(3) 176.9 193.9 66.7 67.3
Margin % 74.6% 70.9% 72.3% 68.4%
EBIT 119.7 127.5 48.4 46.1
Net Results 46.5 68.8 25.7 26.7
1. USA operations have been ceased as of H1-21
2. All P&L figures are shown before any inter-segmental eliminations
3. Adjusted for non-cash items 37Installed Capacity Evolution
Total installed capacity is projected to reach 3GW by 2026
Installed capacity evolution (GW)
To begin construction
3.0
1,1
Under construction / Ready to build 0.6
1,4 1,4
0,1 1,3
0,3
1,0
1,0 (1)
0,9
0,7
0,6 0,7
1. Decrease due to deconsolidation of US assets
38Overview of current portfolio and future pipeline
Organic growth and value creation with a focused strategy and attractive pipeline
Terna Energy EBITDA (€m) Terna Energy Capital Expenditure (€m)
Installed
cap.
(MW) 640 664 738 986 1,032 1,390 1,373 860 895
229
205
195
182
168 146
148
116 109
99 86 89 89
(1) (1)
74 68 68 69
58
2014 2015 2016 2017 2018 2019 2020 H1 - 20 H1 - 21 2014 2015 2016 2017 2018 2019 2020 H1 2020 H1 2021
Pipeline
Expected
Total Project Cash Grant/Tax Project Finance
Project Type Capacity Equity / Cash commercial
Cost(2) Equity Debt
operation
€m €m €m €m
Peloponnese Waste Management Waste 2.4 MW 123 66 40 17 2022
South Evoia (Kafireas) Wind 330 MW 569 - 455 114 2022-2023
Evritania Wind 67 MW 81 - 63 18 2022-2023
Total - Under Construction 399 MW 773
Amfilochia Pumped Storage Storage c.600 MW c.500 2024-2026
Various Projects Solar c.600 MW c.300 2024-2026
Various Projects Wind c.513 MW c.500 2024-2026
Total - Pipeline c.1,713 MW c.1,300
Total c.2,112 MW c.2,073
1. Post US deconsolidation
2. Total project cost = Cash grant/Tax equity + Project finance Debt + Equity
39Leverage – Terna Energy
Significant headroom for additional investments
Gross Financial Debt (€m) Cash (€m)
954 374
810 341
2020 H1 2021 2020 H1 2021
Net Leverage Net Cashflow from Operations (€m)
93
89
4,6x
3,2x
2020 H1 2021* H1 2020 H1 2021
* Annualised EBITDA. Cash includes restricted deposits
40Thermal Energy Segment
41Thermal Energy Segment – Overview
GEK TERNA Group is engaged in thermal energy production and electricity distribution through Heron
I, Heron II and Heron Supply, as well as the Komotini CCGT, which is currently under construction
Overview of Assets Overview of Income Statement1
Project Status MW Type Share Ηeron Group 2020A
HERON I In operation 147 OCGT 100%
Revenue €537.3m
HERON II In operation 432 CCGT 100%
Electricity EBITDA €25.7m
HERON Supply In operation n/a 100%
Supply EBIT €13.5m
Komotini CCGT Under const. 880 CCGT 50%
HERON I HERON II
Operates the first private thermal plant in Greece The group constructed and started operation of a CCGT power
OCGT - 147 MW capacity and 40% efficiency plant (432 MW capacity)
Operational since September 2004 In operation since August 2010
100% stake Fully repaid
100% stake
HERON Supply
HERON is one of the leading providers of electricity and gas in Greece, with more than 270,000 customers (households and businesses)
Amongst the top-3 alternative electricity suppliers in the Greek market holding a 6.74% market share (as of August 2021)
HERON has a number of green and emobility programs in the Greek market, such as EcoUP and EcoDrive. Through them, households,
businesses and owners of electric cars are given the opportunity to consume electricity, which is produced 100% from Renewable Energy
Sources (RES)
Though the affiliation with TERNA ENERGY, the largest Greek company in the field of clean energy production and storage, HERON and
TERNA ENERGY are already collaborating and offering to customers of HERON new innovative products based solely on clean energy
produced from RES
1. Pro-forma, 100% ownership
42Thermal Energy Segment – Komotini CCGT at a Glance
Overview Investment Highlights
Description: Construction and operation of a new highly efficient Market Dynamics: Favorable for a new investment in the energy
space as:
Combined Cycle Power Plant with a total capacity of 880MW and
PPC has decided to decommission several of its older lignite
natural gas as primary fuel.
fired power plants (four plants with a capacity of 2.700MW).
Revenue Model: Major part of the energy output of the new power Thus the Greek System will require base load power units.
plant will be contracted and utilized by market entities belonging to Increased penetration of RES will require the extra flexibility
provided by this specific plant.
the parent companies of the Joint Venture.
Know How: GEK TERNA Group has more than a decade of
Sponsors: GEK TERNA Group in partnership with Motor Oil Group experience in the thermal energy market.
on a 50-50% basis.
Distributions to GT: c.€250m during the first ten years of
Project Budget: €375m (net of VAT) operation.
Project Status Financial Projections
Vendor Selection: The JV has selected Siemens as the equipment Period: 2025-2034
provider. Siemens HL technology offers the highest efficiency
Cumulative Revenue c.€3.3bn
plant in Greece with improved operating flexibility and increased
ramp up rates.
Cumulative EBITDA c.€0.8bn
Average EBITDA Margin c.25.8%
43Real Estate & Mining
44Real Estate & Mining
Real Estate Overview Real Estate P&L1
GEK TERNA is engaged in Real Estate P&L 2019 2020 H1 - 20 H1 - 21
development - the company holds a differentiated
Revenue 5.2 4.2 2.0 2.6
portfolio in Greece and abroad
Offices Growth % (47.0%) (19.6%) 7.9% 30.6%
Commercial properties
Adj. EBITDA(2) 0.2 0.3 0.4 0.5
Residential properties
Entertainment parks Margin % 4.1% 6.0% 22.5% 17.4%
Logistic centers-industrial parks
EBIT 0.4 (0.9) 0.1 0.1
Hotels – Resorts
Parking stations Net Results 0.3 (2.4) (1.4) (0.1)
Mining Overview Mining P&L1
GEK TERNA engages in Mining activities P&L 2019 2020 H1 - 20 H1 - 21
through Terna MAG and mines its products in
Revenue 9.9 7.1 4.2 4.1
Euboea island
The company produces Growth % (13.1%) (28.4%) (11.1%) (2.9%)
Caustic Calcined Magnesia (CCM)
Adj. EBITDA(2) (4.1) (4.1) (3.8) (1.4)
Dead Burned Magnesia (DMB)
Raw Magnesite Margin % nm nm nm nm
Mineral Flame Retardants
EBIT (10.8) (13.2) (8.3) (3.8)
The company currently holds enough magnesite
reserves to sustain production for over 50 years Net Results (21.0) (16.3) (10.3) (4.0)
1. All P&L figures are shown before any inter-segmental eliminations
2. Adjusted for non-cash items
45Key Takeaways
46Key Takeaways
Uniquely positioned to benefit from positive macro backdrop along with sustainability and energy transition mega trends
Highly visible and sustainable cash flow available to shareholders from operating assets
Significant growth expected over the coming years as more assets reach commercial operation
Solid balance sheet structure, with healthy corporate leverage and no bond maturities until 2025 and additional headroom allow for
seamlessly strategic plan execution
Experienced and proven management team and strong shareholder base
Annual FCF Available to GEK TERNA Shareholders by Division, post servicing of Project Finance / Non-Recourse loans
Operational Pipeline
€4m - €6m > €300m
€25m - €35m
€35m - €45m
€115m - €145m
Expected Concessions FCF between €95m - €115m
(1)
Nea & Kentriki Egnatia Casino Kastelli Airport RES (2) Thermal Energy Construction Other Activities Free Cash Flow to
Odos the Parent
1. To be determined upon final participation %
2. Assuming no further expansion Capex
47Corporate & Social Responsibility
48Corporate and Social Responsibility
The Group’s vision is to continue to be one of the most prominent Greek companies, while
contributing to sustainable development and value creation for its employees and stakeholders
Environmental protection is an integral part of the Group's strategy and is expressed In 2020, the production of clean
through its political, strategic and business decisions and actions. The Group acts energy from RES amounted to
purposefully and takes measures to reduce adverse environmental impacts while
ensuring business continuity and compliance with environmental legislation 4,151,134MWh
In 2020, the weight of hazardous
waste reused, recycled or
The Group undertakes a systematic and detailed recording of its waste, to evaluate
recovered amounted to
and monitor its performance in the long run
173.3t
In 2020, the hours of training of
The Group takes conscious measures to achieve a balanced and safe workplace that
the 2,384 employees received
rewards innovation, participates in the materialization of its vision, expands its
amounted to
international prospects and contributes towards business success
15,234 hours
The Group handles human resources issues without prejudice and ensures that every
In 2020, the percentage of
employee is treated fairly and without discrimination. The Group’s policy leaves no
female employees amounted to
room for discrimination or preferential treatment in terms of pay or benefits on the
basis of gender or other characteristics c.30%
In 2020, the direct value
Ongoing engagement with local communities helps the Group build long-term distributed to all stakeholders
relationships of trust with its stakeholders and prove the transparent and responsible amounted to
attitude it daily takes towards them
> €1bn
49Remuneration Policy – Framework of Principles
Compliance
Serves for the appropriate and efficient risk management
and prevents conflict of interest situations
Transparency
Presents with clarity the structure of every kind of
remuneration that is regulated by the present policy
Interests of the Company and
its shareholders
Provides for a reasonable and fair level of remuneration that Framework of
aims to the creation of added value in both the long run and Principles
short-term
Competitiveness
Provides the discretion to create competitive remuneration
packages, that may attract or maintain capable and
distinguished executives
Meritocracy
Contributes in the diffusion and consolidation of the
principles of meritocracy, justice, proportionality in the
formation of the remuneration framework
50Macro Backdrop
51Favorable Macro Conditions
After years of contraction in GDP Evolution
the Greek economy, a strong
recovery is expected to take Q2 2021
10,0% +16.2%
place Y-O-Y (1)
6,1% (1)
Q2 2021 GDP increased by 5,0%
4,5%
16.2% on a y-oy basis and 2,4%
1,3% 1,6% 1,9% 1,5% 1,5% 1,4%
3.4% on a q-o-q basis 0,7%
0,0%
10-year Greek government (0,4%) (0,5%)
bond yields have reached the (5,0%)
lowest level compared to
recent years
(10,0%) (8,2%)
2014 2015 2016 2017 2018 2019 2020 2021E 2022E 2023E 2024E 2025E 2026E
International investors have
shown confidence in Greece
through increased exposure in 10Y Greek Government Bond Yield
various industries of the
domestic market 20,0%
15,0%
10,0%
5,0%
0,0%
Sep-14 Sep-15 Sep-16 Sep-17 Sep-18 Sep-19 Sep-20 Sep-21
Sources: IMF, Bloomberg,
Note:
1. Greek Government latest estimate 52Evident Need for Significant Investments
Domestic Gross Fixed Capital Gross Fixed Capital Formation (Other Buildings and Structures) (€bn)
Formation, currently standing
ay €4.9bn, has decreased 59% decrease
substantially over the years 11,5
11,0
10,0
Greece is lagging its 7,0 7,1 7,4 7,7 7,4
6,8 6,5
European counterparts in 5,9
terms of GFCF as % of GDP 4,4 4,8
with infrastructure severely
affected by the deep
recession
2008 2009 2010 2011 2012 2013 2014 2015 2016 2017 2018 2019 2020
The continuous
underinvestment and lagging
transport infrastructure cost Gross Fixed Capital Formation (% of GDP)
have created the need for
significant investments 30,0
domestically
21,3
20,0
10,0 11,1
0,0
Greece EU-28
Sources: World Bank, Elstat
53Favorable RES Market with Growth Potential
RES’ contribution in gross RES’ % Contribution in total Gross Electricity Production
electricity production is expected
to reach 66% by 2030 in Greece
The targets set out in the Hellenic 57%
66%
Republic’s National Energy and 51%
42%
Climate Plan suggest an appetite 33%
towards RES and the regulatory
framework is expected to help
facilitate those targets
2020 2022 2025 2027 2030
There is a government
commitment to shut down lignite Indicative EU Recovery Fund Initiatives
plants, creating more room for
growth in the RES space Initiative Description Requested Amount
In addition, initiatives led by the
Shut-down of all operating lignite plants by 2028 for
EU Recovery Fund are expected Delignification €300m
environmental purposes
to further support the Group’s
growth
RES Support of RES projects with a focus on innovative technologies €10bn
The Group’s leading position in
the market combined with its
capital structure will enable it to Spatial and
Acceleration of spatial planning €350m
win new contracts and seize Urban Plans
opportunities as they arise in the
market Comprehensive urban regeneration programme to upgrade
Urban
buildings deemed of historical importance and renovate urban €360m
Regeneration
areas
Waste
Construction of waste treatment and recycling plants €660m
Management
Modernization of Funding for major projects such as the Crete – Attica
the Electricity Interconnection and the Fourth Phase of the Interconnection of €600m
Network Cyclades
Sources: Ministry of Energy, Hellenic Republic
54Recovery and Resilience Fund
Greece has received the highest allocation of grants in the EU in respect of % of its GDP and is expected to
experience catalyst growth and economic transformation
RRF Grants & Loans available to Greece (€bn)
Payments Horizon
5,5 5,5 5,5 5,5
4,4 3,1 3,1 3,1 3,1
2,9
1,5
1,6
1,9 2,4 2,4 2,4 2,4
1,3
2021 2022 2023 2024 2025 2026
Loans Grants
RRF Allocation of Grants, net of expected payments (% 2019 GDP)
11
8,8
9
7 5,5 5,5 5,4
5 3,9 3,5 3
3 2 1,9 1,7
1
-1 (0,5) (0,9) (1,4)
-3 (1,9) (2,0) (2,2) (2,4)
GR PT SK LV LT ES CY EE IT SI MT FR BE FI IE LU AT
Sources: European Commission, Hellenic Republic, NBG Securities
55Appendix I – Financial Data
56Group Balance Sheet
Figures in € (000') Group
1H2021 1H2020 FY2020 FY2019
Assets
Total non‐current assets 2,272,043 3,091,089 2,836,302 3,013,538
Total current assets 1,731,622 1,245,105 1,799,420 1,295,731
Total Assets 4,003,665 4,336,194 4,635,722 4,309,269
Equity & Liabilities
Shareholders’ equity
Share capital 58,951 58,951 58,951 58,951
Share premium account 381,283 381,283 381,283 381,283
Reserves 491,232 453,421 474,523 408,005
Retained earnings (451,945) (418,779) (402,514) (352,318)
Total Shareholders' Equity 479,521 474,876 512,243 495,921
Non‐controlling interests 256,226 238,244 311,625 270,954
Total Equity 735,747 713,120 823,868 766,875
Liabilities
Long‐term loans 2,076,625 1,794,176 2,198,693 1,788,773
Total non‐current liabilities 2,597,766 2,674,836 3,010,266 2,643,882
Total current liabilities 670,152 948,238 801,588 898,512
Total Liabilities 3,267,918 3,623,074 3,811,854 3,542,394
Total Equity & Liabilities 4,003,665 4,336,194 4,635,722 4,309,269
57Group P&L
Figures in € (000') Group
1H2021 1H2020 FY2020 FY2019
Continuing operations
Turnover 439,376 419,907 971,305 1,155,739
Cost of sales (343,630) (334,727) (756,476) (919,263)
Gross profit 95,746 85,180 214,829 236,476
Administrative and distribution expenses (40,644) (34,956) (79,489) (75,658)
Research and development expenses (3,101) (1,581) (4,516) (3,931)
Other income/(expenses) 15,831 5,028 14,283 (3,162)
Results before taxes, financing and investing activities 67,832 53,672 145,107 153,725
Net financial income/(expenses) (55,454) (34,997) (99,467) (72,267)
Profit / (loss) from sale of participations and securities (443) (281) 27,194 (520)
Profit / (loss) from valuation of participations and securities 17 (1,579) (1,808) 3,386
Income / (losses) from participations and other securities 830 843 856 1,408
Profit / (loss) from the consolidation of associates under the
(125) (91) (1) (214)
equity method
Profit / (loss) from the consolidation of joint ventures under
(444) 3,812 (452) (7,700)
the equity method
Earnings before taxes 12,213 21,379 71,429 77,817
Income tax (2.875) (1,945) (13,358) (22,086)
Net Earnings/(losses) after taxes 9.338 19,434 58,071 55,731
Attributable to
Shareholders of the parent from continuing operations (8,775) 2,287 12,461 23,457
Non‐controlling interests from continuing operations 18,114 17,147 45,610 32,274
58Group Cash Flow
Figures in € (000') Group
1H2021 1H2020 FY2020 FY2019
Cash Flows From Operating Activities
Earnings before tax 12,213 21,379 71,429 77,817
Depreciation 51,695 47,414 128,414 122,822
Fixed assets grants amortization (2,864) (2,778) (7,034) (8,194)
Provisions 13,713 6,716 18,825 1,073
Impairments 699 5,489 7,772 16,194
Other non‐cash expenses/revenue (2,590) (22,655) (26,710) (10,468)
Interest and related revenue (4,752) (4,402) (17,432) (9,584)
Interest and other financial expenses 51,640 46,687 137,327 127,861
Results from derivatives 8,566 (7,287) (20,428) (46,011)
Other Adjustments 7,238 (1,367) (12,414) 2,038
Operating profit before changes in working capital 135,558 89,196 279,749 273,548
(Increase)/Decrease in:
Inventories (3,764) 275 2,187 (2,248)
Investment property as main activity 779 640 1,377 1,985
Trade receivables 17,996 100,894 50,545 90,335
Restricted Deposits (5,653) (12,583) (54,461) 12,361
Prepayments and other short term receivables 203 34,617 50,579 19,487
Increase/(Decrease) in:
Suppliers (11,509) (38,961) (20,955) (43,619)
Accruals and other short term liabilities (46,523) (24,868) 14,978 (96,815)
Income tax payments (8,466) (6,345) (7,782) (16,894)
Net cash flows from operating activities 50,040 187,796 316,217 238,140
Cash Flows From Investing Activities
(Purchases) / Disposals of fixed assets 3,389 1,616 (121,808) (186,952)
Other Cash from Investing Acivities (83,261) (141,419) (22,923) (51,306)
Net cash flows for investing activities (79,872) (139,803) (144,731) (238,258)
Cash flows from financing activities
Proceeds from Short term loans 11,007 191,022 209,036 282,610
Payments towards Short term loans (25,328) (76,738) (208,129) (281,624)
Proceeds from long term loans 89,516 57,604 917,662 615,053
Payments towards long term loans (61,998) (48,019) (399,722) (482,564)
Dividends paid to Non-Controlling Interests (536) (11,644) (25,744) (696)
Interest & other financial expenditure (39,588) (28,969) (91,249) (89,017)
Other Cash from Financing Acivities (5,501) (84,418) (54,590) 27,519
Net cash flows from financing activities (32,428) (1,162) 347,264 71,281
Effect of foreign exchange differences in cash (498) (406) (5,004) 266
Net change in cash and cash equivalents from continuing
(62,758) 46,425 513,746 71,429
operations
Beginning of Period Balance 1,108,417 594,671 594,671 523,242
End of Period Balance 1,045,659 641,096 1,108,417 594,671
59Appendix II – Share Price Performance
60Share Price Performance
3-Year Share Price Performance
Return (%)
240%
190%
140%
90%
40%
GEK TERNA Holdings, Real Estate, Construction S.A. ATHEX Composite
Shareholder Structure1 Key Share Price Data
Share Price Data (€)1 Key Statistics FY-2020
12 month low 5.8 Market Cap.1 (€m) 851
Georgios Peristeris
12 month high 10.5 Net Debt (€m) 1,226
31,8%
Latsco Hellenic Holding Current price 9.0
60,6%
7,6% 3 mth VWAP 9.4
Free float
6 mth VWAP 9.8
12 mth VWAP 9.0
1. As of September 30,2021
6162
You can also read