COVID-19 and the Future of US Fertility: What Can We Learn from Google? - IZA DP No. 13776 OCTOBER 2020
←
→
Page content transcription
If your browser does not render page correctly, please read the page content below
DISCUSSION PAPER SERIES

IZA DP No. 13776

COVID-19 and the Future of US Fertility:
What Can We Learn from Google?

Joshua Wilde
Wei Chen
Sophie Lohmann

OCTOBER 2020
DISCUSSION PAPER SERIES

IZA DP No. 13776

COVID-19 and the Future of US Fertility:
What Can We Learn from Google?

Joshua Wilde
MPI for Demographic Research and IZA
Wei Chen
Fordham University
Sophie Lohmann
MPI for Demographic Research

OCTOBER 2020

Any opinions expressed in this paper are those of the author(s) and not those of IZA. Research published in this series may
include views on policy, but IZA takes no institutional policy positions. The IZA research network is committed to the IZA
Guiding Principles of Research Integrity.
The IZA Institute of Labor Economics is an independent economic research institute that conducts research in labor economics
and offers evidence-based policy advice on labor market issues. Supported by the Deutsche Post Foundation, IZA runs the
world’s largest network of economists, whose research aims to provide answers to the global labor market challenges of our
time. Our key objective is to build bridges between academic research, policymakers and society.
IZA Discussion Papers often represent preliminary work and are circulated to encourage discussion. Citation of such a paper
should account for its provisional character. A revised version may be available directly from the author.

                                                     ISSN: 2365-9793

                                           IZA – Institute of Labor Economics
Schaumburg-Lippe-Straße 5–9                      Phone: +49-228-3894-0
53113 Bonn, Germany                             Email: publications@iza.org                                    www.iza.org
IZA DP No. 13776 OCTOBER 2020
ABSTRACT
COVID-19 and the Future of US Fertility:
What Can We Learn from Google?*
We use data from Google Trends to predict the effect of the COVID-19 pandemic on future
births in the United States. First, we show that periods of above-normal search volume for
Google keywords relating to conception and pregnancy in US states are associated with
higher numbers of births in the following months. Excess searches for unemployment
keywords have the opposite effect. Second, by employing simple statistical learning
techniques, we demonstrate that including information on keyword search volumes in
prediction models significantly improves forecast accuracy over a number of cross-validation
criteria. Third, we use data on Google searches during the COVID-19 pandemic to predict
changes in aggregate fertility rates in the United States at the state level through February
2021. Our analysis suggests that between November 2020 and February 2021, monthly
US births will drop sharply by approximately 15%. For context, this would be a 50% larger
decline than that following the Great Recession of 2008-2009, and similar in magnitude to
the declines following the Spanish Flu pandemic of 1918-1919 and the Great Depression.
Finally, we find heterogeneous effects of the COVID-19 pandemic across different types
of mothers. Women with less than a college education, as well as Black or African
American women, are predicted to have larger declines in fertility due to COVID-19. This
finding is consistent with elevated caseloads of COVID-19 in low-income and minority
neighborhoods, as well as with evidence suggesting larger economic impacts of the crisis
among such households.
JEL Classification: J11, J13, I10, C53
Keywords: COVID-19, google, fertility, prediction, statistical learning
Corresponding author:
Joshua Wilde
Max Planck Institute for Demographic Research
Konrad-Zuse-Straße 1
18057 Rostock
Germany
E-mail: wilde@demogr.mpg.de
* This research was improved by discussions with (in alphabetical order) Padmaja Ayyagari, Kieron Barclay, Kasey
Buckles, Jennifer Caputo, Audrey Dorelien, Peter Eibich, Willa Friedman, Kathryn Grace, Melanie Guldi, Mahesh
Karra, Mine Kühn, Giulia La Mattina, Susie Lee, Mikko Myrskyla, Daniela Negraia, Natalie Nitsche, Anna Oksuzyan,
Lucie Schmidt, Alyson van Raalte, David Weil, and Emilio Zagheni. Author Contributions according to the CREDIT
taxonomy: Joshua Wilde: Conceptualization, Methodology, Formal Analysis, Writing - Original Draft; Wei Chen:
Investigation, Data Curation, Writing - Review & Editing; Sophie Lohmann: Software, Data Curation, Writing - Review
& Editing. The authors declare no competing interest.1 Introduction
The COVID-19 pandemic has had significant consequences for human mortality. At their
peak, all-age weekly excess deaths exceeded 14% in Germany, 45% in the US, 90% in
Italy, and 154% in Spain[1]. While most attention is focused on the current mortality and
economic consequences of the pandemic, its effects on fertility are currently unknown[2].
In spite of this uncertainty, some in the popular media have suggested the pandemic will
result in a “baby boom” as couples spend more time together. Such pronouncements are
viewed with skepticism by many demographers, citing evidence on the short-term fertility
effects from other mortality crises, including natural disasters [3] [4] [5] [6] and previous
pandemics [7] [8]. These studies generally show that mortality spikes are followed by
reductions in births within a year, with some evidence of fertility rebounds after several
years [9]. Theoretically, these declines are explained by couples’ aversion to childbear-
ing during periods of economic uncertainty, in an unhealthy environment, or by increased
spontaneous pregnancy termination due to stress or disease [10]. While some rebounds
have been even larger than the initial decline and led to long-run increases in fertility, these
usually occur when mortality spikes are concentrated in children as parents attempt to re-
place deceased offspring — a mechanism which should be less relevant for the COVID-19
pandemic, since it primarily affects mortality among older individuals [5] [6].
Fertility change has significant economic and social consequences[11] [12]. Reduc-
tions in birthrates accelerate population ageing, increasing dependency ratios in popula-
tions already far below replacement fertility, such as in Southern Europe and East Asia[13].
This can lower economic growth by reducing the fraction of working age population, while
simultaneously increasing the burden of caring for the elderly, both through public social
programs as well as private channels[14] [15]. However, these social and economic ef-
fects are mainly affected by long-run fertility change. If the mortality crises only leads
to a postponement of childbearing and leaves lifetime births per woman unchanged, the
long-run economic effects from postponement should be minimal. However, recent post-
crisis fertility declines — including the 2008-2009 financial crisis – did not experience a
rebound and led to permanently lower fertility rates. Since the exact nature of the effect of
COVID-19 on the future of human fertility is unclear, the economic and social affects of
the crisis due to demographic change is also unknown.
Human gestation takes on average 268 days, so there is a natural delay from the onset
of these crises and their effect on full-term births [16]. For example, full-term births from
conceptions realized during the rapid onset of the pandemic in February or March of 2020
would not appear until November or December. Unfortunately, this delay in understanding
the effect of the pandemic on fertility is compounded since natality data generally does
not become available for analysis instantaneously. For example, the US Natality File birth
microdata from the National Center for Health Statistics (NCHS) are generally released at
least 6-9 months after the end of the year in which those births occurred. Therefore, the
earliest analyses of the pandemic’s beginnings on birth outcomes using these traditional
data will not be available until late 2021, with more detailed analyses including births from
2early 2021 not becoming available until late 2022. Even in countries which have faster data
releases, significant delays between the advent of births and the release of data hamper the
ability of researchers to make timely analyses of the relationship between COVID-19 and
fertility rates.
An emerging literature suggests that data on Google searches can be used to monitor
a number of social and biological phenomena in the absence of more reliable or timely
data. Such data have been used for real-time analyses of disease outbreaks such as the
seasonal flu and Dengue[17] [18], as well as studies on well-being [19], tourism [20],
financial trading behavior [21], and demographic processes such as fertility [22], migration
[23], sexual behavior [24] [25] [26], and mortality [27]. Moving beyond now-casting with
Google data is generally difficult due to complexity or uncertainty surrounding the long-
term processes which govern such phenomena. Fortunately, behavior and information-
seeking surrounding human gestation takes place in predictable phases, and with well-
known time lags, making Google search data particularly appealing for prediction. As an
example, morning sickness generally only occurs during the first trimester, so an increase
in searches for morning sickness and its symptoms may help pinpoint an increase in the
fertility rate over half a year in the future, and with an accuracy of just a few months.
In addition to uncertainty surrounding the pandemic’s effect on fertility, there may be
important heterogeneous effects across sub-national regions, or between socioeconomic
groups. For example, COVID-19 incidence and mortality have been elevated among the
Black or African American community in the US, and the economic impacts have been
particularly acute for workers with lower levels of education[28] [29]. Additionally, while
planned births may fall as the economic fallout of the pandemic induces couples to delay
childbearing, reduced contraceptive access may lead to an increase in unintended pregnan-
cies. This effect is particularly acute for areas with historically poor contraceptive access:
A 2020 UNFPA report noted that COVID-19 is already excacerbating unmet family plan-
ning needs due to a variety of reasons, including decreased demand for health facility vis-
its, unavailability of trained medical staff, and supply chain distruptions for contraceptive
commodities[30]. Analyzing differential changes in Google search volumes across regions
with varying proportions of ethnic and other socioeconomic groups may yield deeper in-
sights into the potential effects of COVID-19 on fertility.
In addition, heterogeneous changes in the types of keywords searched across regions
may help pinpoint specific mechanisms by which the pandemic will affect fertility. For
example, information-seeking on Google regarding emergency contraception may indicate
possible changes in unplanned pregnancies, while searches for miscarriages may indicate
fetal loss. Finally, inasmuch as behavior regarding conception and sexual behavior is con-
sidered by many to be socially taboo, some individuals may be more willing to search for
such information on the internet than to discuss their behavior in person [26]. Therefore,
although Google data is only an imperfect reflection of the behaviors which affect fertility,
it may more accurately reflect actual behavioral change than a direct self-report of those
behaviors.
3In this study, we use high-frequency data Google search term volume for keywords
related to fertility to predict the direction, magnitude, and timing of fertility change ex-
pected from the pandemic in the United States at the state level. We do this in four steps.
First, we show that periods of above-normal search volume for Google keywords relating
to conception and pregnancy are associated with higher numbers of births in the following
months. Excess searches for unemployment keywords has the opposite effect. Second,
by employing simple statistical learning techniques, we demonstrate that including infor-
mation on keyword search volumes in prediction models significantly improves forecast
accuracy over a number of cross-validation criteria. Third, we use data on Google searches
during the COVID-19 pandemic to predict changes in aggregate fertility rates in the United
States at the state level through February 2021. Finally, we test for heterogeneous effects
of the COVID-19 pandemic on fertility by education, ethnic identity, and age of mother,
and by parity of birth.
2 Data and Methods
2.A Google Data
Our data on keyword search frequency comes from Google Trends (http://trends.google.com),
a website which allows users to access data on Google keyword search frequency, stratified
by geographic regions ranging from as large as a country to as small as a city. Data for
smaller geographic areas can be more difficult to use, since the data are suppressed unless
the overall search volume reaches a minimum threshold. For this article, we use data from
the state level in the United States to ensure a wide selection of available search terms, yet
still preserve geographic variation in search frequency.
2.B Natality Data
Data on births by state and month are from the National Vital Statistics System (NVSS)
which is part of the National Center for Health Statistics (NCHS). Monthly birth counts
for each US state and the District of Columbia from 2004-2018 were used, since 2004 was
the year the Google search data began, and 2018 is the most recent year of data on births
is available. This yields 15 years of usable data across 51 geographic regions, or 9,180
possible state-month-year observations.
3 Methods
3.A Keyword Selection
Keyword sets were created in a multi-step process. Initially, keywords were chosen by
brainstorming possible words which we believed to be predictive, specific, and common
4enough for use in forecasting. We then sought input from other researchers to inform our-
selves of any important topics or keywords we might be missing. Due to the necessarily
arbitrary initial keyword set, all keywords were pre-selected before looking at Google data
in order to avoid data-mining. Details on each selected keyword or topic and their mean-
ing are discussed in the Supplemental Information. The list of inital keywords or topics
are: Baby Heartbeat, BabyCenter, Birth Control, Clearblue, Conceive, Cytotec, Dilation
and Curettage, Divorce, Emergency Contraception, File Unemployment How, Folate, Fur-
lough, Human chorionic gonadotropin (hCG), Intra-uterine Device (IUD), In-vitro Fer-
tilization (IVF), Layoff, Medical Abortion, Midwife, Miscarriage, Misoprostol, Missed
Period, Morning After Pill, Morning Sickness, Obygn, Online Dating, Ovulation, Ovula-
tion Test, Plan B, Porn, Pregnancy, Pregnancy Bleeding, Pregnancy Symptoms, Pregnancy
Test, Pregnant, Prenatal Vitamins, Sexually Transmitted Infection (STI), Ultrasound, Un-
employment, Unemployment Office, Unprotected Sex, and a control set. We then subjected
each keyword to a series of three screens in order to test goodness of fit and predictive
power. These screens are mentioned in the main text, and described more fully later in this
section and in the Supplemental Information. In addition, details on our statistical learning
method for selecting the most predictive keywords for the MSPE Reduction keyword set
are also outlined in the Supplemental Information.
3.B Prediction Model
Our baseline prediction model is an OLS regression as follows:
2
X W X
X T
Ysmy = αsm + γs ∗ ts + w
βw,t−l Ismy + smy (1)
s=1 w l=t0
where s, m, and y index state, month, and year respectively, αsm is a state-month fixed
effect, γs ∗ t is a state specific linear and quadratic time trend. The independent variables
w
Ismy are the natural log of the normalized search volume as given by the google data and
whose construction are outlined in the supplemental information. The double summation
represents a series of β coefficients for the effects of different keywords search volumes
at a number of monthly time lags. The dependent variable Y is the natural log of births,
implying the interpretation of the βs are an elasticity — the percentage change in births
from each percentage change in monthly search volume. We use t0 of 7 and a T of 12,
representing monthly time lags from 7-12 months before birth. Huber–White standard
errors are utilized for estimation.
3.C Data Screens and Cross-Validation Techniques
We use three data screens to reduce our initial keyword set. We first omits any keyword
for which more than 1/3 of the 9,180 state-month observations were missing. Second, we
further omitted any keywords that were not jointly or individually significant predictors
of births for the lagged months 7-12. We call this the Significance screen, which selected
514 keywords for inclusion, listed in alphabetical order: ClearBlue, Divorce, HCG, IVF,
Layoff, Morning Sickness, Ovulation, Porn, Pregnancy Test, Pregnancy, Pregnant, STI,
Ultrasound, and Unemployment.
Next, the MSPE Reduction screen used a statistical learning procedure called forward
step-wise selection to select the keywords from the Significance screen which lead to the
largest reduction in mean squared prediction error (MPSE). To find this MSPE reduction,
we used a variation of the ”Leave-One-Out” cross-validation technique in which for each
tested keyword set, we omit two years of data, train the data using the remaining 13 years,
and then use the estimated associations to predict births in the omitted two years. We
then calculate the prediction error as the absolute value — in percentage terms — of the
difference between these predictions and the actual births for every state-month. We then
repeat for every possible combination of two years of data, resulting in 105 model runs.
We then average the mean squared prediction error across the runs to find the MSPE for
that keyword set.
The forward step-wise selection learning procedure proceeds as follows. First, the base
model without any keywords is estimated. Then, we add each keyword one at a time to
the model (and a control keyword) and employ the MSPE calculation procedure described
above for each word. The word which minimizes the MSPE the most is selected, and
becomes part of the base model. Then a second round begins, where each remaining word
is selected to be added to this new base model one at a time, and the word which minimizes
the MSPE is selected. This procedure continues until the additional reduction is MSPE
is less than one percentage point. This screen selected five keywords, listed in order of
selection: Unemployment, HCG, Clearblue, Unemployment Office, and Ovulation. (See
Supplemental Information for more details.)
Additionally, two extra topical screens were utilized to explore heterogeneity between
word types as described in the article — the Early indicators screen (including the words
Clearblue, HCG, Morning Sickness, Ovulation, Pregnancy Test, Pregnancy, Pregnant), and
Unemployment screen (including the words Unemployment, Unemployment Office, and
Layoff).
4 Results
In our first step, we tested associations between 40 fertility-related keywords and monthly
births at the state level in the United States between 2004 and 2018. Our keywords are
listed in the Material and Methods section, with further descriptions and keyword selection
methodologies are found in the Supplemental Information. Our estimation methodology
utilized an Ordinary Least Squares (OLS) regression which controlled for seasonality in
both births and keyword searches, which controls for time-independent state effects and
state-specific time polynomials. We also included a set of control keywords as a proxy for
overall internet use.
We estimated the month-specific effect of each keyword on births for each month be-
6tween 1 to 12 months before the observed state-level births, and plot these results for a
subset of keywords in Figure 1. Specifically, we show the results for seven of the most pre-
dictive keywords (ClearBlue, Morning Sickness, IVF, Ovulation, Pregnancy, Ultrasound,
and Unemployment) and our control keyword set. These findings confirm that there are
intuitive associations between fertility-related keywords and future births. For example,
excess searches for ”ClearBlue” — the name of a popular brand of pregnancy test in the
US — is significantly associated with more births 5-8 months later, with the largest ef-
fect 7 and 8 months later. This is consistent with the timing when many pregnant women
are experiencing their first pregnancy symptoms at 4-8 weeks after conception. Similarly,
excess searches for ”Morning Sickness” are associated with more births 6-8 months later,
corresponding with the first trimester when morning sickness generally occurs.
For our second step, we conduct model cross-validation to show that including subsets
of pregnancy related keywords in our estimation model reliably improve the predictive
power beyond our baseline model. This is important, since simple associations between
individual keywords may be spurious, or a result of model over-fitting. We use well-
accepted statistical learning methodologies and divide our data into a training data set and
a test data set – the first of which is used to estimate the associations between keywords
and births, and the second to test the predictive power of the keywords out-of-sample. We
find that including these keywords increases forecast model precision by approximately
25% over a number of criteria. Descriptions of these cross-validation techniques and their
results are given in the Supplemental Information section.
Third, we used these estimated associations between future births and pregnancy-
related keyword searches to forecast state-level births through February 2021 using Google
search volumes up to July 2020. These results are displayed in Figure 2, in which state-
specific predictions using our model with Google searches are aggregated to the national
level, and then shown relative to the same predictions using the model without searches.
Displaying our results in terms of this relative index has the benefit of showing the pre-
dicted deviation in births between the models in percentage terms relative to what would
be otherwise expected in a comparable month. We compared four different keyword sets
against this baseline, where the selection criteria for each are fully explained in the Sup-
plemental Information. Briefly however, the Significance keyword set contains those key-
words which were both jointly significant across all monthly lags included in our model
and individually significant for at least one monthly lag; the MSPE keyword set was the
set of words which minimized the Mean Square Prediction Error (MSPE) using a forward
step-wise keyword selection criteria; the Early keyword set only included words which
were statistically significant and concerned early pregnancy keywords unrelated to health
services; an Unemployment keyword set which only contained statistically significant key-
words related to unemployment.
Each of the keyword sets — with the exception of Early pregnancy indicators — show
similarly striking results: beginning in November 2020, fertility is predicted to fall by sev-
eral percentage points each month until February 2021. For example, using the MSPE re-
7duction keyword set, we predict the number of births in February 2021 will be just 84.3%
of what they would have been for a normal February. Estimates for the Unemployment
keyword set are almost identical to those for the MSPE Reduction keyword set. The Sig-
nificance keyword set predicts a smaller — yet still very large — decline to just 88.1% of
expected births. All of these declines are highly statistically significant at the 0.1% level.
However, the Early indicators keyword set shows almost no decline at all — fertility is
predicted to be a statistically insignificant 98.8% of its normal level.
These disparate estimates can be explained by examining changes in Google search
volume for specific keywords as a result of the pandemic. In the Supplemental Informa-
tion, we show Google keyword search volume for the keywords shown in Figure 1, after
having been corrected for seasonality. Several patterns emerge in these figures. First,
whereas searches for many words fell dramatically around the first state-wide shutdown,
many fertility-related search terms have remained surprisingly stable throughout the crisis.
The words which did decline have a unifying commonality: they all relate to prenatal or
conception services which must be experienced in a clinical setting. For example, searches
related to “Obgyn”, “Ultrasound”, and “IVF” (In-vitro fertilization) all fell sharply. How-
ever, it is unlikely that searches for ultrasounds — which generally are associated in our
data with pregnancies in the late 1st and 2nd trimester — fell sharply due to significant
declines in conceptions in December and January. The abrupt decline in searches for these
words likely reflected an interruption in clinical services due to state-wide shutdowns and
social distancing behavior. Conversely, highly predictive words which do not involve pre-
natal services such as “ClearBlue”, “Morning Sickness”, “Ovulation”, and “Pregnancy”
were essentially unaffected by the coronavirus pandemic. Therefore, in spite of their pre-
dictive power, forecasts based solely on these keywords — such as our Early indicators
keyword set — imply no large negative effect of the pandemic on fertility.
However, the results are reversed for any keyword set which includes words related to
unemployment. It is well documented that fertility is sensitive to economic conditions, and
generally follows a counter-cyclical pattern[10]. As seen in Figure 1, excess searches for
unemployment around and immediately before the time of conception (8-11 months before
birth) are strongly associated with lower birthrates. This is presumably due to some cou-
ples timing their births to avoid periods of financial hardship or economic uncertainty[10].
In addition, searches for unemployment jumped to 20 times their normal level by April
– a month after the first statewide lockdown – and stabilized by the beginning of June to
approximately half this amount. The combination of large changes in search volumes for
unemployment and large coefficient values from our prediction model for this keyword im-
ply that the pandemic and its subsequent economic fallout will strongly decrease fertility,
as shown in the Unemployment, Significance, and MSPE keyword set estimates in Figure
2.
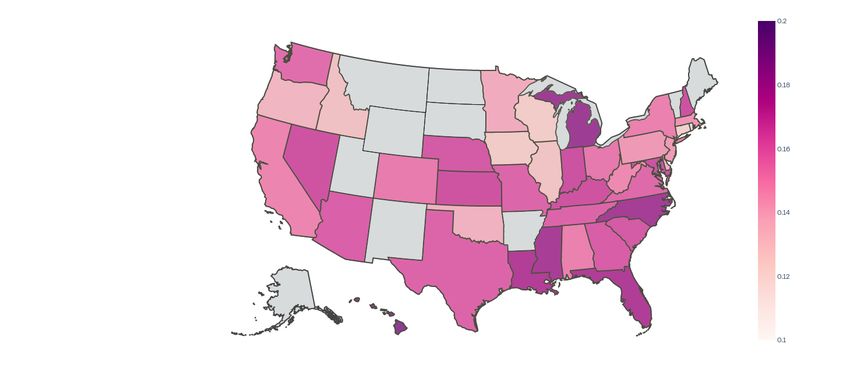
Finally, we explore whether our predicted effects vary across different states, or by
type of birth. Among the latter, we consider four sources of heterogeneity – maternal
education, age, and ethnicity, and by parity of birth. We find sizable differences across
8US states: the state with the highest predicted decline between October 2020 and February
2021 using the MSPE reduction set is Hawaii with reduction of 23.6%, while the lowest
decline is found in Connecticut of only 11.9%. As shown in the Supplemental Information,
the largest predicted declines are generally in the Southern US and the Rust Belt, with
the exception of Hawaii. In Figure 3, we only present our results based on differences
in maternal education and ethnicity – those for parity and maternal age are found in the
Supplemental Information, and demonstrate somewhat smaller declines for first births and
no differences by maternal age.
In Figure 3, we find that mothers with less of education or who identify as Black or
African American are predicted to have sharper declines in births. We do this in two ways.
First, we change the dependent variable in our prediction model from all births in a state
to only births for each educational or ethnic subgroup, and present the same relative birth
index as in Figure 2, but now broken out by subgroup. For comparison, we do this analysis
using the Significance keyword set, which predicted an average decline in fertility of 11.9%
These results are found in the top row of Figure 3. Second, in the bottom row of Figure 3
we plot the overall predicted decline, by state, between October 2020 and February 2021
— after controlling for COVID-19 cases per capita and population density — against the
fraction of the population in each state belonging to various ethnic or educational groups.
We find that for those who have completed a Bachelor’s degree or higher, the COVID-19
pandemic is predicted to have very little effect on fertility. Specifically, by Feb 2021 we
only predict a statistically insignificant 3.1% decrease in fertility for this group. However,
for both women with only some college, and those with only a high school degree, we
predict a 13% decline. Similarly, states with a higher fraction of women with at least a
Bachelor’s degree have smaller predicted fertility decline than states with lower Bachelor’s
degree attainment. By ethnic group, we find very small effects for Hispanics (2.9% decline)
relative to non-Hispanic Whites (9.2% decline) and Black or African Americans (15.3%
decline). We also find that states with larger Black or African American populations have
larger predicted declines in fertility.
5 Discussion
A 15% collapse in births over a four-month period would be unprecedented in the modern
United States. Therefore, it may be useful to explore the plausibility of this prediction. To
do so, we consider three major crises in the US with similarities to the current pandemic:
the Spanish Flu pandemic of 1918-1919, the Great Depression of 1929-1933, and the fi-
nancial crisis of 2008-2009. In doing so, it is important to keep in mind that the context
of the current pandemic is fundamentally different from each of these crises, and therefore
these comparisons should be taken with a measure of caution. However, as the coronavirus
pandemic itself is in many ways unprecedented, these three crises arguably serve as the
best comparisons at our disposal.
The first crisis we consider is the 1918–1919 H1N1 influenza A pandemic — com-
9monly known as the Spanish Flu. Birth rates fell 13% from 1918 to 1919 in the United
States, with a small rebound in 1920 and 1921[8]. This decline is strikingly similar to
that predicted for the current pandemic in this study. The fertility effects of the Great De-
pression are also very similar in magnitude to the Spanish Flu and our prediction for the
COVID-19 pandemic. Between 1929 and 1933, birthrates fell by 15.2%[31]. Finally, the
financial crisis of 2008-2009 caused a smaller decline in fertility, albeit in response to a
smaller economic crisis. From May 2008 to October 2010, births fell by 9.3% and failed
to rebound thereafter.
The evolution of births over these three crises suggests that a 15% decline in the fertility
rate in response to the COVID-19 pandemic is not unreasonable. Using the above informa-
tion on changes in unemployment and changes in births, the response of predicted births to
unemployment for the current pandemic is firmly between the response from the financial
crisis and the Great Depression. Calculating the elasticity of births to unemployment —
defined as the ratio between the percentage change in births and the percentage change in
unemployment — yields an elasticity of -0.050 for the current pandemic, firmly between
that of the financial crisis (-0.109) and the Great Depression (-0.027). Importantly, if there
is a rebound in births later in the year, the decline in fertility could be significantly less
that 15%, lowering this elasticity substantially. Therefore, the main difference between
the prediction of this study and the evolution of fertility during these three crises is not
the magnitude of the decline, but rather the speed. Since the current pandemic has led to
historically fast increases in unemployment, this suggests that similarly rapid decreases in
fertility may be expected.
Our finding that individuals identifying as Black or African American, or with lower
educational attainment, have larger predicted declines in fertility can be interpreted in two
ways. First, areas with high concentrations of African Americans have been more im-
pacted by COVID-19: incidence among Black individuals was 2.6 times higher than for
non-Hispanic whites, and mortality was 2.1 times higher[28]. Since individuals of lower
socioeconomic status are disproportionately affected by the virus, this could manifest in
higher predicted fertility declines[29]. Second, it may be that the heterogeneity in the pre-
dicted fertility effect is not caused by the differential impact of the virus itself, but rather
from the uneven economic fallout of the pandemic. Historically, during recessions employ-
ment losses are often concentrated among minority groups – and among Black individuals
in particular – and the current economic downturn is no exception. Between Feburary
and April of 2020, the unemployment rate among non-Hispanic White Americans rose
from 3.1% to 14.2%, while for Black or African Americans it rose from 5.8% to 16.7%.
While these initial increases were similar, the recovery has been much slower for Black
or African Americans: by August of 2020 non-Hispanic White unemployment had fallen
back to 7.3%, yet Black unemployment remained elevated at 13.0%. The patterns in unem-
ployment between educated and uneducated workers were even more striking, peaking at
only 8.4% for those with a Bachelor’s degree or higher, compared with 17.3% and 21.2%
for non-college graduates with and without a high school diploma respectively[32].
10There are several important caveats to this study which should be noted. First, the evi-
dence presented here can be interpreted in two ways. According to the first interpretation,
since google search volume related to pregnancy behavior and symptoms alone – and the
corresponding fertility prediction – did not change significantly over the course of the pan-
demic, there is little reason to think that there will be a large decrease in births as a result. In
this view, the effect of the large implied changes in unemployment can be ignored, because
if high unemployment searches truly implied fewer future births, we would expect fewer
searches for morning sickness, pregnancy tests, and other fertility keywords as a result.
We do not observe such reductions. However, the second interpretation concludes that be-
cause unemployment searches are strongly associated with future births, and because these
searches have spiked since the beginning of the pandemic, fertility will decline by approx-
imately 15%. Since our methodology shows that searches related to unemployment are far
more predictive than the rest of our keywords combined, an objective data science perspec-
tive would favor this interpretation. Importantly however, neither interpretation includes
the possibility of a large increase in births, notwithstanding recent speculation.
The second important caveat is that this method can only predict fertility change up to
9-12 months in the future, leaving the long-run effects of the pandemic unknown. If the
decline in fertility is simply due to a postponement in births, completed lifetime fertility
may remain relatively unchanged. However, even if these predicted declines are primarily
due to couples postponing children they still intend to have, this may still negatively af-
fect long-run fertility. Since the 1970s there has been a shift towards births at later ages
as women postpone childbearing for educational or career motives[33]. Since fecundity
declines rapidly towards the end of a woman’s childbearing years, women in their late 30s
and early 40s who further delay childbearing due to the pandemic may face unexpected
difficulties trying to conceive, leading to unintentionally lower completed lifetime fertility
[34]. If this happens, the resulting lower completed fertility and accompanying shift to an
older population age structure has significant social and economic consequences, particu-
larly for regions already well below replacement fertility. Decreasing tax revenue, greater
costs for social programs for the elderly, pension liabilities, increased health care costs,
reduced economic growth, and increased burdens of caring for the elderly are all important
policy issues surrounding falling fertility rates and the resulting aging of the population.
[33] [15] [11] [12].
11References
[1] Centers for Disease Control. Excess deaths associated with covid-19, 2020.
[2] A. Aassve, N. Cavalli, L. Mencarini, S. Plach, and M. Livi Bacci. The COVID-19
pandemic and human fertility. Science, 369(6502):370–371, July 2020.
[3] Jocelyn E. Finlay. Fertility Response To Natural Disasters: The Case Of Three High
Mortality Earthquakes. POLICY RESEARCH WORKING PAPERS, apr 2009.
[4] Richard W. Evans, Yingyao Hu, and Zhong Zhao. The fertility effect of catastrophe:
U.S. hurricane births. Journal of Population Economics, 23(1):1–36, nov 2009.
[5] Jenna Nobles, Elizabeth Frankenberg, and Duncan Thomas. The Effects of Mortality
on Fertility: Population Dynamics After a Natural Disaster. Demography, 52(1):15–
38, jan 2015.
[6] Julia Andrea Behrman and Abigail Weitzman. Effects of the 2010 Haiti Earthquake
on Women’s Reproductive Health. Studies in Family Planning, 47(1):3–17, mar
2016.
[7] Jacques Bertillon. Annuaire statistique de la ville de Paris. Imprimerie nationale,
1895.
[8] Siddharth Chandra, Julia Christensen, Svenn-Erik Mamelund, and Nigel Paneth.
Short-term birth sequelae of the 1918–1920 influenza pandemic in the United States:
state-level analysis. American Journal of Epidemiology, 187(12):2585–2595, 2018.
[9] Alberto Palloni. On the Role of Crises in Historical Perspective: An Exchange:
Comment. Population and Development Review, 14(1):145–158, 1988.
[10] Tomáš Sobotka, Vegard Skirbekk, and Dimiter Philipov. Economic recession and
fertility in the developed world, jun 2011.
[11] Quamrul H. Ashraf, David N. Weil, and Joshua Wilde. The effect of fertility reduction
on economic growth. Population and Development Review, 39(1):97–130, mar 2013.
[12] Mahesh Karra, David Canning, and Joshua Wilde. The Effect of Fertility Decline on
Economic Growth in Africa: A Macrosimulation Model. Population and Develop-
ment Review, 43:237–263, may 2017.
[13] Population Reference Bureau. 2020 world population data sheet, 2020.
[14] Nicole Maestas, Kathleen J. Mullen, and David Powell. The effect of population
aging on economic growth, the labor force and productivity. NBER Working Paper
No. 22452, 2016.
[15] John R. Beard and David E. Bloom. Towards a comprehensive public health response
to population ageing. The Lancet, 385(9968):658–661, February 2015.
[16] A.M. Jukic, D.D. Baird, C.R. Weinberg, D.R. McConnaughey, and A.J. Wilcox.
Length of human pregnancy and contributors to its natural variation. Human Re-
production (Oxford, England), 28(10):2848–2855, October 2013.
12[17] Jeremy Ginsberg, Matthew Mohebbi, Rajan Patel, Lynnette Brammer, Mark Smolin-
ski, and Larry Brilliant. Detecting influenza epidemics using search engine query
data. Nature, 457:1012–1014, 2009.
[18] Herman Anthony Carneiro and Eleftherios Mylonakis. Google trends: a web-based
tool for real-time surveillance of disease outbreaks. Clinical Infectious Diseases:
An Official Publication of the Infectious Diseases Society of America, 49(10):1557–
1564, November 2009.
[19] Abel Brodeur, Andrew E Clark, Sarah Flèche, and Nattavudh Powdthavee. COVID-
19, Lockdowns and Well-Being: Evidence from Google Trends. page 55, 2020.
[20] Boriss Siliverstovs and Daniel S. Wochner. Google Trends and reality: Do the pro-
portions match? Journal of Economic Behavior & Organization, 145(C):1–23, 2018.
[21] Tobias Preis, Helen Susannah Moat, and H. Eugene Stanley. Quantifying Trading
Behavior in Financial Markets Using Google Trends. Scientific Reports, 3(1):1684,
April 2013.
[22] Francesco Billari, Francesco D’Amuri, and Juri Marcucci. Forecasting Births Using
Google. In Proceedings of the 1st International Conference on Advanced Research
Methods and Analytics. Universitat Politècnica València, July 2016.
[23] Emilio Zagheni and Ingmar Weber. You are where you e-mail: using e-mail data to
estimate international migration rates. In WebSci ’12, 2012.
[24] Patrick M. Markey and Charlotte N. Markey. Seasonal Variation in Internet Key-
word Searches: A Proxy Assessment of Sex Mating Behaviors. Archives of Sexual
Behavior, 42(4):515–521, May 2013.
[25] Joshua Wilde, Bénédicte H. Apouey, and Toni Jung. The effect of ambient tempera-
ture shocks during conception and early pregnancy on later life outcomes. European
Economic Review, 97:87–107, August 2017.
[26] Seth Stephens-Davidowitz. Everybody Lies: Big Data, New Data, and What the
Internet Can Tell Us About Who We Really Are. Harper-Collins, 2017.
[27] J. K. Tamgno, R. M. Faye, and C. Lishou. Verbal autopsies, mobile data collection
for monitoring and warning causes of deaths. 2013 15th International Conference on
Advanced Communications Technology (ICACT), 2013.
[28] Centers for Disease Control. Covid-19 hospitalization and death by race/ethnicity,
2020.
[29] W. Holmes Finch and Maria E. Hernández Finch. Poverty and covid-19: Rates of
incidence and deaths in the united states during the first 10 weeks of the pandemic.
Frontiers in Sociology, 5:47, 2020.
[30] UNFPA - United Nations Population Fund. Impact of the COVID-19 Pandemic on
Family Planning and Ending Gender-based Violence, Female Genital Mutilation and
Child Marriage. Technical report, 2020.
13[31] Robert Heuser. Fertility tables for birth cohorts by color. Number DHEW Publication
No. (HRA)76-1152. U.S. Department of Health, Education, and Welfare.
[32] Bureau of Labor Statistics. Unemployment rate - series lns14000003, lns14000006,
lns14027662, lns14027660, and lns14027659, 2020.
[33] GBD 2017 Population and Fertility Collaborators. Population and fertility by age and
sex for 195 countries and territories, 1950–2017: a systematic analysis for the Global
Burden of Disease Study 2017. The Lancet, 392(10159):1995–2051, 2018.
[34] Emmanuel Attali and Yariv Yogev. The impact of advanced maternal age on preg-
nancy outcome. Best Practice Research Clinical Obstetrics Gynaecology, 2020.
14Figure 1: Fertility Keyword Searches and Later Births. These figures show regression co-
efficients between births in a state and Google keyword search volume for the preceding 12
months. Coefficients are elasticities, and can be interpreted as the change in births due to a
doubling of keyword search volume in a given month. Dashed lines represent 95% confidence
intervals.
Clearblue Morning Sickness
1% 2%
%Δ in Births
%Δ in Births
0% 0%
-1% -2%
Month Lag Month Lag
IVF Ovulation
2% 4%
%Δ in Births
%Δ in Births
0% 0%
-2% -4%
Month Lag Month Lag
Pregnancy Ultrasound
10% 4%
%Δ in Births
%Δ in Births
0% 0%
-10% -4%
Month Lag Month Lag
Unemployment Control Words
4% 15%
%Δ in Births
%Δ in Births
0% 0%
-4% -15%
Month Lag Month Lag
15Figure 2: Predicted 2020 US Births by Month. National predicted births, for various keyword
sets, relative to the corresponding prediction without keyword searches, and normalized to
100 in October 2020. The four keyword sets are: Significance, including keywords whose
associations meet statistical significance thresholds; MSPE, including keywords selected from a
mean-squared prediction error minimizing forward step-wise learning selection criteria; Early,
including keywords related to early pregnancy; and Unemployment, including keywords related
to economic conditions.
Relative Birth Index, Different Keywords Sets
110
Predicted Births (Oct 2020=100)
100
90
80
No Words Significance MSPE Early Unemp.
16Figure 3: Predicted Fertility Decline by Various Mother Characteristics. The top panel shows
national predicted births, by group, for the Significance keyword set, relative to the correspond-
ing prediction without keyword searches, and normalized to 100 in October 2020. The bottom
panel shows a scatter-plot relating the predicted fertility decline between Oct. 2020 and Feb.
2021 – after controlling for COVID-19 cases per capita and population density – by the fraction
of the population in the respective subgroup in that state. Data source: American Community
Survey 2013-2017, authors calculations.
Education Ethnicity
110 110
Birth Index
Birth Index
100 100
90 90
80 80
Second. or Less Some Tert. Tert. or More White (Non-Hisp.) Black Hispanic
20% 20%
Predicted Fertility Decline
Predicted Fertility
KY FL KS KS MD
NV IDMI HI HI KY MIFL VA
WV LA NE NC LA MS
Decline
MS ALTN TXNC NHWA NV
ID
IN WA VAMD CO
NEMA TXNJNY
TN AL GA
OHMO NH WV IN OH
MO SC
15% OKSCAZ CA NY NJCO 15% AZCA
GA
PA MA OR OK PA DE
OR MN CT IL
WIDEILMN
WI
IA CT
IA
10% 10%
10% 20% 30% 40% 50% 0% 10% 20% 30% 40% 50%
Bachelor's Degree or Higher Fraction Black or African-American
17Supplemental Information
Word Selection Methodology
Choosing a set of keywords with which to analyze search frequency is not straightforward
for several reasons. First, there is no a priori agreed upon set of keywords which should be
both theoretically associated with — and empirically predictive of — pregnancy. Second,
words associated with pregnancy generally have multiple meanings, which meanings can
also change over time.1 Third, different keyword sets may have different associations for
different types of pregnancy behaviors.2 Finally, the same keywords may theoretically
have different correlations with births at various pregnancy timeframes.3
The lack of a defined, agreed upon pregnancy keyword set may lead to several statis-
tical and ethical problems when determining which keywords to include. For example, an
unscrupulous researcher may datamine keywords to find those which are correlated with
pregnancy, ignore those which don’t, and present the highly predictive nature of these
keywords as evidence that Google searches are excellent at predicting births. Even con-
sciously ethical researchers may be tempted to engage in unconscious motivated reasoning
to include or exclude words once they see the results on how predictive they actually are.
Unfortunately, without a predetermined word set, part of the word selection process is
necessarily at least partially arbitrary.
Pregnancy and Birth Keywords
The first step in our word selection process was to consult a number of sources to identify
possible words. We consulted the literature on Google keywords and any aspect of fer-
tility – unfortunately, these are very scarce. The only paper we could find specifically on
pregnancy and Google searches was Billari et al (2013), which utilized three keywords –
ovulation, pregnancy, and maternity. Other papers utilized keyword sets which, while re-
lated to pregnancy, were not pregnancy specific. For example, Markey and Markey (2013)
developed a keyword set for pornographic, sexual, and mate-seeking keywords, which was
subsequently used in Wilde, Apouey, and Jung (2017) and Wilde, Lohmann, and Chen
1
For example, the term “Plan B” – a popular brand-name emergency contraceptive in the United States which
can reduce unplanned pregnancies – could also refer to generic back-up plans completely unrelated to pregnancy.
Another example is the word “Tinder” – before 2012, it referred to a type of fireword, yet after 2012 the majority
of searches referred to a online dating app.
2
For example, searches for emergency contraceptives may indicate a higher incidence of risky or unplanned
sexual behavior, which may lead to more births. However, the same searches for emergency contraceptive may be
an indication that for the same amount of risky sexual behavior, a higher proportion of those acts are accompanied
by actions to reduce unplanned pregnancy, leading to fewer pregnancies.
3
For example, searches regarding pregnancy or ovulation tests may be positively associated with pregnancy 9
to 11 months later as it suggests more individuals may be trying to get pregnant. However, a high frequency of
searches for these same tests will likely be negatively associated with births 1 to 5 months later, since if a large
fraction of women in a population are currently pregnant, there should be a lower fraction of women trying to get
pregnant.
18(2020). Additionally, Lohmann and Albarracin (2019) developed an exhaustive keyword
set for sexually transmitted infections. We then consulted online sources such as such as
pregnancy and maternity websites, dictionaries, and thesauruses. Finally, we conducted a
number of interviews with women which had experiences with different aspects of preg-
nancy, such as miscarriage, unexpected pregnancies, abortion, etc.
After this initial round, we reduced our keyword set to those 40 keywords which we
believed would be 1) specific enough to be highly correlated with births, 2) broad enough
to have enough data to run our analysis, and 3) which would sufficiently cover each of
the following seven aspects of pregnancy: Unplanned Pregnancies, Pregnancy Intentions,
Pregnancy Symptoms, Prenatal Services, Miscarriage, Economic Indicators, and Other.
Importantly, we determined this final keyword set before looking at any data. These words
and word groupings can be found in Table 1 in this supplement.
Once fixing this initial keyword set, we employed three systematic screens to allow
us to objectively choose keyword subsets for analysis without conscious or subconscious
bias in word selection. All three of these screens take a data-oriented approach. The first
screen regarded sample size – if the search frequency for a given keyword was missing
for more than 1/3 of the total state-month observations, it did not pass screen one. Of our
40 initial words, only 6 did not pass this screen: Morning After Pill, Unprotected Sex,
Baby Heartbeat, Cytotec, File Unemployment How, and Furlough. Screens two and three
were data-driven relevance screens, are referred to as the Significance and MPSE screens
in the body of the paper, and will be described in detail in the Methodology section of this
supplement. In short, a word passed screen two if it was jointly partially correlated with
births at specific time lags in our main regression specification, and passed screen 3 if it
was selected by a commonly used variable selection algorithm.
Control Keywords
Our method for determining control keywords was similar to that which determined preg-
nancy keywords, in that we began by selecting a large set of possible control words. We
combined a set of two keyword groups: commonly searched words as reported by Google,
and common – but not specific – words in the English language. Specifically, we created
an initial keyword set of the 25 most searched words reported by Google in the United
States from 2004 to the present, in addition to 40 of the most commonly used words in the
English language: the nominative and accusative personal pronouns (me, you, I, us, we,
they, she, he, it); the major interrogative pronouns and other “w”-words (who, what, where,
why, how, which, whose, whom); definite and indefinite articles (the, a, an); common con-
junctions (and, but, or); superlatives (best, worst); various conjugations of common verbs
(be, is, are, were, do, does, did, have, has, had, can, could, would, should); and “of”. Of
these 65 words, the top ten words with the highest search volumes are: the, of, how, a, is,
what, and, me, you, and do. Searches for these ten words comprise over 50% of the com-
bined search volume for the larger 65 word control set. For simplicity, we use these top
ten as our control set. In practice, our control search variable is a single aggregate search
19index for any search involving any of these 10 words, standardized in the same manner as
described below in the Google Data section.
Data
Google Data
Our data on keyword search frequency comes from Google Trends (http://trends.google.com),
a website which allows users to access data on Google keyword search frequency, stratified
by geographic regions ranging from as large as a country to as small as a city. Data for
smaller geographic areas can be more difficult to use, since the data are suppressed unless
the overall search volume reaches a minimum threshold. For this paper, we use data from
the state level in the United States to ensure a wide selection of available search terms, yet
still preserve geographic variation in search frequency.
Google Trends does not provide information on the actual number of keyword searches.
Rather, it provides a relative search index which reports aggregate searches as a percentage
of the most searched term and time period, which is given the value of 100. Therefore,
the search index may vary depending on the time frame requested, as well as the set of
keywords in a given query. In order to standardize the data, we requested the data for the
entire 15-year sample one keyword and state at a time. We then divided the keyword fre-
quency for each word by the state-specific mean, giving us a search frequency index for
each state and word with a mean value of 1. Therefore, each search frequency observation
can be interpreted as the percentage of the average search frequency for a given word in a
given state. For example, in the descriptive statistics in Table 2, the maximum search fre-
quency for the term “unemployment” is reported as 3.72. This means that for that specific
month and year in that state, searches were 3.72 times higher than the monthly state aver-
age for that word over the 15-year period. One benefit of specifying the search frequency
in this fashion is that it is easy to interpret – coefficients in our regression will represent
the effect of a doubling of search frequency from the mean on the outcome of interest.
Missing, incomplete, or relatively low frequency search data are reported as 0, which we
set to missing.
Search data in Google can be specified as either a keyword or topic, which are mea-
sured differently. For keywords, Google reports searches with an exact keyword match,
while for topic searches, Google utilizes an algorithm which attempts to include other
searches which have to do with the keyword, but may not include the actual keyword it-
self. Unfortunately, this algorithm is proprietary to Google, and therefore is somewhat of
a black box.
In Table 1, we report each of our search terms, whether we utilized the keyword or
topic search data, and whether the keyword passed a given screen. Topical searches were
prioritized over keywords when possible. In order to understand these terms, a note on the
logic behind the Google Trends search algorithm is necessary. Certain delimiters, such as
20”, -, and + allow users to change the combinations of keywords searched. A search for a
single keyword will yield the search frequency index counting all searches that contain that
keyword, including searches which contain other words. For example, the reported search
volume for keyword “pregnant” will contain searches for “am I pregnant”. If more than
one keyword is entered, the resulting Google search volume will contain only searches
which contain both words in the same search. In essence, the space delimiter serves as
the Boolean logic operator ”and”. The Boolean “or” operator is “+”. For example, the
search Emergency Contraception will contain only searches which contain both “Emer-
gency” and “Contraception”, while the search Emergency+Contraception will contain all
searches which either contain “Emergency” or “Contraception”. The “-” operator removes
searches containing a specified keyword. For example, one of our search terms mentioned
in the paper was “HCG” short for Human chorionic gonadotropin, a hormone produced
by a woman’s body for the maternal recognition of pregnancy. Testing for the presence
of this hormone in urine serves as the basis for many pregnancy tests. However, in the
early 2010s, a fad diet called “The HCG Diet” rose then fell in popularity, leading to in-
creases in searches for HCG unrelated to pregnancy. Therefore, we specified our search
query as HCG - Weight - Diet, which kept searches for HCG, but removed any search
which contained HCG but also included either the word Weight or Diet. Finally, key-
word searches in quotations require an exact string match. Returning to our example, the
search Emergency Contraception will include all searches which include both the words
“Emergency” and “Contraception”, independent of where those words appear in the query,
whereas the search “Emergency contraception” will only include searches which that exact
string. Therefore, a search for “Where do I find contraception in an emergency” would be
counted in the former search, but not the latter.
Returning to Table 1, the keywords are listed exactly how they were queried by the
system, including the ”, -, and + operators. There are two exceptions. The first is the
Control Set, which as explained in the Control Keywords section, was specified as the + of
+ how + a + is + what + and + me + you + do. The other exception is Online Dating. For
this query, we found that both the keyword and the topic yielded unbelievably low search
volume given the popularity of online dating. We concluded that a better query would be
a composite term including combined searches for popular dating sites. Therefore, for our
online dating keyword, we used the search term match.com + tinder + okcupid + bumble
+ zoosk + eHarmony + POF + plenty of fish, reflecting a combination of the seven most
popular online dating platforms used over our sample period (Note that POF is merely an
abbreviation for the site Plenty of Fish, whose url is pof.com).
Natality Data
Data on births by state and month are from the National Vital Statistics System (NVSS)
which is part of the National Center for Health Statistics (NCHS). From this system, we get
monthly birth counts for each US state and the District of Columbia. We only utilize births
in years since 2004 as this is the year Google search data begins. As of this writing, the
21You can also read