Cruise Report PIRATA Northeast Extension 2021 NOAA Ship Ronald H. Brown - RB-21-03
←
→
Page content transcription
If your browser does not render page correctly, please read the page content below
Cruise Report
                  PIRATA Northeast Extension 2021

                     NOAA Ship Ronald H. Brown
                                RB-21-03
                    January 15 – February 24, 2021
                   Miami Beach, FL – Key West, FL

Gregory Foltz, Chief Scientist
NOAA/Atlantic Oceanographic and Meteorological Laboratory
Physical Oceanography Division
Miami, FL USA
PIRATA Northeast Extension 2021 Scientific Party

Hydrography:          Gregory Foltz (NOAA/AOML), Diego Ugaz (CIMAS/AOML),
                      Briana Gibbs (Volunteer, U. Miami/RSMAS), Julian Morell
                      (Volunteer, Univ. Puerto Rico), Grace Owen (Volunteer, U.
                      Miami/RSMAS)

Moorings:             Steve Kunze (NOAA/PMEL),
                      Tara Clemente (NOAA/PMEL/CICOES)

AEROSE:               Francis Mensah, Christopher Thompson, Jordan Porter, Arianna
                      Burford (Virginia Union Univ.)

Sargassum:            Alyson Myers, Sarah Park (Fearless Fund)

Note: This report provides detailed information about the hydrographic measurements and
mooring operations carried out during the cruise. This work is in support of the PIRATA
Northeast Extension project and is part of a collaborative agreement between AOML and PMEL,
funded by NOAA’s Climate Program Office. All results reported in this document are subject to
revision after post-cruise calibrations and other quality-control procedures have been completed.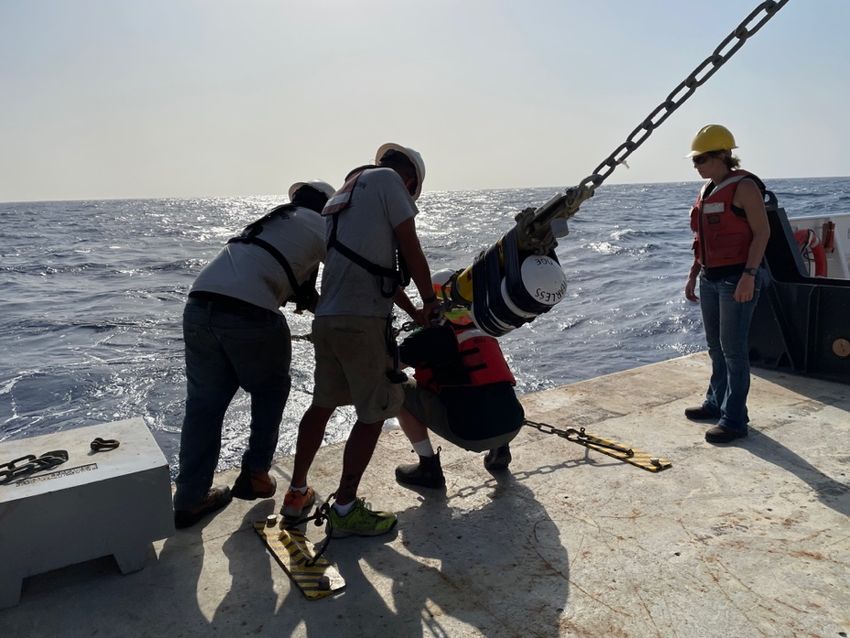
OVERVIEW

The January-February 2021 PIRATA (Prediction and Research Moored Array in the Tropical
Atlantic) Northeast Extension (PNE) cruise RB-21-03 was designed to (1) Recover and redeploy
the PIRATA Northeast Extensions’ four TFlex moorings and deploy one PIRATA backbone
mooring, (2) Collect oceanographic and meteorological observations in the northeastern tropical
Atlantic, (3) Obtain measurements of atmospheric chemistry and aerosols in support of AEROSE
(Aerosols and Ocean Science Expeditions), and (4) Collect upper-ocean water samples and
Sargassum tissue in support of a DOE (Department of Energy) funded project. The
oceanographic component of (2) includes measurements of conductivity, temperature, pressure,
oxygen concentration, and horizontal velocity from CTD casts, and horizontal velocity
measurements from the hull-mounted ADCP. The majority of the measurements were acquired
along the 23°W meridian, which samples the southeastern corner of the subtropical North
Atlantic, a region of subduction that is important for the subtropical cell circulation; the Guinea
Dome and oxygen minimum zone, where the subtropical and tropical gyres meet; and the
tropical current system and equatorial waveguide. The meteorological component of (2) focused
on measurements of air temperature, relative humidity, wind velocity, shortwave radiation,
longwave radiation, and rainfall from the ship's meteorological sensors. Most of the scientific
goals of RB-21-03 were achieved. However, we were unable to perform approximately 8 of the
planned CTD casts because of the loss of two science days due to the unanticipated need to
replace one of the ship's officers due to COVID-19 protocol.

We thank the crew and officers of the Ronald H. Brown for their work during the cruise and their
help before, during, and after the cruise. Four surface moorings were successfully recovered and
redeployed, and additional mooring was deployed, by Chief Bosun Michael Lastinger and the
deck crew using an efficient method that eliminated the need for small boat operations. Thanks
to the survey technicians, Scott and Sophia, and the Electronic Technician, Dave, for their
assistance during CTD casts. Thanks also to the rest of the crew, including the winch operators,
engineers, and galley crew, who kept operations running smoothly. Finally, we appreciate the
efforts of the Field Operations Officer and Commanding Officer to ensure efficient operations.
Introduction

1. PIRATA Northeast Extension

The Prediction and Research Moored Array in the Tropical Atlantic (PIRATA) is a three-party
project involving Brazil, France, and the United States that seeks to monitor the upper ocean and
near-surface atmosphere of the tropical Atlantic via the deployment and maintenance of an array
of moored buoys with subsurface sensors and automatic meteorological stations. The array
consists of 18 moorings, 10 of which were deployed in 1997-1998, running along the equator
and extending southward along 10ºW to 10ºS and northward along 38ºW to 15ºN. Following the
success of this initial array, additional moorings were deployed in the southwestern tropical
Atlantic in 2005 and in the northeastern tropical Atlantic in 2006-2007 (the PIRATA Northeast
Extension; Fig. 1). All of these moorings continue to be maintained as part of the sustained ocean
observing system.

The Northeast Extension samples a region of strong climate variations on intraseasonal to
decadal scales, with impacts on rainfall rates and storm strikes for the surrounding regions of
Africa and the Americas. The northeastern tropical Atlantic includes the southern edge of the
North Atlantic subtropical gyre, defined by the westward North Equatorial Current (NEC), and
the northern edge of the clockwise tropical/equatorial gyre defined by the North Equatorial
Countercurrent (NECC). This area is the location of the North Atlantic’s oxygen minimum zone,
found between depths of 400 m and 600 m. The size and intensity of this zone is a potential
integrator of long-term North Atlantic circulation changes, and the extremely low oxygen values
have significant impacts on the biota of the region. The cyclonic Guinea Dome is centered near
10ºN, 24ºW, between the NECC and NEC in the eastern tropical Atlantic. It is driven by trade
wind-induced upwelling and may play an active role in modulating air-sea fluxes in this region.

Seasonal tropical storm and hurricane forecasts are generated annually and are based primarily
on statistical analyses of historical data and the formulation of empirical predictors (e.g., ENSO
index, Atlantic SST, Sahel rainfall, etc.). Recent empirical studies have demonstrated that
tropical storm and hurricane activity in the Atlantic Ocean varies on decadal and multi-decadal
time-scales and that this variability is correlated with SST anomalies in the MDR. There is hope
that a better understanding of decadal-multidecadal SST variability in the tropical North Atlantic
will lead to improved predictions of Atlantic hurricane activity and rainfall fluctuations over
South America and Africa. There is currently great uncertainty regarding the roles of wind-
induced evaporative cooling, cloudiness- and dust-induced changes in surface radiation,
anthropogenic aerosol-induced surface cooling, and ocean mixed layer dynamics, in driving
interannual-multidecadal SST variability in the tropical North Atlantic. Measurements from the
moorings of the PIRATA Northeast Extension are valuable for conducting empirical heat budget
analyses, which diagnose the causes of SST variability and are also useful for numerical model
validation and for improving tropical weather and hurricane situational awareness for forecasters
at NOAA's National Hurricane Center.

2. Aerosols and Ocean Science Expeditions (AEROSE)

The NOAA AEROSE project attempt to achieve a comprehensive measurement-based approach
for gaining understanding of the weather and climate impacts of long-range transport of mineral
dust and smoke aerosols over the tropical Atlantic (Morris et al., 2006; Nalli et al., 2011). The
African continent is one of the world’s major source regions of mineral dust and biomass
burning smoke aerosols. These aerosols are transported over the tropical Atlantic as large-scale
outflow plumes within the prevailing easterly winds, impacting phenomena ranging from cloud-
seeding and precipitation, tropical cyclone development, net surface heat flux, tropospheric
ozone and other trace gases, ocean fertilization, air quality and ecosystems in the Caribbean and
along U.S. eastern seaboard, and NOAA infrared satellite data products. Red tides, increasing
rates of asthma, and precipitation variability in the eastern Atlantic and Caribbean have been
linked to increases in the quantity of Saharan dust transported across the Atlantic. The
contribution of the Saharan air layer (SAL) to the development of the West African Monsoon
(WAM) and its role in tropical cyclogenesis are only beginning to be understood. The interplay
between thermodynamics, microphysics, and aerosol chemistry are currently unknown.
Understanding of the mobilization, transport, and impacts of aerosols originating from natural
and anthropogenic processes in Africa on the meteorology and climate of the tropical Atlantic is
therefore a high priority. AEROSE has thus sought to address three central scientific questions
(Morris et al., 2006): (1) How do Saharan dust, biomass burning aerosol, and/or the SAL affect
atmospheric and oceanographic parameters during trans-Atlantic transport? (2) How do the
Saharan dust aerosol distributions evolve physically and chemically during transport? (3) What
are the capabilities of satellite remote sensing and numerical models for resolving and studying
the above processes?

The AEROSE project hinges on multi-year, trans- Atlantic field campaigns conducted in
collaboration with the PNE project. AEROSE is supported through collaborative efforts between
NOAA’s National Environmental Satellite Data and Information Service, Center for Satellite
Applications and Research (NESDIS/STAR) and the National Weather Service (NWS), as well
as NASA and several academic institutions linked through the NOAA Center for Atmospheric
Sciences (NCAS) at Howard University. AEROSE trans-Atlantic campaigns have acquired a set
of in situ measurements to characterize the impacts and microphysical evolution of continental
African aerosol outflows (including both Saharan dust and sub-Saharan and biomass burning)
across the Atlantic Ocean (Nalli et al., 2011). Virginia Union University has joined the cruise
since 2019, led by Dr. Francis Mensah.
3. Sargassum Science

Fearless Fund, a 501(c)3, leads a DOE ARPA-E (Advanced Research Projects Agency - Energy)
MARINER (Macroalgae Research Inspiring Novel Energy Resources) research effort in
conjunction with NOAA to produce macroalgae at energy (or carbon dioxide removal) scale. The
Fearless team includes PNNL (Pacific Northwest National Laboratory), LANL (Los Alamos
National Laboratory), the USF (University of South Florida) optical oceanography lab, Texas A
& M physical oceanographers, and marine engineers. The focus of the team is to assist
management, including sustainable harvest, of Sargassum natans and fluitans that pose
environmental and economic harm to coastal communities. The team joined the PNE cruise for
the first time in 2021 to better understand the production system of the Great Atlantic Sargassum
Belt in the tropical Atlantic, which has been established since 2011.

Figure 1 Cruise track (black line) with origin (green circle), end port (red circle), PNE moorings that were
recovered and redeployed (pink circles), PIRATA mooring that was deployed (orange circle), PIRATA mooring
that was serviced (bold black circle), CTD stations (blue circles), near-surface water samples for nutrients (green
circles), and Argo floats deployed (green a's). Black circles indicate positions of other PIRATA moorings.
Order of Operations

The COVID-19 pandemic necessitated additional safety precautions, and a comprehensive plan
was implemented to ensure the safety of all cruise participants. All personnel were required to
shelter in place for one week either in their residences in the Miami area or in hotels. This
included the R/V Ronald H. Brown (RHB) crew as well. We checked in daily to report on our
physical condition. Toward the end of this one-week period, everyone was given two COVID-19
tests (simultaneously for improved accuracy). Once underway, double-layer cloth masks were
required to be worn by everyone for an additional 20 days. The ship had to remain within 500
nm of a hospital for the first of the cruise, resulting in a more southerly course than desired (Fig.
1). Everyone onboard was tested again after that initial week, with no one testing positive.

The RHB departed Miami Beach, Florida on January 15 at 15:00 UTC and proceeded east-
southeastward toward the first mooring site. The RHB’s hull-mounted ADCP recorded data
during the transit through the Bahamas’ EEZ. On January 16, on the way to the first mooring, a
fully instrumented CTD test cast to a depth of 1500 m was performed at 25°31'N, 75°42'W, and
12 bottles were fired. Instruments included in the test cast and all subsequent casts include dual
temperature, conductivity, and oxygen, as well as upward- and downward-looking 300 kHz
ADCPs. At first, the winch wire readout meter failed, due to grease covering the sensor. After it
was fixed, the winch and all CTD equipment performed well. A summary of all CTD casts
performed during the cruise is available in Table 1 in Section 2.1 in "Oceanic data".

On the way to the first mooring site, multiple strands of Sargassum were observed on the ocean's
surface near 21°30'N, 64°W. The Sargassum team collected Sargassum tissue using pole nets.
The tissue was placed outside in sinks with running seawater. The Sargassum team also
assembled a small CARTHE (Consortium for Advanced Research on Transport of Hydrocarbon
in the Environment) surface drifter without a drogue and attached a small amount of live
Sargassum (~ 0.5 kg) to it using mesh bags. The drifter was deployed at about 21°36'N, 63°54'W
and transmitted GPS coordinates approximately once per hour. The goal of the experiment was
to allow the Sargassum to float freely while submerged in seawater for 3-4 weeks and then to
recover the drifter and Sargassum on the return transit from the 15°N, 38°W mooring to Key
West. This would serve as a "growth trial" for Sargassum in the open ocean. Unfortunately,
because the drifter was about 100 km south of the RHB's return path in mid-February, we were
unable to recover it. Six Argo floats were deployed between 64°W and the first mooring. Table 2
provides details of all 12 Argo deployments made during the cruise. Floats were provided by
Pelle Robbins and her team at Woods Hole Oceanographic Institution, with help from Zach
Barton at AOML.
The RHB arrived at the first mooring site (20°01’N, 37°53’W) around 08:30 UTC on January 25.
First a CTD/ADCP cast was conducted to 1500 m about 2-3 nm from the buoy, then the buoy
was recovered starting at about 12:00 UTC, and a new one was deployed around sunset (local
time). The PMEL team (Steve and Tara) confirmed that all surface and subsurface sensors on the
new buoy were transmitting. During the CTD cast, we noticed that the primary oxygen sensor
consistently read about 20% lower than the secondary sensor, and the bias continued to increase
during the upcast. Therefore, after the cast we replaced the primary sensor with a new one.

We were scheduled to arrive at the next mooring (20°25.7'N, 23°08.5'W) at night (approximately
21:00 local time). Instead of waiting at the mooring until sunrise, we proceeded to the CTD
station directly south of the mooring site (20°N, 23°W) and performed the cast, then traveled to
the mooring, arriving in time to perform the CTD cast before the mooring recovery. The buoy
recovery and redeployment went very smoothly, with 100% data transmission from the new
buoy. The new oxygen sensor on the CTD performed considerably better, so it was used for the
remainder of the casts.

CTD/ADCP casts were performed every 0.5° of latitude between the 20°25.7'N buoy and the
next buoy at 11°29.6'N, 23°0.5'W. Starting at 18°N (cast 007) we closed an extra bottle near the
surface (usually ~ 5 m) for the Sargassum group, who obtained water samples for subsequent
nutrient analysis. At the end of CTD cast 017 (13°N, 23°W), the SeaSave program gave several
modulo errors and would not communicate with the CTD package. All cables on the CTD were
tested as was the "fish," but the problem persisted. With the help of the electronics technician, we
re-terminated the sea cable, and the problem was solved. We were scheduled to arrive at the next
buoy (11°29.6'N, 23°0.5'W) at night, similar to the situation for the previous buoy, so we again
traveled past the buoy, performed the next CTD on the line (11°N), then went back and
performed the CTD at 11°30'N in the early morning before the buoy recovery. The buoy
recovery and re-deployment were successful, and the new buoy had 100% data return from its
sensors. During the buoy deployment, a small plastic container containing live Sargassum was
attached to the acoustic release so that it would stay near the bottom of the ocean until the buoy
is recovered during the next cruise (see Sections 1 and 3.3 in "Oceanic data").

Between 12°N and 4°N along 23°W, we traveled through an area with large strands of
Sargassum. The Sargassum team, with the help of the bosun and deck crew, attached a large
Neuston net to the end of the CTD winch wire and lowered it just below the ocean's surface. The
ship moved very slowly forward, and the net collected some Sargassum. After leaving the
collection site, we noticed a very large mat of Sargassum (estimated to be at least 50 feet in
diameter) as we traveled at ~12 kt but did not stop to sample it. We continued to perform
CTD/ADCP casts every 0.5° of latitude until the next mooring (4°0.0'N, 22°59.9'W). At the
mooring site, the CTD was conducted in the early morning before the buoy recovery began. The
buoy recovery and re-deployment went very well, and again the new buoy had 100% data return.
The buoy that was recovered included 11 Nortek current meters, 10 of which were part of an
AOML/PhOD project (Tropical Atlantic Current Observations Study, TACOS) to measure the
upper-ocean horizontal velocity and its vertical shear.

After the CTD cast at 4°N, 23°W (cast 035), we switched to a different set of oxygen chemical
dispensers. We had noticed that the old ones were sometimes leaky, and the marker to set the
amount of chemical dispensed sometimes inadvertently shifted. The new dispenser introduced
some small air bubbles at first but then performed well during the remainder of the casts, though
there was a noticeable difference in oxygen titration readings prior to and following cast 035 (see
Section 2.1 in "Oceanic data"). CTD/ADCP casts were conducted every 0.5° of latitude until
2°N, then every 0.25° of latitude until the next mooring, which is maintained by the French
(0°0.7'N, 23°0.1'W). We arrived at the equatorial mooring around sunrise. Steve, Tara, and
members of the deck crew then took the ship's small boat to the buoy and replaced the AT/RH
(air temperature, relative humidity) sensor. After the sensor swap, members of the Sargassum
team rode around the ship and the buoy in the small boat and took underwater pictures. We then
performed a CTD/LADCP cast to a depth of 3900 m (about 50-100 m from the bottom).

CTD/ADCP casts continued every 0.25° of latitude to 2°S, then every 0.5° of latitude to 4°S. We
were unable to reach 8°S as planned because we lost two days at the beginning of the cruise.
Before the 2°30'S, 23°W cast, the SeaSave program again could not communicate with the CTD
package and we could not perform the cast. We again checked all cables and plugs and tried with
the backup water sampler, but the problem persisted. We noticed that the sea cable "pigtail" plug
that connects the sea cable to the CTD's "fish" was warm and suspected that the wire termination
was the problem. During re-termination, the electronics technician discovered that the pigtail
plug was faulty, not the termination. However, the re-termination had already been performed,
and the problem went away when the new cable was hooked up to the fish.

After completing the CTD/ADCP cast at 4°S, 23°W, we headed northwest to the 15°N, 38°W
PIRATA location to deploy a new buoy. The buoy that had been deployed by the Brazilians in
November 2018 was adrift and not reporting its position. On the way to the mooring site, we
deployed three Argo floats and stopped near 4°45'N, 29°45'W to make near-surface
measurements and obtain Sargassum samples in an area with large Sargassum mats. Large
quantities of Sargassum were bagged and frozen for future analysis. The 15°N, 38°W buoy
deployment was successful, with 100% data return from its sensors. Six more Argo floats were
deployed on the transit to Key West.

The 12-hour CTD watches consisted of Greg Foltz, Briana Gibbs, and Grace Owen (12 pm – 12
am), and Diego Ugaz and Julian Morell (12 am – 12 pm). Ugaz and Owen conducted all oxygen
titration of CTD water samples. Foltz, Gibbs, and Morell performed all salinity calibration
readings in the temperature-controlled autosal room.
Throughout the cruise, the AEROSE group from Virginia Union University measured carbon
dioxide, sulfur dioxide, and ozone concentrations from a gas concentration analyzer and total
column aerosol optical depth (AOD) from a handheld sun photometer (see Section 4 in "Oceanic
data"). They also collected dust samples from the PNE buoys' meteorological sensors.
The Marine-Atmospheric Emitted Radiance Interferometer (M-AERI), an instrument maintained
by Peter Minnett and Miguel Izaguirre at RSMAS, operated during the cruise. It measured
spectra of infrared radiation emitted by the ocean surface and atmosphere and took all-sky
camera images of clouds. Standard meteorological variables and incident short-wave and long-
wave radiation were also measured as part of the M-AERI project.

Summary of oceanographic and atmospheric work performed and data collected during the
cruise:

   1. Recovery and redeployment of TFlex moorings at 20°N, 38°W; 20.5°N, 23°W; 11.5°N,
       23°W; and 4°N, 23°W.
   2. Deployment of TFlex mooring at 15°N, 38°W.
   3. Replacement of surface air temperature/relative humidity sensor on 0°, 23°W mooring.
   4. CTD/O2/ADCP profiles to 1500 m at 61 locations, including each TFlex mooring site.
   5. CTD/O2/ADCP profile to 3900 m on the equator.
   6. Salinity of the CTD bottle samples collected with Niskin bottles.
   7. Dissolved oxygen concentration of the CTD bottle samples collected with Niskin bottles.
   8. Collection of 322 water samples in the upper 300 m from CTD bottles, to be analyzed by
       AOML/OCED for phosphate and nitrate concentrations (Sargassum Group).
   9. Near-surface ocean temperature, salinity, oxygen, and pH of CTD water samples from a
       handheld instrument (Sargassum group).
   10. Sargassum tissue; underwater pictures and videos of upper ocean near Sargassum mats
       (Sargassum group).
   11. Deployment of Sargassum tissue, housed in a container, to the bottom of the ocean on the
       11°30'N mooring's acoustic release (Sargassum, mooring groups).
   12. Deployment of 12 Argo floats.
   13. Continuous recording of shipboard ADCP data.
   14. Continuous recording of Thermosalinograph (TSG) data.
   15. Heading data from the Meridian Attitude and Heading Reference System (MAHRS) and
       the Position and Orientation Systems for Marine Vessels (POS MV).
   16. Weatherpak meteorological sensors (Univ. Miami).
   17. Microwave radiometer (Univ. Miami).
   18. Marine Atmospheric Emitted Radiance Interferometer (M-AERI) (an infrared Fourier
       transform spectrometer (FTS)) to measure uplooking and downlooking spectral
radiances, marine boundary layer profiles of temperature and water vapor, and skin SST
(Univ. Miami).
19. Carbon dioxide, sulfur dioxide, and ozone concentrations from a gas concentration
analyzer (AEROSE/VUU).
20. Total column aerosol optical depth (AOD) from a handheld sun photometer
(AEROSE/VUU).
21. Dust samples from PNE buoys' meteorological sensors (AEROSE/VUU).
22. Mole fraction of carbon dioxide in air (NOAA/AOML).
23. Automated surface pCO2 (NOAA/PMEL).
Oceanic Data
1. TFlex moorings (from Steve Kunze, NOAA/PMEL)
Summary of Mooring Operations
Site Mooring ID # Operation
20N38W PT027 / PT038 Rec / Depl
20.5N23W PT028 / PT039 Rec / Depl
11.5N23W PT030/ PT040 Rec / Depl
4N23W PT034 / PT041 Rec / Depl
0 23W PT037 Repair
15N38W PT042 DeplLost or Damaged Instruments and Equipment (from rec moorings)
Site Mooring ID Sensor type Serial No Comments
20N38W PT027 SBE37-IMP 12546 Shield and case screws missing.
Fishing damage to clamp and head.
20.5N23W PT028 Aquadopp 13668
Flooded.
Body missing. End parts all that
20.5N23W PT028 SBE37-IMP 12547
remained.
11.5N23W PT030 Rain 1808 Funnel missing
4N23W PT034 Aquadopp 12021 Flooded
On-deck instrument or hardware failure (pre-deployment)
Sensor type Serial No Comments
Nortek Aquadopp 14870 Missing mount for fin
LWR 33347 Okay then no output
Lost inductive comms when buoy was assembled.
SBE39-TP-IM 8591
USB comms okay.
Seemed to be causing persistent radiation sensor
SWR/LWR dual cable n/a problems with two systems that were testing for
15N38W
Acoustic Releases
All Acoustic Releases Performed WellFishing and Vandalism
Site Mooring ID Comments
Traces of small diameter longline entangled in bridle. SST/C
20N38W PT027
pigtail was severed.
Traces of small diameter longline entangled in bridle. SST/C
20.5N23W PT028 pigtail was severed. 11.6m, 20m sensors resting on 40m sensor
and long line tangled on them.
Lots of fishing line in many places from 31.6m down to below
4N23W PT034 500m. Line fouling also noted at connection between 1st and 2nd
spools of nylon.
Repair operation for failed AT/RH. Sensor had been hit and was
bent inwards an up. Found foreign light mounted to Gill mast
0 23W PT037A
and heavy hawsers tied to tower along with parachute cord.
Removed. Line fouling on bridle as well.
Shipping notes:
Two step bed trucks were loaded for transport to Miami. Some of the equipment that had earlier
been shipped in anticipation of the original cruise dates of May 12th through June 11, 2020 (Cape
Verde-Barbados) was stored in Norfolk. The Ronald H. Brown loaded that equipment onboard
prior to its arrival in Miami. Due to the shelter in place restrictions and the timing of the loading,
our Chief Scientist, and Miami resident Dr. Foltz, agreed to supervise the offloading of the
PMEL trucks onto the vessel on January 4th. All equipment sent was present and accounted for.
Offloading was scheduled to take place on the morning of arrival in Key West on February 24th.
One 48’ step bed truck was delivered on time for the evolution and was loaded without problem.
The entire inventory was shipped home on this surface shipment.
Noteworthy Operational Details:
20N38W
PT027 Recovery: The 20m TC failed on deployment and the site had been flagged for high
conductivities at 10m and 40m. The Aquadopp battery pack was reported low and had been
disabled from the inductive loop remotely. A few resets were also noted in the deployment
record.The 20m SBE-37IM TC was still not reporting on recovery. It was found with a missing shield and case screws. The number of samples in the instrument indicated that it recorded for about 7.5 days which correlates to about the amount of time that the sensor was started onboard until the observed failure on deployment. Date and time were lost too. The 10m and 40m conductivity cells were barnacle fouled. The Aquadopp data was successfully recovered. The instrument logged data up until 9/17/2020. The SSTC pigtail had been severed. The SSTC would not communicate for data uploading until the battery pack was replaced. The time and date were intact and the number of records looked reasonable as compared to the TC IM sensors. There was significant wear on the top section at the top of the lead weight pocket due to the less than desirable routing to the nilspin socket. The top section fit problem was a persistent issue on the previous cruise. PT038 Deployment: The top section routed ideally to the nilspin socket however the SSTC pigtail was exiting the tygon directly over the bridle leg. We were able to twist the tygon enough at that location to place it in a more satisfactory position. During final setup prior to deployment the Aquadopp #14870 was found not to have a mount for the fin (vane) on it. To remedy this quickly we used the scheduled sensor for the 4N23W buoy, #13665, which had the same IM address and had been testing successfully on deck. #14870 was packed up for shipment back to Seattle. Since this was a quick swap out, the replacement was not internally updated with new header information and will show on recovery that it was deployed at 4N23W. Comments in the deployment log state this as well. 20.5N23W PT028 Recovery: This mooring had many resets. The SSTC, 11.6m, 20m, and 500m sensors were flagged as failed. Density inversion noted at 10m and 40m conductivity had spiked. Aquadopp was remotely disabled as were O2 sensors. As was the case for the previous recovery the SSTC pigtail had been severed. The SSTC would not communicate for data uploading until the battery pack was replaced. The time and date were intact and the number of records looked to be around 72% of the other TC’s recovered.
The 11.6m Aquadopp had been pulled down the nilspin wire taking the 20m TC with it coming
to rest on the 40m TC sensor. The Aquadopp had severe head wear and the clamp, although tight
had lost its grip and was free sliding. The Aquadopp would not respond for the data upload and
was found to be flooded after further examination. The battery packs were unplugged. The 20m
TC body was missing with only the end pieces still on the nilspin.

The 500m TP had low battery voltages and was only somewhat responsive to the IM comms.
Observed junk text on the terminal when it was given the STOP command and there were no
comms for the DS command using Seaterm V1.59. The status displayed on Seaterm V2 (used for
the data uploading) was copied as a text file, with actual GMT time appended to it, in lieu of the
V1.59 CAP file for the clock error, record count, and battery voltages. The status information
included a low battery alert and that it had received the STOP command. Date and time were
intact. The data upload performed successfully without replacing the batteries. The ascii file
created from the upload showed an end date of 8/31/19.

The 10m and 40m TCs were both heavily fouled with barnacles.

There was top section wear into the flexane in the tygon at the top of the lead weight pocket for
reasons previously stated.

PT039 Deployment: The top section had to be twisted but was routed ideally to the nilspin
socket. This in turn also helped place the SSTC pigtail in a more appropriate position.

The subsurface addressing omits addresses formerly used for the real-time O2 sensors. The O2
sensor inductive modems had been disabled prior to shipment for stand-alone (no real-time)
operation.

11.5N23W

PT030 Recovery: This mooring also had several system resets. The Aquadopp had been
disabled remotely, C10 was low on deployment and there were real-time O2 sensor issues. No
physical observations for these kinds of problems were possible. TFLEX tube 0061 had been
noted on deployment for a failure to establish RF comms on flyby despite good communication
before and during deployment. It was labeled appropriately when packed up for return to Seattle.

The rain gauge was missing its funnel.
The Aquadopp had slid down and was resting on the 20m sensor. The dummy plug had pulled
out of the connector but was still lodged in the sleeve. Time and date were lost. There was about
7.2mb of data uploaded with 10 read retries and 1 CRC error. Data recorded until 5/22/2020.

The SSTC pigtail had been severed. After investigating this persistent problem with the
recoveries, it was determined that the top section routing behind the lead weight pocket had
likely contributed to this.

The serial numbers of the 299.5m and 499.5m O2 sensors could not be verified due to label
fading on one and a missing label on the other.

The 100m SBE39IM sensor batteries were low and a clock check could not be performed
inductively. When the USB connection was made for the data upload, the status was displayed
on the Seaterm Version 2 interface. This was copied to a text file for the clock error, record
count, and battery voltages. Actual GMT time was appended to it.

PT040 Deployment: The 20N38W mooring hardware was turned around for this deployment
and a new yoke was installed to replace the old one that was severely worn.

The subsurface addressing omits addresses formerly used for the real-time O2 sensors. The O2
sensor inductive modems had been disabled prior to shipment for stand-alone (no real-time)
operation.

During deck testing, long wave radiation sensor #33347, failed. Case and dome temps were okay
but the primary output was very low and there was no observed standard deviation. It was
swapped out with spare #32768.

4N23W

PT034 Recovery: This mooring was augmented with ten AOML Aquadopp current meters in
addition to the PMEL current meter at 11.6m in support of the Tropical Atlantic Current
Observations Study (TACOS) project headed by Dr. Renellys C. Perez (NOAA, AOML). These
were mounted at intervals from 6.6m to 86.6m. The mooring had been deployed from the
UNOLS R/V Thomas G Thompson in May 2019 after the previous cruise, PI2-19-RB, had to
abandon the scheduled recovery and deployment a few months prior to this due to an emergency
medevac of a crew member.
The 86.6m Aquadopp had failed upon deployment, the AT/RH had been flagged months later as
both parameters were occasionally reading zero. There were several system resets documented.
Over time, the TFLEX system was sent the DS command for each of the Aquadopps to disable
communications with the instruments due to a combination of loss of inductive communications
with TFLEX and low instrument voltages resulting from the extended service period.

There was no physical evidence of failure found with the AT/RH sensor.

The 86.6m Aquadopp was found to be completely flooded. For the others, data collection end
dates correspond with documented problems and disabling (DS) actions taken while deployed.
Clock errors that could be attributed to low voltages were extreme in some of the instruments but
this did not appear to impact prior stored data. Minor clock drift should be expected in these data
though unverifiable. The frequency and timing of the 10 minute sampling interval, as observed
after data conversion, was becoming intermittent prior to the end of data collection in the
instruments. The following table summarizes the date ranges of the data collected.

                  Serial Number Depth Start of Data End of Data File Size

                      12042        6.6m     5/18/2019      1/19/2020     3892 KB

                      14242       11.6m     5/19/2019     10/22/2020     8228 KB

                       9843       16.6m     5/19/2019      10/8/2020     8023 KB

                      12059       21.6m     5/18/2019      4/3/2020      5090 KB

                      12029       26.6m     5/18/2019      10/5/2020     8005 KB

                      12039       31.6m     5/18/2019      9/30/2020     7890 KB

                      12036       36.6m     5/18/2019      7/15/2020     6700 KB

                      15001       46.6m     5/18/2019     11/18/2020     8695 KB

                      12056       56.6m     5/18/2019      10/9/2020     8047 KB

                      12058       66.6m     5/19/2019     10/20/2020     8149 KB

There was also an issue discovered with the length of the cut piece of nylon which was
documented as CUT (Z411) in the PT034 deployment log. Its stated length was 295m and it was
later discovered during the subsequent deployment of PT041 that it was substantially shorter
than that when it began to pay out. An estimate, a very rough estimate, was that it was maybe
100m long and covered about three full side to side wraps on the spool cylinder. Assuming 100m, that would have put the scope of PT034 at about 0.939. Fortunately, the mooring did not seem to be affected by this during its lifespan. It can be considered a testament to the range of scope that the moorings can tolerate. At least in this case. The watch circle was a little smaller than usual and the anchor did not drag. PT041 Deployment: The aforementioned PT034 had been deployed a few miles south of this location. The cut (Z411) nylon section had been shortened by ten meters for an assumed 285m length prior to redeployment. While the amount of line on the spool looked suspicious it shortly became quite obvious when the line started to pay out. It was hauled back in and replaced with a new cut piece at 285m. The old cut Z411 was labeled should the actual length be deemed necessary to verify after return to Seattle. The O2 sensor inductive modems had been disabled prior to shipment for stand-alone (no real- time) operation. Spare Aquadopp #13645 was used on this deployment as the intended sensor had been used for deployment at 20N38W. During initial buoy assembly deck testing, the 300m SBE39-TP-IM, #8591, suddenly stopped inductive modem comms and was replaced with spare #9092. Further checks found that the failed instrument still had comms via the USB connection. 0 23W PT037 Repair: Priority was given to conduct a repair of the failed AT/RH sensor. The FRB (fast rescue boat -formerly known as the RHIB) was launched for the repair. Tara Clemente and Steve Kunze boarded the buoy and replaced the sensor then reset the TFLEX system while the Chief Scientist confirmed via the mooring’s RF communications that the repair was a success. There was heavy hawser line and parachute cord tied to the tower which was cut away. A foreign light had been mounted to the Gill wind mast which was also removed. Line fouling of the bridle was plainly evident too. The failed AT/RH sensor had been struck and the multi-plate radiation shield that it was installed into was found bent up and inward. The foam sensor filter had become dislodged and both sensors were exposed and heavily corroded. After the system was reset it was also noted that the SSTC, 20m C, and Aquadopp temperature (high) were bad.
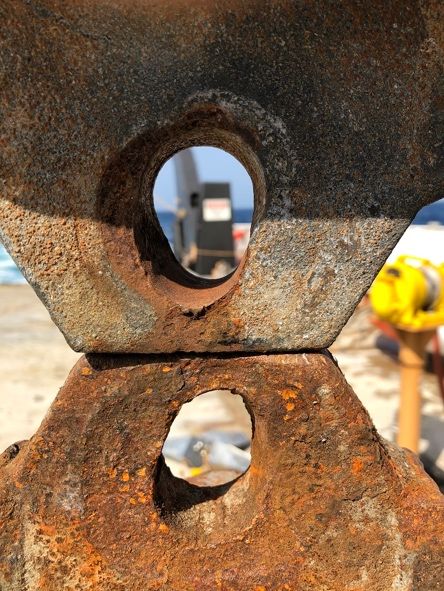
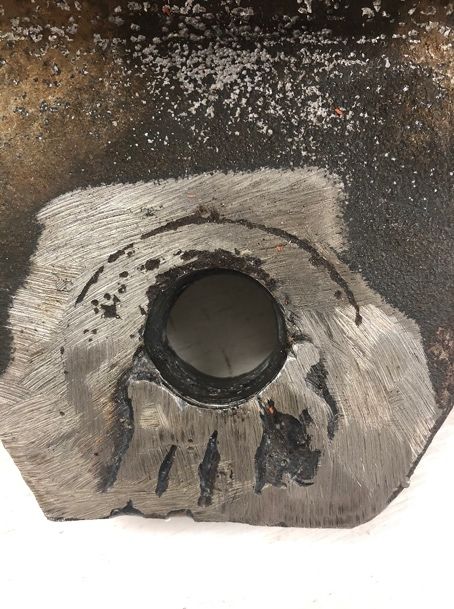
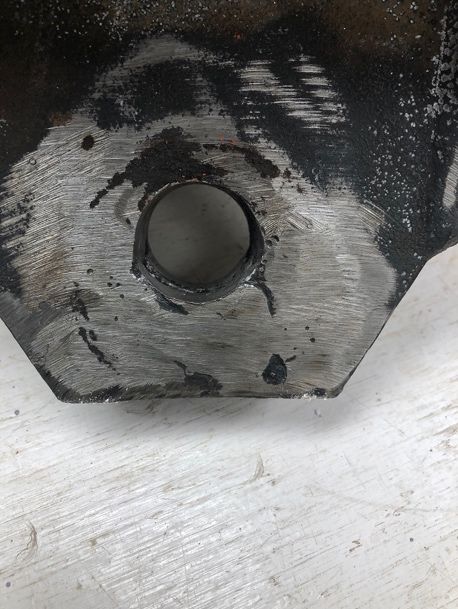
15N38W

PT025 Recovery: This mooring was deemed lost at sea prior to arrival. The only thing to note is
that a Filemaker recovery log was completed for the historical record with the “Was this
Mooring Lost at Sea?” box checked.

PT042 Deployment: The previous mooring at this location had parted from the anchor and
drifted away then subsequently stopped transmitting. This site is normally serviced by our
Brazilian PIRATA partners. Priority was given to deploy a new mooring at the site before the
cruise shipment left Seattle and adjustments were made to the manifest to Miami. The inventory
was updated with the necessary items and the cruise track line was modified for this work to take
place.

During deck testing both of the radiation sensors eventually failed. After some troubleshooting
and communications with the lab it was decided to replace the primary TFLEX logger, #0004,
with spare #0066. When the system was moved into the buoy for further testing the short wave
radiation sensor failed. After much sensor and cable swapping we ended up using the original
sensor with a new main SWR/LWR dual cable. Looking back on this, the original TFLEX logger
#0004 may be okay and the SWR/LWR dual cable connecting the logger to the sensor pigtails
very well could have been the culprit all along. It was labeled as suspect when packed up for
return to Seattle.

A short 3.2nm multibeam survey was conducted on location to augment existing bathymetry, the
latter of which discounted depth corrections of close to 70 meters. A suitable location was
identified and the new mooring was deployed successfully. Data from the multi-beam pass was
processed and a 10m line contoured, corrected bathymetric map, along with the data acquired of
the new survey was presented to us for future use.

The bridle yoke from the recovered mooring at 4N23W was determined to be marginal for
redeployment due to excessive wear and was sent to the machine shop to refill the elongated
shackle pin hole as well as touching up the lateral wear. The pictures below show the results of
this. Note the markings of the old shackle washer position for an idea of the extent of the wear
before refurbishing.
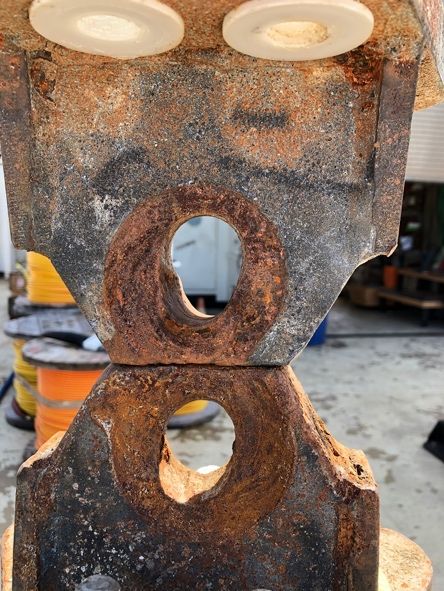
Figure 2 Refurbished (left) and old (right) bridle yoke.

Instrumentation and Hardware Notes:

During the cruise it became apparent that the bridle yokes (or clevis, pad eye) were not holding
up well after the extended deployments. The yokes recovered from 20N38W and 20.5N23W
were both so worn that they were unsuited for re-use. These were likely not new when they were
deployed as bridle yokes are regularly reused until they wear out and typically last for more than
two years. Two new buoy hardware sets were shipped for this cruise and the first two sites were
deployed with new yokes. The recovered 11.5N23W yoke was okay and re-used at 4N23W. The
spare yoke (new) was used for the 11.5N23W deployment. The recovered 4N23W yoke was in
the best shape of the three on hand and was backfilled for re-use, as stated above, and deployed
at 15N38W. See photos of the yokes recovered from 20N38W and 20.5N23W below. The 5 ton
and 3 ton swivels also exhibited symptoms of long deployments with some that were seized
and/or had rough bearing motion.
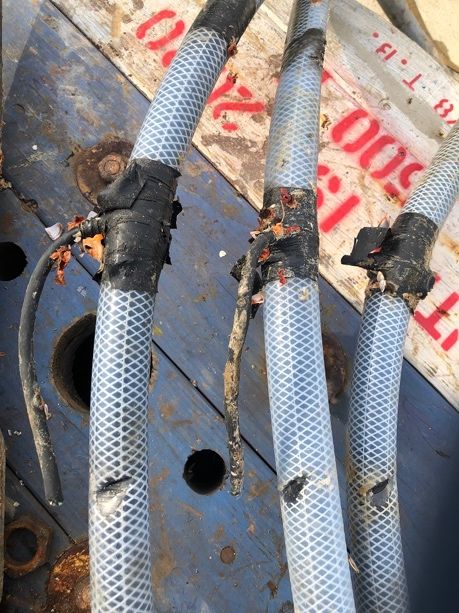
Figure 3 Wear on mooring bridle yokes.

TFLEX Top Sections:

As previously stated in the Noteworthy Operational Details section, the recovered top section
cables suffered wear and severed SSTC pigtails resulting from the way the cables had to be
routed in order to fit into the nilspin socket. The top sections provided for this cruise did not
require this routing and fit okay with some twisting required. The photo below illustrates the
wear discovered from the 20N38W, 20.5N23W, and 11.5N23W recoveries. The top section fit
issue was relayed to GTMBA management as well as EDD during the cruise and actions are in
motion to address it.

Figure 4 Wear on top-section mooring cables.
Aquadopp cable clamps:

It was found that in cases where the Aquadopps had slid down the nilspin, the grip of the clamp
was compromised. Therefore, it should be ensured that all of these instruments have their clamps
verified as good before they are sent back out to sea again to avoid nilspin mounting problems
during deployment. This happened to #13668 from 20.5N23W and #12364 from 11.5N23W. It
should be noted that there was no line fouling on the latter.

Ship Notes or issues:

The deck department, under the leadership of Chief Bosun Mike Lastinger, continues to exhibit a
high level of professionalism. Safety meetings are conducted prior to every mooring evolution
and everyone understands their roles. The members of the department are courteous, safety
conscious, look out for one another, and are fun to work with.

Moorings continue to be recovered by snagging the teacup handle with the “happy hooker” line
passing tool. In lieu of bringing the buoys down along the starboard side until they can be
reached, the Command utilized dynamic positioning to approach the buoys at a perpendicular
angle. This worked well. No instruments were damaged on recoveries but the ship struggled to
keep the buoys away from the hull after they were connected. This has always been somewhat of
an issue on past cruises no matter the approach. Deployments still are commenced by placing the
buoys off of the port side using a portable crane. The ship handling and teamwork on deck
during this critical part of the deployment was superb. A hanging block was then used for
mounting instruments and the anchors were slid off the fantail.

The survey department, for the first time in my many years of cruises on the Ronald H. Brown,
processed and produced a hard copy of contoured bathymetry at a mooring site. A 3.2nm long
multibeam pass was conducted at the Brazilian PIRATA 15N38W site utilizing depth correction
for speed of sound to augment existing bathymetry on file which did not account for an
approximately 70m depth correction as per the echo sounding correction tables. Hydrographic
Survey Technician Sophia Tigges possessed the necessary skill set for this endeavor and
volunteered to do this. It is not required as part of the cruise instructions but much appreciated.
She produced a map with our requested 10m contour lines to aid the project, primarily our
Brazilian PIRATA partners, in deciding on desirable mooring anchor locations. Having this done
in near real time is a bonus. The resulting output files from this survey were also presented to our
team for additional post processing at PMEL as needed.

Both of the hull mounted 12khz transducers that have been utilized by our group on past cruises
were inoperable. They have been primarily used by our project for the interrogation of the
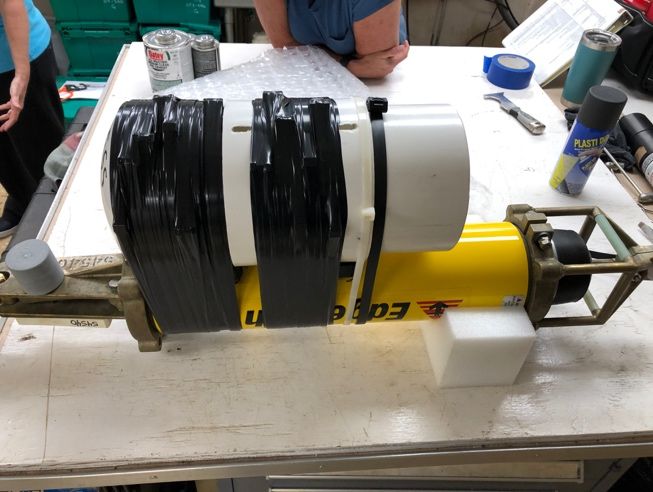
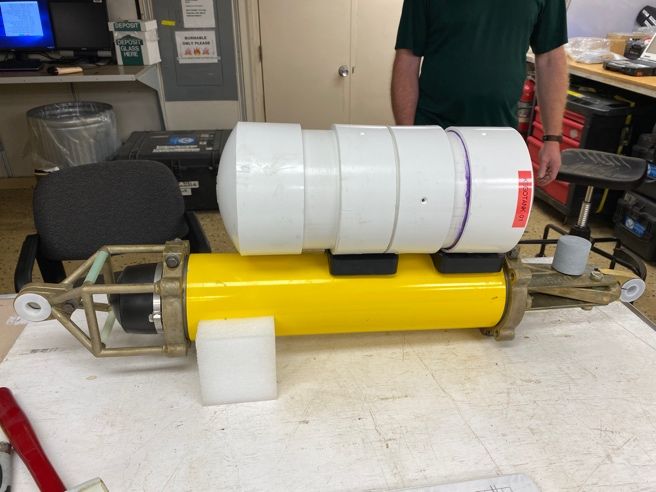
acoustic releases on our moorings and allow for convenient and efficient communications to take
place in the computer room versus out on deck.

Additional internet bandwidth had been purchased for this cruise and the speed was not
problematic however the connection was spotty for much of the cruise. Nonetheless, it remains a
useful tool in completing our mission, communicating with our shoreside teams, and contributing
to the overall moral onboard. There are strict guidelines to follow so as not to impede
performance that may result from individuals consuming too much of the bandwidth, so there are
certain limitations to its use.

The Rigid Hull Inflatable Boat (RHIB) has been re-designated as the Fast Rescue Boat (FRB).
As the name implies, our days of using this boat for mooring work may be coming to an end as
the priority has shifted regarding its use. The ship has acquired a separate work boat for science
work but it was not available for this cruise.

Ancillary Projects:

As described earlier in the report, the Sargassum team placed live Sargassum in a container and
sank it to the deep ocean on a PNE mooring's acoustic release. The pictures below illustrate the
way that this package was mounted to the release. The solid rubber saddles had to be rough cut
onboard as they weren’t prepared ahead of the cruise. The Chief Bosun, Mike Lastinger, did as
well as was possible with the tools he had onboard to customize the rubber blocks. It was not a
simple matter and they were less than ideal but as good as could be expected considering the
circumstances. To fill in the gaps somewhat we used Flex-Seal on the bottom and top of these
“saddles” and mounted the assembly using copious amounts of tie wraps and electrical tape
while the Flex-Seal cured. To seal the sargassum into the vessel we used purple PVC primer and
PVC cement in the cap. Once the cap was in place, more tie wraps and electrical tape were used
to secure the top to the release. The assembly was set low on the release to allow for the
installation of the cap.
Figure 5 Sargassum container (white) attached to the acoustic release (yellow) before (left) and after (right)
securing with tie wraps and electrical tape.

Figure 6 Sargassum container and acoustic release prior to deployment.
2. Conductivity-Temperature-Depth (CTD) and Acoustic Doppler Current Profiler
(ADCP) casts

2.1 CTD casts

AOML’s CTD package was configured with 18 Niskin bottles: 12 bottles to be fired at various
depths during the casts (to collect water samples for salinity and dissolved oxygen calibration)
and six spare bottles. The sensors on the CTD frame consisted of primary and secondary
temperature, conductivity, and oxygen (six total) and upward- and downward-looking 300 kHz
ADCPs.

A total of 61 CTD/ADCP casts, including one instrumented test cast, was conducted by Greg
Foltz, Diego Ugaz, Briana Gibbs, Grace Owen, and Julian Morell, with assistance from the
Survey Technicians (Table 3). CTD processing was performed using Seabird software. After
acclimating in the autosal room for at least two days, salinity samples were calibrated using an
autosal provided by AOML. Oxygen titration was performed by Diego Ugaz and Grace Owen in
order to calibrate dissolved oxygen concentration obtained from the CTD sensors.

Table 1 Date (UTC), start time (UTC), end time (UTC), latitude, and longitude of CTD casts.

CTD #            Date              Start    End      Latitude          Longitude         Description

0                Jan 16            20:30 21:45 23°30.5'N               75°41.7'W         test cast (1500 m)

1                Jan 25            08:30 09:45 20°00.9'N               37°53.1'W         at mooring (1500 m)

2                Jan 29            06:00 07:15 20°25.7’N               23°08.5’W         at mooring (1500 m)

3                Jan 28            23:45 01:00 20°00.0’N               23°00.2’W         (1500 m)

4                Jan 30            01:00 02:15 19°29.9’N               23°00.0’W         (1500 m)

5                Jan 30            05:30 06:45 19°00.0’N               23°00.2’W         (1500 m)

6                Jan 30            10:00 11:15 18°30.0’N               22°59.7’W         (1500 m)

7                Jan 30            14:15 15:30 18°00.0’N               22°59.9’W         (1500 m)

8                Jan 30            18:15 19:30 17°30.3’N               22°59.9’W         (1500 m)

9                Jan 30            22:15 23:30 17°00.0’N               22°49.0’W         (1500 m)

10               Jan 31            02:15 03:30 16°30.0’N               22°44.0’W         (1500 m)

11               Jan 31            06:30 07:45 15°59.7’N               22°35.3’W         (1500 m)
12   Jan 31   10:00 11:15 15°30.1’N   22°44.3’W   (1500 m)

13   Jan 31   14:30 15:45 14°59.9’N   22°52.0’W   (1500 m)

14   Jan 31   18:30 19:45 14°30.0’N   23°00.1’W   (1500 m)

15   Jan 31   22:30 23:45 13°59.8’N   23°00.0’W   (1500 m)

16   Jan 31   02:30 02:45 13°30.0’N   23°00.0’W   (1500 m)

17   Feb 01   12:15 13:30 13°01.4’N   22°59.7’W   (1500 m)

18   Feb 01   16:15 17:30 12°30.0’N   23°00.0’W   (1500 m)

19   Feb 01   20:30 21:45 12°00.1’N   23°00.0’W   (1500 m)

20   Feb 02   07:00 08:15 11°29.6’N   23°00.5’W   at mooring (1500 m)

21   Feb 02   02:45 04:00 11°00.1’N   23°00.1’W   (1500 m)

22   Feb 02   23:00 00:15 10°29.9’N   23°00.0’W   (1500 m)

23   Feb 03   04:00 05:15 10°00.7’N   22°59.9’W   (1500 m)

24   Feb 03   08:00 09:15 09°30.1’N   23°00.1’W   (1500 m)

25   Feb 03   12:00 13:15 09°00.1’N   22°59.9’W   (1500 m)

26   Feb 03   16:15 17:30 08°29.9’N   23°00.0’W   (1500 m)

27   Feb 03   20:15 21:30 07°59.0’N   23°00.0’W   (1500 m)

28   Feb 04   00:15 01:30 07°29.7’N   23°00.1’W   (1500 m)

29   Feb 04   04:30 05:45 07°00.0’N   23°00.0’W   (1500 m)

30   Feb 04   08:30 09:45 06°30.1’N   22°59.9’W   (1500 m)

31   Feb 04   12:45 14:00 06°00.1’N   23°00.0’W   (1500 m)

32   Feb 04   16:45 18:00 05°30.0’N   23°00.0’W   (1500 m)

33   Feb 04   20:45 22:00 04°59.9’N   23°00.1’W   (1500 m)

34   Feb 05   00:45 02:00 04°30.1’N   22°59.9’W   (1500 m)

35   Feb 05   04:30 05:45 04°00.0’N   22°59.9’W   at mooring (1500 m)

36   Feb 05   22:15 23:45 03°30.1’N   23°00.0’W   (1500 m)

37   Feb 06   02:30 03:45 03°00.0’N   22°59.9’W   (1500 m)
38   Feb 06   06:30 07:45 02°30.3’N   23°00.0’W   (1500 m)

39   Feb 06   10:30 11:45 02°00.0’N   23°00.2’W   (1500 m)

40   Feb 06   13:30 14:45 01°45.0’N   23°00.1’W   (1500 m)

41   Feb 06   16:15 17:30 01°30.1’N   22°59.9’W   (1500 m)

42   Feb 06   19:00 20:15 01°15.0’N   23°00.1’W   (1500 m)

43   Feb 06   22:00 23:15 01°00.1’N   23°00.0’W   (1500 m)

44   Feb 07   00:30 01:45 00°45.1’N   23°00.3’W   (1500 m)

45   Feb 07   03:30 04:45 00°30.1’N   23°00.1’W   (1500 m)

46   Feb 07   06:30 07:45 00°14.9’N   22°59.9’W   (1500 m)

47   Feb 07   12:00 15:15 00°00.7’N   23°00.1’W   at mooring (3900 m)

48   Feb 07   17:30 18:45 00°14.8’S   23°00.0’W   (1500 m)

49   Feb 07   20:30 21:45 00°29.9’S   23°00.1’W   (1500 m)

50   Feb 07   23:15 00:30 00°44.8’S   23°00.0’W   (1500 m)

51   Feb 08   02:15 03:30 01°00.1’S   23°00.1’W   (1500 m)

52   Feb 08   05:15 06:30 01°14.9’S   23°00.0’W   (1500 m)

53   Feb 08   08:15 09:30 01°30.0’S   23°00.0’W   (1500 m)

54   Feb 08   11:15 12:30 01°45.0’S   23°00.1’W   (1500 m)

55   Feb 08   14:00 15:15 02°00.0’S   23°00.1’W   (1500 m)

56   Feb 08   22:30 23:45 02°30.0’S   23°00.0’W   (1500 m)

57   Feb 09   02:45 04:00 03°00.0’S   23°00.0’W   (1500 m)

58   Feb 09   07:00 08:15 03°30.1’S   23°00.1’W   (1500 m)

59   Feb 09   11:15 12:30 04°00.0’S   23°00.0’W   (1500 m)

60   Feb 14   19:45 21:00 15°00.9’N   37°59.3’W   at mooring (1500 m)
The latitude-depth section of temperature from the CTD casts shows the warmest sea surface
temperatures (SSTs) concentrated in the 0°-7°N latitude band of the intertropical convergence
zone (ITCZ) (Fig. 7a). SSTs in the ITCZ region exceed 27°C and drop to 22°C-26°C to the north
and south. A sharp seasonal thermocline is present at the base of the mixed layer at all locations,
with the temperature decreasing approximately 10°C over a distance of 10-20 m. The meridional
slopes of the isotherms are consistent with the dominant zonal currents in the eastern tropical
Atlantic: the westward North Equatorial Current (NEC) between 10°N-20°N, the eastward North
Equatorial Countercurrent (NECC) between 3°N-10°N, and the westward South Equatorial
Current between 1°S-3°S.

    Figure 7 Latitude-depth sections of (a) temperature, (b) salinity, and (c) oxygen acquired along 23°W during the cruise.

The salinity section shows the low-salinity core of the Antarctic Intermediate Water between 400
and 1200 dbar, freshest at 4°S and becoming saltier to the north (Fig. 7b). High-salinity
subtropical water (>36.5 PSS) is apparent at depths of 0-100 m between 18°N and 20°N and to a
lesser extent between 40-70 m near 3°-5°N and just south of the equator. The 18°-20°N high- salinity water mass can be traced in part to the subtropical North Atlantic, where an excess of surface evaporation over precipitation leads to the highest surface salinity in the global ocean. The subtropical salinity maximum water subducts and travels poleward in the eastern tropical North Atlantic. In the subtropical South Atlantic, high-salinity water subducts and travels northward to the equator, where it is carried eastward in the Equatorial Undercurrent. The high- salinity features visible at 20°N and near the equator in the latitude-depth section are consequences of the subduction of subtropical salinity maximum water in the North and South Atlantic, respectively. Much lower values of salinity (34.5-35.5) in the upper 40 m between the equator and 7°N result from an excess of precipitation over evaporation in the ITCZ. The dissolved oxygen section along 23°W shows high concentrations (> 4 ml l-1) in the surface mixed layer and below 1200 dbar (Fig. 7c). There is a pronounced oxygen minimum zone centered at a depth of about 300-500 m between 5°N-20°N. This water is in the stagnant shadow zone of the North Atlantic, which is not part of the circulation associated with the ventilated thermocline of the subtropical gyre. Salinity calibration values from the CTD bottle samples are available for each cast. The autosal performed well and the room temperature remained fairly stable, within about one degree of 24°C. The offset between each CTD bottle value and the associated autosal calibration value is shown in Fig. 8a. The error for the calibrated salinity is 0.0047 psu, which is higher than the WOCE standard of 0.002 psu. Before correcting the CTD sensor values based on the calibration readings, the calibration readings were corrected for any spurious trends identified during each autosal run, using the Matlab code provided by Jay Hooper. Oxygen calibration values from the CTD bottle samples are available for each cast. The oxygen titration for the samples was performed during the cruise by Diego Ugaz and Grace Owen. As noted previously in the report, we starting using new chemical dispensers after cast 035. Fig. 8b clearly shows a decreased range in residual oxygen values (CTD sensor compared to titrated sample) after cast 035. However, we found that the cast 000-035 mean residual and the cast 035- 060 mean residual were similar, as were the dependence on depth. Overall, the offset between the sensor and calibration readings show the expected dependence on depth, with larger offsets (sensor value too high) at greater depths (Fig. 8b). The error for the calibrated oxygen is 0.039 ml/l, which is roughly 1% of the measured oxygen concentrations and within the range recommended by WOCE.
Figure 8 (a) Difference between salinity value from CTD primary sensor and bottle sample. Negative values indicate
that bottle sample was higher than sensor value. Red line shows a difference of zero. (b) Same as (a) except for
oxygen concentration, and the CTD secondary sensor was used.
2.2. ADCP casts

A total of 61 lowered ADCP casts was obtained using upward- and downward-looking 300 kHz
ADCPs. The resultant meridional sections of zonal and meridional velocity are shown in Fig. 9.
The equatorial undercurrent is clearly visible within about 1.5° of latitude from the equator, with
eastward velocities reaching close to 1 m/s. Strong westward flow of the South Equatorial
Current is noticeable north and south of the undercurrent core.

      Figure 9 Zonal (a) and meridional (b) velocity sections along the 23°W cruise track from the lowered ADCP casts.

2.3. Argo deployments

A total of 12 Argo floats were deployed (see Figs. 1, 10 and Table 2 for details). They were
housed in individual cardboard boxes with straps around them that were held together by a
water-activated release. A long rope was provided for lowering the box over the railing off the
You can also read