DeepDarts: Modeling Keypoints as Objects for Automatic Scorekeeping in Darts using a Single Camera
←
→
Page content transcription
If your browser does not render page correctly, please read the page content below
DeepDarts: Modeling Keypoints as Objects for
                                                                Automatic Scorekeeping in Darts using a Single Camera

                                                     William McNally Pascale Walters Kanav Vats Alexander Wong John McPhee
                                                                Systems Design Engineering, University of Waterloo, Canada
                                                           Waterloo Artificial Intelligence Institute, University of Waterloo, Canada
arXiv:2105.09880v1 [cs.CV] 20 May 2021

                                                                  {wmcnally, pbwalter, k2vats, a28wong, mcphee}@uwaterloo.ca

                                                                                                                                                                      T20   18

                                                                                                                                                                        1

                                                                                                                               1. Transform
                                                                            Keypoint
                                                                                                                               2. Calibrate Board
                                                                            Detector
                                                                                                                               3. Score

                                                  input image                                  keypoint detections                                               score prediction

                                         Figure 1: Overview of DeepDarts, a method for predicting dart scores from a single image captured from any camera angle. DeepDarts uses
                                         a new deep learning-based keypoint detector that models keypoints as objects to simultaneously detect and localize the dart coordinates
                                         (purple) and four dartboard calibration points (yellow). The calibration points are used to transform the dart locations to the dartboard
                                         plane and calibrate the scoring area. The dart scores are then classified based on their position relative to the center of the dartboard.

                                                                   Abstract                                      ing data (830 images) and various camera angles, we uti-
                                             Existing multi-camera solutions for automatic score-                lize transfer learning and extensive data augmentation to
                                         keeping in steel-tip darts are very expensive and thus in-              achieve a test accuracy of 84.0%. Because DeepDarts relies
                                         accessible to most players. Motivated to develop a more                 only on single images, it has the potential to be deployed on
                                         accessible low-cost solution, we present a new approach to              edge devices, giving anyone with a smartphone access to an
                                         keypoint detection and apply it to predict dart scores from             automatic dart scoring system for steel-tip darts. The code
                                         a single image taken from any camera angle. This prob-                  and datasets are available1 .
                                         lem involves detecting multiple keypoints that may be of the
                                         same class and positioned in close proximity to one another.            1. Introduction
                                         The widely adopted framework for regressing keypoints us-                  Deep learning-based computer vision has recently
                                         ing heatmaps is not well-suited for this task. To address               gained traction in the sports industry due to its ability to au-
                                         this issue, we instead propose to model keypoints as objects.           tonomously extract data from sports video feeds that would
                                         We develop a deep convolutional neural network around                   otherwise be too tedious or expensive to collect manually.
                                         this idea and use it to predict dart locations and dartboard            Example sports applications include field localization [20],
                                         calibration points within an overall pipeline for automatic             player detection and tracking [39, 11, 42], equipment and
                                         dart scoring, which we call DeepDarts. Additionally, we                 object tracking [45, 44, 36], pose estimation [5, 29, 2], event
                                         propose several task-specific data augmentation strategies              detection [27, 15, 6, 43, 37], and scorekeeping [45]. This
                                         to improve the generalization of our method. As a proof                 data is often more informative than conventional human-
                                         of concept, two datasets comprising 16k images originat-                recorded statistics and as such, the technology is quickly
                                         ing from two different dartboard setups were manually col-              ushering in a new era of sports analytics. In this work, we
                                         lected and annotated to evaluate the system. In the primary             explore the use of deep learning-based computer vision to
                                         dataset containing 15k images captured from a face-on view              perform automatic scorekeeping in steel-tip darts.
                                         of the dartboard using a smartphone, DeepDarts predicted                   While darts is a sport that is played professionally un-
                                         the total score correctly in 94.7% of the test images. In a
                                         second more challenging dataset containing limited train-                   1 https://github.com/wmcnally/deep-darts.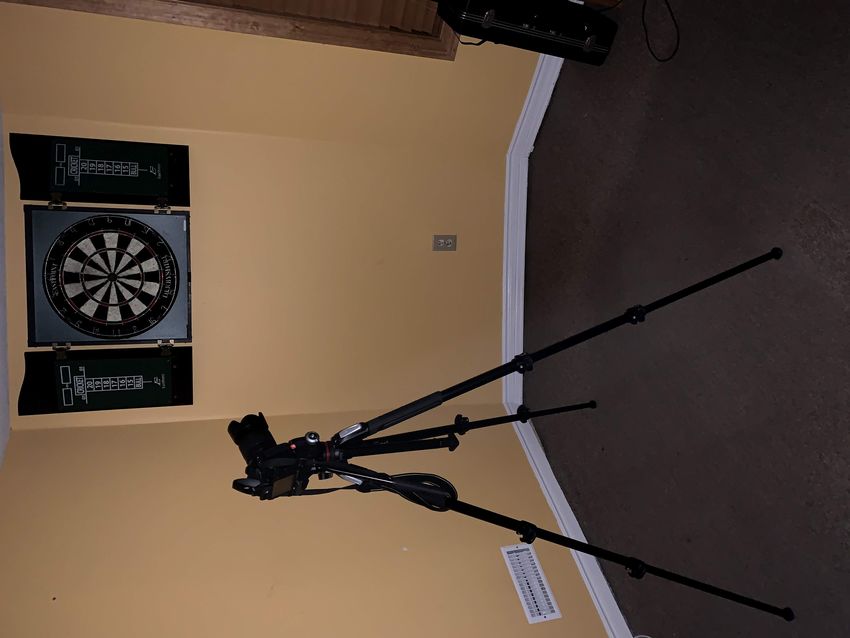
der multiple governing bodies, it is better known as the tra-               gle image taken from any camera angle. (ii) We contribute
ditional pub game that is played recreationally around the                  two dartboard image datasets containing a total of 16k dart-
world. Typically, it is the responsibility of the player to                 board images and corresponding labels for the dart landing
keep their own score, and doing so requires quick mental                    positions and four dartboard calibration points. We addi-
math. In “501,” the most widely played game format, the                     tionally propose a task-specific evaluation metric that takes
player must add up the individual scores of each dart and                   into account false positives and negatives and is easy to in-
subtract this amount from their previous total. As trivial as               terpret. (iii) Finally, we propose several task-specific data
this may sound, scorekeeping in darts slows down the pace                   augmentation strategies and empirically demonstrate their
of the game and arguably makes it less enjoyable.                           generalization benefits.
    Several automated scoring systems have therefore been
proposed to improve the playability of darts. A prerequi-                   2. Related Work
site for these systems is the precise location of dart landing                  To the best of our knowledge, there are no published
positions relative to the dartboard, so these systems can ad-               works in the computer vision literature that focus on the
ditionally provide statistics based on dart positional data.                problem of predicting dart scores from images. Perhaps the
Electronic dartboards have been used together with plastic-                 most closely related works are those using non-deep learn-
tip darts to enable automatic scoring. However, this varia-                 ing image processing for automatic scoring in range shoot-
tion of the sport known as soft-tip darts lacks the authentic-              ing [1, 13, 3] and archery [51, 31]. These methods use tra-
ity of traditional steel-tip darts played on a bristle dartboard,           ditional image processing algorithms to engineer features
and is much less popular as a result. For this reason, multi-               for detection and scoring. However, deep learning-based
camera systems have been developed for automatic scoring                    detection methods offer superior performance as they learn
in steel-tip darts2 . These systems position cameras around                 robust high-level features directly from the data. Further-
the circumference of the dartboard and use image process-                   more, deep learning-based methods are better equipped to
ing algorithms to locate the darts on the board. While these                handle occlusion, variations in viewpoint, and illumination
multi-camera systems are accurate and subtle, they are ex-                  changes [48]. Our method for predicting dart scores from
pensive and only function with the dartboard for which they                 single images was inspired by the deep learning literature
were designed. Therefore, they are not very accessible.                     related to keypoint and object detection, and so we discuss
Moreover, the cameras are susceptible to damage from way-                   these research areas in the following sections.
ward darts due to their close proximity to the dartboard.
                                                                            Keypoint detection involves simultaneously detecting ob-
    In an effort to develop a more accessible automated scor-
                                                                            jects and localizing keypoints associated with those objects.
ing system for steel-tip darts, we investigate the feasibility
                                                                            A common application of keypoint detection is 2D human
of using deep learning to predict dart scores from a sin-
                                                                            pose estimation [41], which involves localizing a set of key-
gle image taken from any front-view camera angle. To the
                                                                            points coinciding with various anatomical joints for each
best of our knowledge, no like software currently exists.
                                                                            person in an image. The two-stage “top-down” approach
We propose a new approach to keypoint detection that in-
                                                                            is the most common [28, 38], where an off-the-shelf object
volves modeling keypoints as objects, which enables us to
                                                                            detection CNN is first used to find the people in the im-
simultaneously detect and localize multiple keypoints that
                                                                            age and then a second CNN localizes the keypoints for each
are of the same type and clustered tightly together. Re-
                                                                            person instance. The second network learns the keypoint
gressing keypoints using heatmaps, which is currently the
                                                                            locations by minimizing the mean squared error between
de facto standard for keypoint estimation [28, 10, 38, 47, 9,
                                                                            predicted and target heatmaps [40], where the latter contain
8, 30, 21, 22, 14], does not adequately address this problem.
                                                                            2D Gaussians centered on the ground-truth keypoint loca-
We develop a deep convolutional neural network (CNN)
                                                                            tions. A separate heatmap is predicted for each keypoint
around this idea and use it to detect four dartboard calibra-
                                                                            type, or class. The heatmap regression method is also used
tion points in addition to the dart landing positions. The
                                                                            in related keypoint estimation tasks, including hand pose
predicted calibration points are used to map the predicted
                                                                            estimation [22] and facial landmark detection [14].
dart locations to a circular dartboard and calibrate the scor-
                                                                                Running two CNNs in series is not cost-efficient, so al-
ing area. The dart scores are then classified based on their
                                                                            ternative human pose estimation methods have been pro-
relative position to the center of the dartboard. We refer to
                                                                            posed that bypass the initial person detection stage. These
this system as DeepDarts (see Fig. 1).
                                                                            are referred to as “bottom-up” approaches because they first
    Our research contributions are summarized as follows:
                                                                            localize all the keypoints in the image and then assign them
(i) We develop a new deep learning-based solution to key-
                                                                            to different person instances [8, 10]. Bottom-up approaches
point detection and apply it to predict dart scores from a sin-
                                                                            save computation, but they are generally less accurate. This
   2 Examples of such systems are sold under the brand names Scolia, Spi-   is in part due to the scale of the people in the image with
derbull, Dartsee, and Prodigy.                                              respect to the spatial resolution of the heatmaps, but also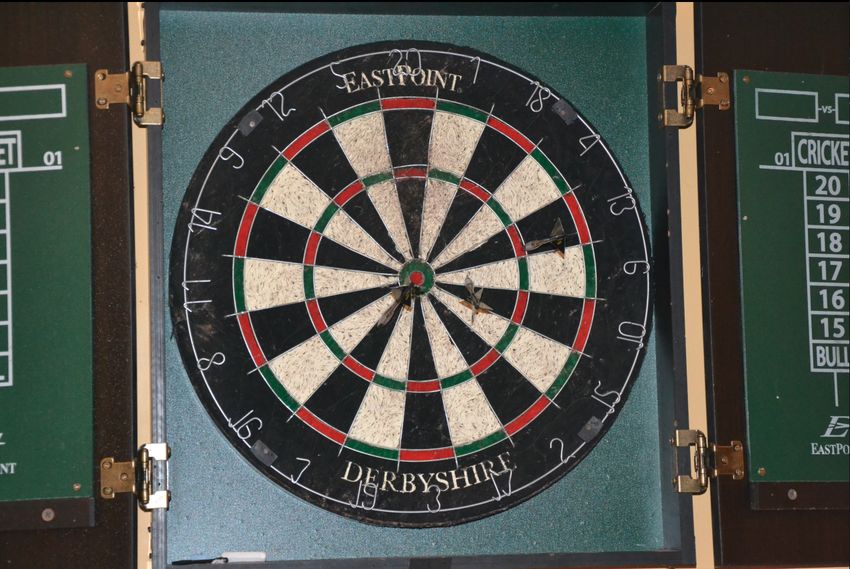
flight
due to the fact that when two keypoints of the same class            tip              barrel              shaft
appear very close together, their heatmap signals overlap
and can be difficult to isolate (e.g., a right knee occludes
another right knee, see Fig. 9c in [8]). If the bottom-up                  Figure 2: The four components of a steel-tip dart.
approach were applied to the problem of predicting dart lo-
cations, overlapping heatmap signals would be an issue as        are scored by hitting specific marked areas of the dartboard.
darts are often clustered tightly together. On the other hand,   The modern dartboard is divided into 20 numbered sections
the top-down keypoint detection pipeline demands exces-          scoring 1 to 20 points (see Fig. 1). Two small circles are lo-
sive computation that does not favor deployment on edge          cated at the center of the dartboard; they are known collec-
devices. Importantly, our proposed approach to keypoint          tively as the bullseye. The inner red circle of the bullseye is
detection adequately addresses both of these issues.             commonly referred to as “double bull” (DB) and is worth 50
                                                                 points, whereas the outer green circle is typically referred
Object detection involves detecting instances of objects of      to simply as “bull” (B) and is worth 25 points. The “dou-
a certain class within an image, where each object is lo-        ble ring” is the thin red/green outer ring and scores double
calized using a rectangular bounding box. Similar to other       the points value of that section. The “treble ring” is the
image recognition tasks, deep learning approaches exploit-       thin red/green inner ring and scores triple the points value
ing CNNs have demonstrated proficiency in object detec-          of that section. Typically, three darts are thrown per turn,
tion. These methods can be categorized into two main types       so the maximum attainable score for a single turn is 180, by
based on whether they use one or two stages. The two-stage       scoring three triple-20s (T20).
approach is reminiscent of a more traditional object detec-
tion pipeline, where region proposals are generated and then     4. DeepDarts
classified into different object categories. These methods
                                                                     DeepDarts is a system for predicting dart scores from
include the family of R-CNN models [17, 16, 35, 19, 7].
                                                                 a single image taken from any camera angle. It consists
Single-stage object detection models regress and classify
                                                                 of two stages: keypoint detection and score prediction.
bounding boxes directly from the image in a unified ar-
                                                                 DeepDarts takes on a new approach to keypoint detection,
chitecture. Examples of these methods include the Sin-
                                                                 in which keypoints are modeled as objects. We discuss each
gle Shot MultiBox Detector (SSD) [25], RetinaNet [24],
                                                                 stage of the system in more detail in the following sections.
and the “You Only Look Once” (YOLO) family of mod-
                                                                 Finally, several data augmentation strategies are proposed
els [32, 33, 34, 4]. Single-stage object detectors offer supe-
                                                                 to improve the accuracy of the dart score predictions.
rior computational efficiency, and are able detect objects in
real-time [32]. Moreover, it has recently been shown that        4.1. Modeling Keypoints as Objects for Dartboard
single-stage object detectors can be scaled to achieve state-         Keypoint Detection
of-the-art accuracy while maintaining an optimal accuracy-           Predicting dart scores demands a system that can pre-
speed trade-off [46].                                            cisely locate the exact coordinates where the dart tips strike
   Because object detectors are often used as a prelimi-         the dartboard. While this problem shares similarities with
nary to keypoint detection, there is significant overlap be-     2D keypoint regression (e.g., 2D human pose estimation,
tween the two streams of research. Mask R-CNN was used           hand pose estimation, and facial landmark detection), there
to predict keypoints by modeling keypoint locations using        are two key differences: (i) the total number of keypoints
a one-hot mask [19]. However, the accuracy of this ap-           is not known a priori, as there may be any number of darts
proach is inherently limited by the spatial resolution of the    present in a given dartboard image, and (ii) the darts are
one-hot mask. Conversely, keypoint estimators have been          indistinguishable from one another and thus cannot be as-
repurposed for object detection. Zhou et al. proposed to         signed to different keypoint classes. The widely adopted
model objects as points by regressing object centers using       framework for regressing 2D keypoints using heatmaps is
heatmaps [50]. Our approach to keypoint detection can be         ill-equipped to handle this task because when multiple darts
viewed as the opposite to that of Zhou et al., where we in-      appear close together, their heatmap signals would overlap,
stead model keypoints as objects to mitigate the drawbacks       and isolating the individual keypoints from the combined
of heatmaps when multiple keypoints of the same type exist       heatmap signals would be impractical.
in an image.                                                         To address these issues surrounding the use of heatmaps,
                                                                 we propose to adapt a deep learning-based object detector
3. Dart Scoring and Terminology                                  to perform keypoint detection by modeling keypoints as ob-
   Darts is a sport in which pointed projectiles (the darts)     jects. To this end, we introduce the notion of a keypoint
are thrown at a circular target known as a dartboard. A dart     bounding box, which is a small bounding box that repre-
is made of four components, including the tip, barrel, shaft,    sents a keypoint location using its center. During the train-
and flight. These components are indicated in Fig. 2. Points     ing phase, the keypoint detection network is optimized in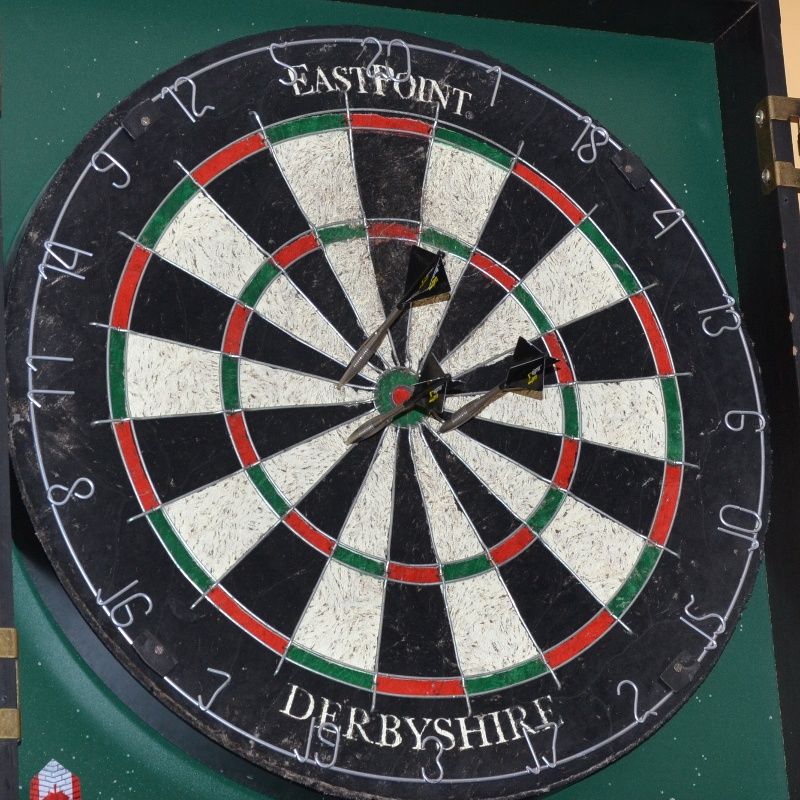
input image I
of calibration points P̂c and their known locations on the
dartboard, the estimated homography matrix Ĥ, which is
a 3x3 invertible matrix that transforms a point in the im-
age plane to a corresponding point in the dartboard plane,
has a closed-form solution and is computed via a direct lin-
ear transform algorithm [18]. To obtain the corresponding
points P̂0c and P̂0d in the dartboard plane, the transformation
Deep is performed as follows
Convolutional
0
Neural Network
x̂ · λ x̂
ŷ 0 · λ = Ĥ ŷ (2)
keypoint detections λ 1
(I)
where x0 and y 0 are the predicted coordinates of a point in
Figure 3: Example inference of the deep neural network N that the dartboard plane. The center of the dartboard is com-
models keypoints as objects in order to map an input image I to puted as the mean of the transformed calibration points P̂0c .
the dart coordinates P̂d and four calibration points P̂c . Here, the The radius of the outer edge of the double ring is computed
keypoint bounding box size is 10% of the image size. as the mean of the distances between P̂0c and the center.
Knowing the ratios between the radii of all circles in the
the same manner as an object detector, i.e., using a loss scoring area3 , the dart score predictions Ŝ are obtained by
function based on the intersection over union (IoU) of the classifying the points P̂0d into the dartboard sections based
predicted and target keypoint bounding boxes. However, at on their distance from the center and their angle from a ref-
inference time, the predicted keypoints are taken as the cen- erence direction, i.e., using polar coordinates. We refer to
ters of the predicted keypoint bounding boxes. Notably, our the represented mapping of dartboard image keypoints to
keypoint detection method may be applied to any task that dart scores as the scoring function φ(·):
requires detecting an unknown number of keypoints, where
there may be multiple instances of the same keypoint class Ŝ = φ(P̂c , P̂d ). (3)
in the input image. 4.3. Data Augmentation for Dart Score Prediction
To apply the proposed keypoint detection method to pre-
To help regularize the training of N , which in turn
dict dart scores, we develop a deep convolutional neural
improves the accuracy of the dart score predictions, we
network N (·), which takes as input an RGB image I ∈
propose several task-specific data augmentation strategies.
Rh×w×3 and outputs the locations of four dartboard cali-
Some of the strategies change the positions of the darts
bration points P̂c = {(x̂i , ŷi )}4i=1 and D dart landing po-
while keeping the calibration points fixed, so as to not con-
sitions P̂d = {(x̂j , ŷj )}D
j=1 in the image coordinates, i.e., fuse the network regarding to the relative positioning of the
{(x̂, ŷ) ∈ R2 : 0 < x̂ < w, 0 < ŷ < h}: calibration points, while others change the positions of all
N (I) = (P̂c , P̂d ). (1) the keypoints. Each augmentation strategy is described be-
low. For dartboard flipping and dartboard rotation, the aug-
The function of the network N is illustrated in Fig. 3. Dur- mentation is performed on the transformed I0 , Pc 0 , and Pd 0 ,
ing training, we model the four calibration points as sepa- before transforming back to the original perspective using
rate classes and the dart locations as a fifth class. We uti- the inverse homography matrix H −1 .
lize the state-of-the-art YOLOv4 [4] as the base network
Dartboard Flipping. I0 and Pd 0 are randomly flipped hor-
for its superior computational efficiency and accuracy in
izontally and/or vertically while Pc 0 remains fixed.
the object detection task. More specifically, we implement
its lightweight version, YOLOv4-tiny [46], to help sup- Dartboard Rotation. I0 and Pd 0 are randomly rotated (in
port potential mobile deployment. We conduct several ab- the image plane) in the range [-180°, 180°] using a step size
lation experiments to investigate the influence of the key- of 18° or 36° while Pc 0 remains fixed. A step size of 18°
point bounding box size on keypoint localization, and in- degrees keeps the dartboard sections aligned, where either
vestigate the benefit of multiple data augmentation strate- a white or black section may appear at the top. A step size
gies that were developed specifically for the task at hand. of 36° ensures only black sections appear at the top.
Small Rotations. To account for dartboards that are not
4.2. Dart Score Prediction perfectly vertically aligned, we apply small random rota-
The four chosen calibration points are located on the tions to I, Pc , and Pd in the range [-2°, 2°].
outer edge of the double ring, at the intersections of 5 and 3 Dartboard specification referenced from the British Darts Organisa-
20, 13 and 6, 17 and 3, and 8 and 11 (indicated in Fig. tion Playing Rules: https://www.bdodarts.com/images/bdo-content/doc-
3). Using the correspondence between the detected set lib/B/bdo-playing-rules.pdf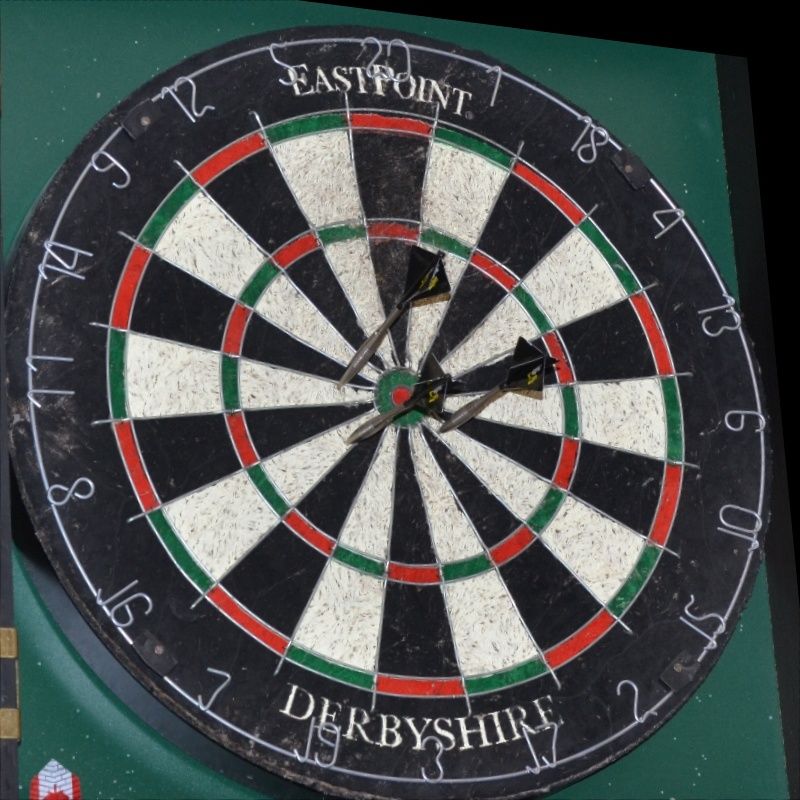
(a) sρ = 0 (warped perspective) (b) sρ = 0.5 (warped perspective) (c) sρ = 1 (original perspective) (d) sρ = 2 (warped perspective)
Figure 4: Demonstrating the effect of the perspective warping data augmentation strategy. The depicted images are examples of when the
non-diagonal elements of the inverse homography H −1 matrix are scaled equally by sρ ∈ {0, 0.5, 1, 2}. During training, the non-diagonal
elements of H −1 are scaled randomly and separately.
Perspective Warping. To help generalize to various cam- ran parallel with the dartboard, which allowed an iPhone
era angles, we randomly warp the perspective of the dart- XR to be mounted overhead near the throw line. A piece
board images. To implement perspective warping in a prin- of double-sided adhesive tape was placed on the rear side
cipled manner, H −1 is randomly perturbed before I0 , Pc 0 , of the iPhone plastic case, and the case was secured to the
and Pd 0 are transformed back to the original perspective. transition wall in-line with the center of the dartboard, and
We introduce a hyperparameter ρ to control the amount in an upside-down position such that the iPhone camera ex-
of perspective warping. Specifically, the non-diagonal ele- tended just beyond the low ceiling. A diagram of the data
ments of H −1 are randomly scaled by factors sampled from collection setup is shown in Fig. 5a, and a sample image
a uniform distribution in the range [0, ρ]. from the iPhone XR is shown in Fig. 5b.
To illustrate the effect of the augmentation, it is helpful Steel-tip darts were thrown by left- and right-handed be-
to consider a scenario when the non-diagonal elements of ginner and intermediate players. An image was captured
H −1 are scaled equally by sρ . When sρ = 0, H −1 ap- after each throw, and the darts were retrieved after three
proximately equals the identity matrix and the image re- darts were thrown. Capturing an image after each throw
mains in a face-on perspective, i.e., with a perfectly cir- increased the number of unique images in the dataset and
cular dartboard. When sρ = 1, H −1 is unchanged and also helped during annotation to identify the landing posi-
the image is transformed back to its original perspective. tion of a dart that was occluded by a subsequently thrown
For 0 < sρ < 1, the warped perspective is effectively an dart. Moreover, a thrown dart would occasionally impact a
interpolation between the face-on and original perspective. dart already on the board, changing the orientation of the
When sρ > 1, the warped perspective is effectively an ex- previously thrown dart and thus its appearance from the
trapolation of the original perspective. Example warped im- previous image. A variety of different games (e.g., 501,
ages for sρ ∈ {0, 0.5, 1, 2} are shown in Fig. 5. During Cricket, Around the World, etc.) were played to distribute
training, the non-diagonal elements of H −1 are scaled sep- the data across all sections of the dartboard.
arately and randomly to increase variation.
Several windows were in the vicinity of the dartboard,
5. Datasets and images were collected during the day and at night,
A total of 16,050 dartboard images containing 32,027 which provided a variety of natural and artificial lighting
darts were manually collected and annotated. The images conditions. In some lighting conditions, the darts cast shad-
originate from two different dartboard setups, and thus were ows on the dartboard. A number of edge cases were encoun-
separated into two datasets D1 and D2 . The primary dataset tered during the data collection. For example, flights would
D1 includes 15k images collected using a smartphone cam- occasionally dislodge upon striking the dartboard and fall
era positioned to capture a face-on view of the dartboard. to the ground. In rare cases, the tip of a thrown dart would
The second dataset D2 contains the remaining 1050 images, penetrate the stem of a previously thrown dart and reside
which were taken from various camera angles using a digi- there, never reaching the dartboard. The images were col-
tal single-lens reflex (DSLR) camera mounted on a tripod. lected over 36 sessions. In four sessions amounting to 1,200
images, the score of each dart was also recorded. This in-
5.1. Image Data Collection: Dataset D1 formation was used to assess the accuracy of the annotation
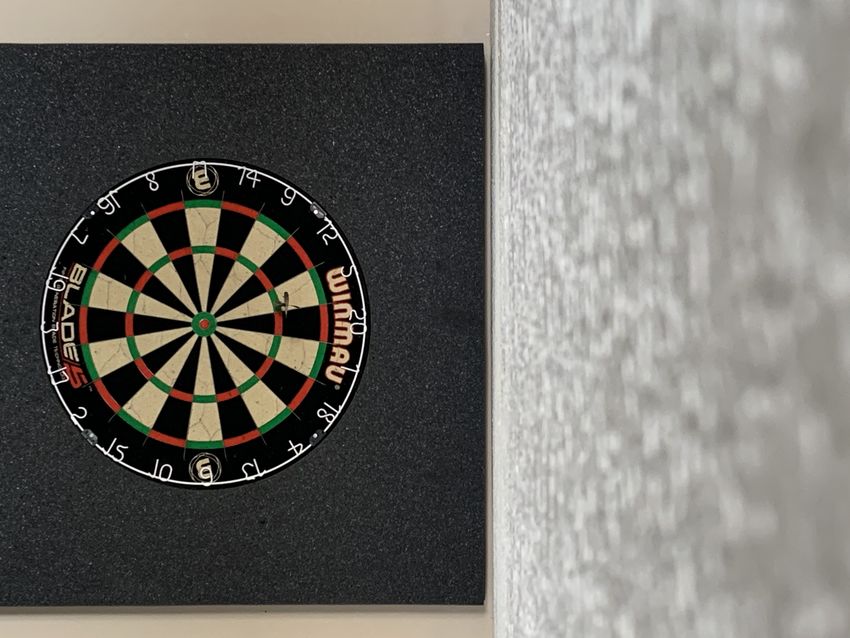
A Winmau Blade 5 dartboard was mounted at regulation process (see Section 5.3 for details). The dataset was split at
height (1.73m) in a section of a room with a lowered ceil- the session level to generate train, validation, and test sub-
ing. The transition wall between the low and high ceilings sets containing 12k, 1k, and 2k images, respectively.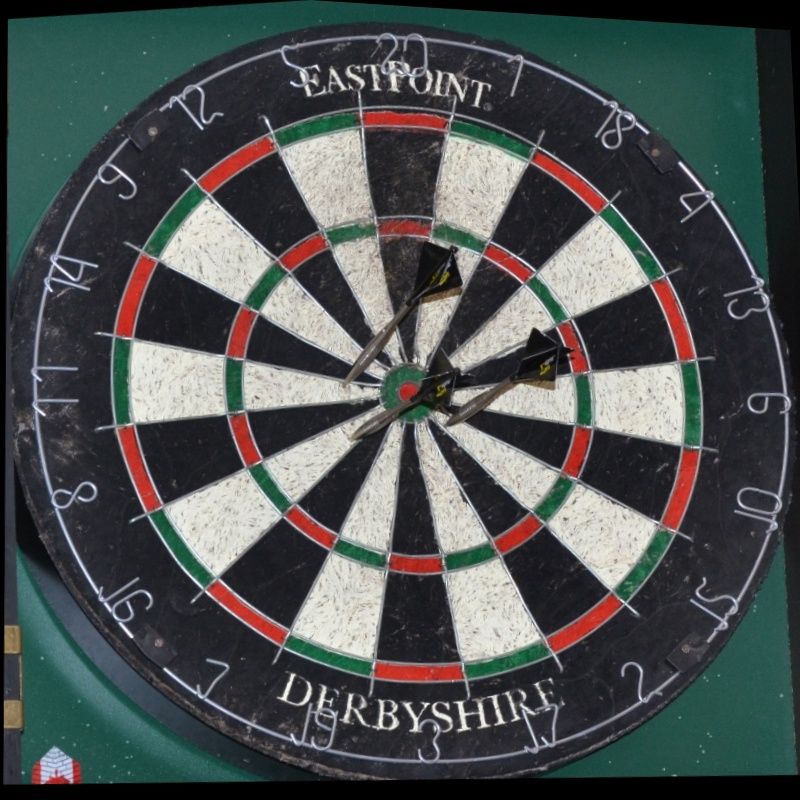
2.33 m

iPhone
                              dartboard

                                                   2.07 m
                                          1.73 m
         (a) D1 data collection setup                          (b) D1 sample image                (c) D2 data collection setup                  (d) D2 sample image

                                                            Figure 5: Data collection setups and sample images.

5.2. Image Data Collection: Dataset D2
   The dartboard setup used in this dataset included an East-
Point Derbyshire Dartboard and Cabinet Set. Images were
collected using a Nikon D3100 DSLR camera mounted on
a tripod. The data collection setup is depicted in Fig. 5c,
and a sample image is shown in Fig. 5d. Similar to dataset
D1 , images were taken after each thrown dart. A total of
1,050 images were collected over 15 sessions, and the cam-
era was repositioned in each session to capture a variety of
camera angles. The dataset also includes a variety of light-
ing conditions resulting from various combinations of nat-                              Figure 6: Probability distribution of the labelled dart positions in
ural and artificial light (from ceiling lights as well as the                           D1 and D2 (32,027 darts in total). The darker regions represent
                                                                                        higher frequency landing positions.
camera flash). The dataset was split at the session level to
generate train, validation, and test subsets containing 830,                                                 2000
                                                                                           Number of darts

70, and 150 images, respectively.
   While the images in this dataset may not be consistent                                                    1000
with those encountered during actual deployment on an
edge device, the primary purpose of this dataset is to test                                                    0
the automatic dart scoring system in a more challenging sce-                                                        20 5 19 1 3 16 7 171810121315 2 11 6 4 14 9 8 B
                                                                                                                                     Dartboard section
nario including various camera angles and limited training                              Figure 7: Number of labelled darts in each section of the dart-
data. We also use this dataset to investigate whether the                               board. ‘B’ includes bull and double bull.
knowledge learned from one dartboard setup can be trans-
ferred to another.                                                                      square bounding boxes that enclose the dartboard. These
                                                                                        were automatically generated using Pc .
5.3. Keypoint Annotation                                                                    The probability distribution of the labelled dart positions
   All images were annotated by a single person using a                                 is plotted in Fig. 6, and shows that T20 and T19 were among
custom-made annotation tool developed in Python 3. For                                  the most highly targeted areas of the dartboard (darker re-
each image, up to seven keypoints (x, y) were identified,                               gions). The dart counts per scoring section are provided in
including the four dartboard calibration points Pc , and up                             Fig. 7, and show a fairly uniform distribution, with the ex-
to three dart landing positions Pd . In face-on views of the                            ception of 20, 19, and their neighbouring sections, which
dartboard, the exact position of a dart was often not visible                           were more frequent, and the bullseye, which was less fre-
due to self-occlusion, as the dart barrel and flight tended to                          quent.
obstruct the view of the dart tip. Occasionally, there was oc-
clusion from other darts as well. In such cases, the dart land-                         5.4. Percent Correct Score
ing position was inferred at the discretion of the annotator.                              A meaningful accuracy metric for detection should take
To assess the accuracy of the labeling process, the scores of                           into account false positives as well as false negatives. The
the labeled darts were computed using the scoring function                              mean average precision (mAP) is a common accuracy met-
φ(Pc , Pd ) and were compared against the actual scores of                              ric used in object detection that takes into account false
the 1,200 darts that were recorded during the collection of                             positives and negatives by averaging the area under the
the D1 images. The labeled and actual scores matched for                                precision-recall curve at various IoU thresholds. However,
97.6% of the darts. The dataset annotations also include                                mAP can be difficult to interpret and put into context. We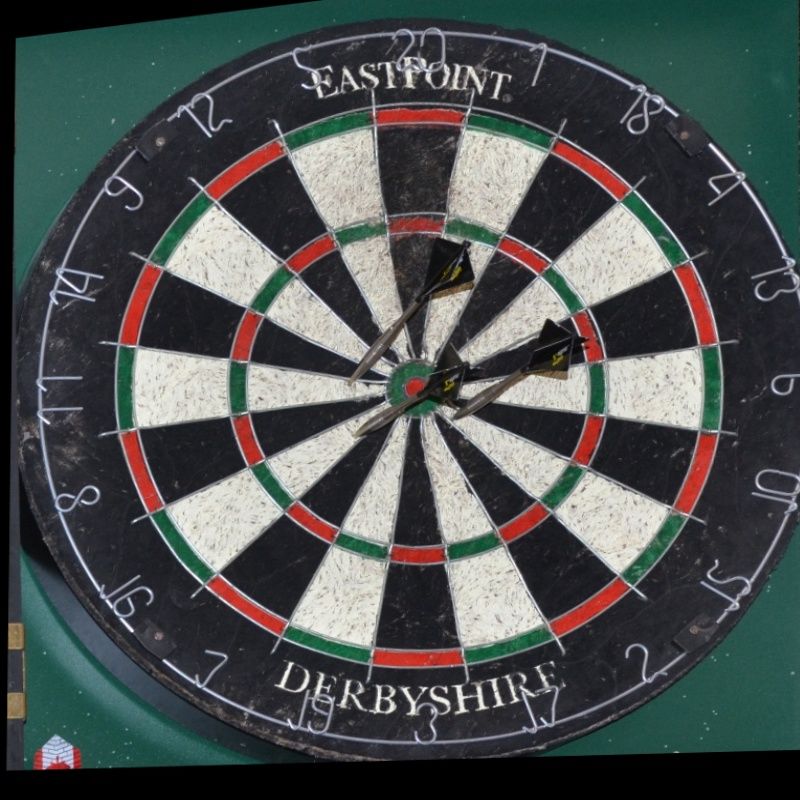
therefore introduce a task-specific accuracy metric that is       Augmentation Strategy        D1 val PCS        D2 val PCS
easy to interpret and takes into account false positives and      None                             77.5              57.7
false negatives through evaluation of the total score of the      Dartboard Flipping            83.1 (+5.6)       60.6 (+2.9)
dartboard, as opposed to the individual dart scores. We refer     Dartboard Rot. (18°)          83.2 (+5.7)       58.3 (+0.6)
to this metric as the Percent Correct Score (PCS), and it rep-    Dartboard Rot. (36°)          84.3 (+6.8)       60.0 (+2.3)
resents the percentagePof dartboard image samples whose           Small Rotations               82.1 (+4.6)       62.6 (+4.9)
predicted  total score     Ŝ matches the labeled total score     Perspective Warping           80.3 (+2.8)       64.9 (+7.1)
P
    S. More explicitly, over a dataset with N images, the         Jitter                        81.7 (+4.2)       63.7 (+6.0)
PCS is computed as follows:                                      Table 1: Effect of the proposed data augmentation strategies. D2
                   N                                             PCS averaged over five runs.
             100   X         X           X
    P CS =               δ         Ŝi −       Si = 0 %   (4)
              N    i=1                                                 75
6. Experiments                                                         50

                                                                 PCS
    This section contains results from various ablation exper-         25
iments investigating the influence of different training con-
figurations on the validation accuracy of DeepDarts. Fol-                   0     20        40         60         80        100
lowing the ablation experiments, optimal training configu-                              Bounding box size (px)
rations for D1 and D2 are proposed and the final test results
are reported.                                                    Figure 8: Influence of keypoint bounding box size on D1 valida-
                                                                 tion PCS using a fixed input size of 480.
6.1. Implementation Details
    The ground-truth dartboard bounding boxes were used to       benefits of small translations (jitter). Each data augmenta-
extract a square crop of the dartboard from the raw images.      tion strategy was tested individually and was applied with a
The cropped dartboard images were then resized to the de-        probability of 0.5 over 20 epochs of training. An input size
sired input size. In an actual application of DeepDarts, we      of 480 was used and the keypoint bounding box size was
argue that the user could manually draw a bounding box           set to 12 px. The D1 experiments were run on four GPUs
around the dartboard in the camera view, and additional          using a batch size of 32 per GPU. The D2 experiments were
scaling / translation augmentation could be used to account      run on two GPUs using a batch size of 4 per GPU, result-
for the variability in the drawn bounding box. Alternatively,    ing in approximately the same number of training iterations
N could be trained to simultaneously detect the dartboard        as the D1 experiments. The validation PCS is reported for
and keypoints from the raw images, but doing so could po-        each data augmentation strategy in Table 1. Due to the lim-
tentially have a negative effect on the accuracy of the dart     ited number of samples in the D2 validation set, there was
score predictions.                                               significant variability in the PCS from one run to the next.
    In all experiments, YOLOv4-tiny [46] was used as the         We therefore report the mean PCS over five runs for the D2
base network for keypoint detection. All networks were           experiments.
trained using the Adam optimizer [23] with a cosine de-             All of the data augmentation strategies improved the val-
cay learning rate schedule and an initial learning rate of       idation PCS. On D1 , dartboard rotations with a step size of
0.001 [26]. The loss function used was the same as in the        36° provided the greatest benefit, and an improvement of
original YOLOv4 implementation [4, 46], and is based on          1.1 PCS over step sizes of 18°, suggesting that the place-
CIoU [49].                                                       ment of the section colours had an effect on learning. Per-
    During inference, the predicted keypoint bounding boxes      spective warping was the most effective on D2 as it helped
were filtered using an IoU threshold of 0.3 and a confidence     generalize to the various camera angles in the dataset, and
threshold of 0.25. If extra calibration points were detected,    provided an improvement of 7.1 PCS.
the points with the highest confidence were used. If one cal-
ibration point was missed, its position was estimated based      Keypoint Bounding Box Size. The keypoint bounding box
on the positions of the three detected calibration points. If    size was varied from 0.5% (2.4 px) to 20% (96 px) of the
two or more calibration points were missed, the sample was       input size, which was fixed at 480. No data augmentation
assigned a total score of 0. Further implementation details      was used and each network was trained on D1 for 20 epochs
are provided in the experiment descriptions as needed.           using two GPUs and a batch size of 32 per GPU. The val-
                                                                 idation accuracies are plotted in Fig. 8. It is evident from
6.2. Ablation Experiments                                        the results that using very small keypoint bounding boxes,
Data Augmentation. In addition to the data augmentation          in this case less than 1% or 4.8 px, is detrimental to train-
strategies proposed in Section 4.3, we also investigate the      ing. Above this threshold, however, the accuracy is not very
200          197.3
                                                                         PCS                          D1        D1       D2        D2
                                          125.0                          FPS
 PCS / FPS

                                                                                      Method         val      test      val      test
             100   73.5            79.8            82.6 74.6     83.5                                PCS       PCS      PCS       PCS
                                                                        55.8
                                                                                      DeepDarts      92.4      94.7     87.1      84.0
              0                                                                             Table 3: Final validation and test PCS.
                     320             480                 640       800
                                            Input Size                         after which each data augmentation strategy was applied at
Figure 9: Influence of input size on D1 validation PCS and infer-              a rate of 0.5. For dartboard rotation, a step size of 36° was
ence speed.                                                                    used. On D1 , perspective warping was omitted, and the net-
                                                                               work was initialized with the ImageNet weights. On D2 ,
               Pretraining        D1 val PCS              D2 val PCS           the network was initialized with the pretrained weights from
               None                   79.8                    57.7             D1 , and we report the results for the model with the best test
               ImageNet            82.2 (+2.4)             61.7 (+4.0)         PCS over five runs. The experiments were run on two GPUs
               Dataset D1               –                 67.7 (+10.0)         using batch sizes of 16 and 4 per GPU for datasets D1 and
Table 2: Influence of transfer learning from ImageNet and dataset              D2 , respectively. The validation and test PCS are provided
D1 on validation PCS. D2 PCS averaged over five runs.                          in Table 3. The test PCS of DeepDarts was 94.7% on D1 ,
                                                                               and 84.0% on D2 .
sensitive to the keypoint bounding box size, but begins to
decrease slightly above a relative keypoint bounding box                       Failure Cases. The most common failure mode was missed
size of 7.5% (36 px).                                                          dart detections due to occlusion from other darts. In actual
                                                                               deployment, some of these errors could be accounted for
Input Size. To investigate the trade-off between accuracy
                                                                               as they would be detectable when a previous dart predic-
and inference speed, the input size was varied from 320 to
                                                                               tion with high confidence suddenly disappears. The second
800. The keypoint bounding box sizes were set to 2.5% of
                                                                               most common error occurred when darts were on the edge
the input size, and each network was trained for 20 epochs
                                                                               of a section and were incorrectly scored. In rare cases, the
on D1 using two GPUs. For input sizes of 640 and 800,
                                                                               ground-truth labels were incorrect, darts were missed due to
the batch sizes were reduced to 24 and 16 per GPU, respec-
                                                                               unusual dart orientations, or calibration points were missed
tively, to accommodate limited GPU memory. The valida-
                                                                               due to dart occlusion. In future work, we recommend train-
tion accuracies are provided in Fig. 9, and show diminishing
                                                                               ing the network to detect redundant calibration points to im-
returns for a linear increase in the input resolution. The in-
                                                                               prove the accuracy of the system. To provide a sense of the
ference speed, measured in frames per second (FPS) using a
                                                                               error distribution, of the 24 errors on the D2 test set, two
batch size of 1, was inversely correlated with the input size,
                                                                               errors were caused by occluded calibration points, three er-
but the system still achieved real-time speeds greater than
                                                                               rors were caused by incorrect scoring, and the remaining
30 FPS using the maximum input size of 800.
                                                                               errors were undetected darts due to occlusion.
Transfer Learning. To investigate whether the knowledge
learned from one dartboard can be transferred to another,                      7. Conclusion
N was initialized with the weights learned on D1 and then
                                                                                   We introduce DeepDarts, a system for predicting dart
trained on D2 . The effect of initializing with ImageNet [12]
                                                                               scores from a single image taken from any camera an-
weights was also tested. These experiments were run on two
                                                                               gle. DeepDarts leverages a deep convolutional neural net-
GPUs and the hyperparameters were consistent with those
                                                                               work to detect dartboard keypoints in a new deep learning-
in the base case of the data augmentation experiments. The
                                                                               based approach to keypoint detection in which keypoints are
results are reported in Table 2. ImageNet pretraining im-
                                                                               modeled as objects. Our experiments demonstrate that our
proved the PCS on both datasets despite a marked dissim-
                                                                               method can predict dart scores precisely and generalizes to
ilarity between the two tasks. When transferring the D1
                                                                               various camera angles. In one dataset, the system predicted
weights, it was found that the weights from all but the fi-
                                                                               the correct total score in 94.7% of the test images. In fu-
nal convolutional layer should be transferred for effective
                                                                               ture work, DeepDarts should be trained on a larger dataset
training. The D1 weights provided an improvement of 10.0
                                                                               containing a greater variety of dartboard images to enable
PCS on D2 , indicating a successful transfer of knowledge
                                                                               in the wild deployment.
between the two independent dartboard setups.
                                                                               Acknowledgements. We acknowledge financial support
6.3. Final Training Configurations and Test Results                            from the Canada Research Chairs Program and the Natu-
   To maximize accuracy, N was trained for 100 epochs on                       ral Sciences and Engineering Research Council of Canada
each dataset using an input size of 800, a keypoint bounding                   (NSERC). We also acknowledge the TensorFlow Research
box size of 2.5%, and a combination of data augmentations.                     Cloud Program, an NVIDIA GPU Grant, and Compute
The overall probability of data augmentation was set to 0.8,                   Canada for hardware support.
References                                                           [20] Namdar Homayounfar, Sanja Fidler, and Raquel Urtasun.
                                                                          Sports field localization via deep structured models. In
 [1] Faizan Ali and Atif Bin Mansoor. Computer vision based               CVPR, 2017. 1
     automatic scoring of shooting targets. In INMIC, 2008. 2
                                                                     [21] Weiting Huang, Pengfei Ren, Jingyu Wang, Qi Qi, and
 [2] Adria Arbues-Sanguesa, Adrian Martin, Javier Fernández,             Haifeng Sun. Awr: Adaptive weighting regression for 3d
     Coloma Ballester, and Gloria Haro. Using player’s body-              hand pose estimation. In AAAI, 2020. 2
     orientation to model pass feasibility in soccer. In CVSports,
                                                                     [22] Umar Iqbal, Pavlo Molchanov, Thomas Breuel Juergen Gall,
     2020. 1
                                                                          and Jan Kautz. Hand pose estimation via latent 2.5 d heatmap
 [3] Peb Ruswono Aryan. Vision based automatic target scoring             regression. In ECCV, 2018. 2
     system for mobile shooting range. In ICACSIS, 2012. 2           [23] Diederik P Kingma and Jimmy Ba. Adam: A method for
 [4] Alexey Bochkovskiy, Chien-Yao Wang, and Hong-                        stochastic optimization. arXiv preprint arXiv:1412.6980,
     Yuan Mark Liao. Yolov4: Optimal speed and accuracy of                2014. 7
     object detection. arXiv preprint arXiv:2004.10934, 2020. 3,     [24] Tsung-Yi Lin, Priya Goyal, Ross Girshick, Kaiming He, and
     4, 7                                                                 Piotr Dollár. Focal loss for dense object detection. In ICCV,
 [5] Lewis Bridgeman, Marco Volino, Jean-Yves Guillemaut,                 2017. 3
     and Adrian Hilton. Multi-person 3d pose estimation and          [25] Wei Liu, Dragomir Anguelov, Dumitru Erhan, Christian
     tracking in sports. In CVSports, 2019. 1                             Szegedy, Scott Reed, Cheng-Yang Fu, and Alexander C
 [6] Zixi Cai, Helmut Neher, Kanav Vats, David A Clausi, and              Berg. Ssd: Single shot multibox detector. In ECCV, 2016. 3
     John Zelek. Temporal hockey action recognition via pose         [26] Ilya Loshchilov and Frank Hutter. SGDR: Stochastic gradi-
     and optical flows. In CVSports, 2019. 1                              ent descent with warm restarts. In ICLR, 2017. 7
 [7] Zhaowei Cai and Nuno Vasconcelos. Cascade R-CNN: Delv-          [27] William McNally, Kanav Vats, Tyler Pinto, Chris Dulhanty,
     ing into high quality object detection. In CVPR, 2018. 3             John McPhee, and Alexander Wong. Golfdb: A video
 [8] Zhe Cao, Tomas Simon, Shih-En Wei, and Yaser Sheikh.                 database for golf swing sequencing. In CVSports, 2019. 1
     Realtime multi-person 2d pose estimation using part affinity    [28] William McNally, Kanav Vats, Alexander Wong, and John
     fields. In CVPR, 2017. 2, 3                                          McPhee. Evopose2d: Pushing the boundaries of 2d hu-
 [9] Yilun Chen, Zhicheng Wang, Yuxiang Peng, Zhiqiang                    man pose estimation using neuroevolution. arXiv preprint
     Zhang, Gang Yu, and Jian Sun. Cascaded pyramid network               arXiv:2011.08446, 2020. 2
     for multi-person pose estimation. In CVPR, 2018. 2              [29] Mahdiar Nekoui, Fidel Omar Tito Cruz, and Li Cheng. Fal-
[10] Bowen Cheng, Bin Xiao, Jingdong Wang, Honghui Shi,                   cons: Fast learner-grader for contorted poses in sports. In
     Thomas S Huang, and Lei Zhang. HigherHRNet: Scale-                   CVSports, 2020. 1
     aware representation learning for bottom-up human pose es-      [30] Alejandro Newell, Kaiyu Yang, and Jia Deng. Stacked hour-
     timation. In CVPR, 2020. 2                                           glass networks for human pose estimation. In ECCV, 2016.
[11] Anthony Cioppa, Adrien Deliege, Noor Ul Huda, Rikke                  2
     Gade, Marc Van Droogenbroeck, and Thomas B Moeslund.            [31] R. M. Parag. Sequential recognition and scoring of archery
     Multimodal and multiview distillation for real-time player           shots. Master’s thesis, 2017. 2
     detection on a football field. In CVSports, 2020. 1             [32] Joseph Redmon, Santosh Divvala, Ross Girshick, and Ali
[12] Jia Deng, Wei Dong, Richard Socher, Li-Jia Li, Kai Li,               Farhadi. You only look once: Unified, real-time object de-
     and Li Fei-Fei. Imagenet: A large-scale hierarchical image           tection. In CVPR, 2016. 3
     database. In CVPR, 2009. 8                                      [33] Joseph Redmon and Ali Farhadi. Yolo9000: better, faster,
[13] Penghua Ding, Xuewu Zhang, Xinnan Fan, and Qianqian                  stronger. In CVPR, 2017. 3
     Cheng. Design of automatic target-scoring system of shoot-      [34] Joseph Redmon and Ali Farhadi. Yolov3: An incremental
     ing game based on computer vision. In ICAL, 2009. 2                  improvement. arXiv preprint arXiv:1804.02767, 2018. 3
[14] Xuanyi Dong, Yan Yan, Wanli Ouyang, and Yi Yang. Style          [35] Shaoqing Ren, Kaiming He, Ross Girshick, and Jian Sun.
     aggregated network for facial landmark detection. In CVPR,           Faster R-CNN: Towards real-time object detection with re-
     2018. 2                                                              gion proposal networks. arXiv preprint arXiv:1506.01497,
[15] Silvio Giancola, Mohieddine Amine, Tarek Dghaily, and                2015. 3
     Bernard Ghanem. Soccernet: A scalable dataset for action        [36] Vito Reno, Nicola Mosca, Roberto Marani, Massimiliano
     spotting in soccer videos. In CVSports, 2018. 1                      Nitti, Tiziana D’Orazio, and Ettore Stella. Convolutional
[16] Ross Girshick. Fast R-CNN. In ICCV, 2015. 3                          neural networks based ball detection in tennis games. In
[17] Ross Girshick, Jeff Donahue, Trevor Darrell, and Jitendra            CVSports, 2018. 1
     Malik. Rich feature hierarchies for accurate object detection   [37] Ryan Sanford, Siavash Gorji, Luiz G Hafemann, Bahareh
     and semantic segmentation. In CVPR, 2014. 3                          Pourbabaee, and Mehrsan Javan. Group activity detection
[18] R. I. Hartley and A. Zisserman. Multiple View Geometry               from trajectory and video data in soccer. In CVSports, 2020.
     in Computer Vision. Cambridge University Press, ISBN:                1
     0521540518, second edition, 2004. 4                             [38] Ke Sun, Bin Xiao, Dong Liu, and Jingdong Wang. Deep
[19] Kaiming He, Georgia Gkioxari, Piotr Dollár, and Ross Gir-           high-resolution representation learning for human pose esti-
     shick. Mask R-CNN. In ICCV, 2017. 3                                  mation. In CVPR, 2019. 2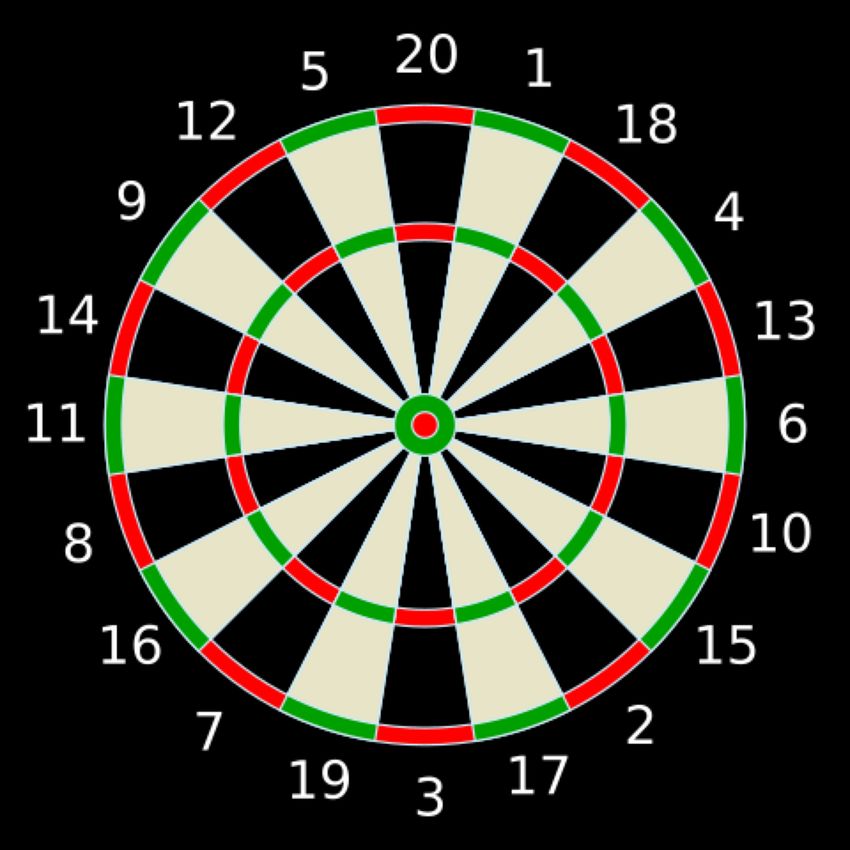
[39] Marcus Thaler and Werner Bailer. Real-time person detec-
     tion and tracking in panoramic video. In CVSports, 2013.
     1
[40] Jonathan J Tompson, Arjun Jain, Yann LeCun, and Christoph
     Bregler. Joint training of a convolutional network and a
     graphical model for human pose estimation. In NeurIPS,
     2014. 2
[41] Alexander Toshev and Christian Szegedy. Deeppose: Human
     pose estimation via deep neural networks. In CVPR, 2014. 2
[42] Mohib Ullah and Faouzi Alaya Cheikh. A directed sparse
     graphical model for multi-target tracking. In CVSports,
     2018. 1
[43] Kanav Vats, Mehrnaz Fani, Pascale Walters, David A Clausi,
     and John Zelek. Event detection in coarsely annotated sports
     videos via parallel multi-receptive field 1d convolutions. In
     CVSports, 2020. 1
[44] Kanav Vats, William McNally, Chris Dulhanty, Zhong Qiu
     Lin, David A Clausi, and John Zelek. Pucknet: Estimating
     hockey puck location from broadcast video. In AAAI Work-
     shops, 2019. 1
[45] Roman Voeikov, Nikolay Falaleev, and Ruslan Baikulov.
     Ttnet: Real-time temporal and spatial video analysis of ta-
     ble tennis. In CVSports, 2020. 1
[46] Chien-Yao Wang, Alexey Bochkovskiy, and Hong-
     Yuan Mark Liao. Scaled-yolov4: Scaling cross stage partial
     network. arXiv preprint arXiv:2011.08036, 2020. 3, 4, 7
[47] Bin Xiao, Haiping Wu, and Yichen Wei. Simple baselines
     for human pose estimation and tracking. In ECCV, 2018. 2
[48] Zhong-Qiu Zhao, Peng Zheng, Shou-tao Xu, and Xin-
     dong Wu. Object detection with deep learning: A review.
     IEEE transactions on neural networks and learning systems,
     30(11):3212–3232, 2019. 2
[49] Zhaohui Zheng, Ping Wang, Wei Liu, Jinze Li, Rongguang
     Ye, and Dongwei Ren. Distance-iou loss: Faster and better
     learning for bounding box regression. In AAAI, 2020. 7
[50] Xingyi Zhou, Dequan Wang, and Philipp Krähenbühl. Ob-
     jects as points. arXiv preprint arXiv:1904.07850, 2019. 3
[51] Thi Thi Zin, Ikuo Oka, Takuya Sasayama, Shingo Ata, Hi-
     toshi Watanabe, and Hiroshi Sasano. Image processing ap-
     proach to automatic scoring system for archery targets. In
     IIH-MSP, 2013. 2
You can also read