Design and Characterization of a New Quercus Suber-Based Pickering Emulsion for Topical Application - MDPI
←
→
Page content transcription
If your browser does not render page correctly, please read the page content below
pharmaceutics

Article
Design and Characterization of a New Quercus
Suber-Based Pickering Emulsion for
Topical Application
Catarina Carriço 1 , Pedro Pinto 1,2 , Angélica Graça 1 , Lídia Maria Gonçalves 1 ,
Helena Margarida Ribeiro 1 and Joana Marto 1, *
 1   Research Institute for Medicine (iMed.ULisboa), Faculty of Pharmacy, Universidade de Lisboa,
     1649-003 Lisbon, Portugal; catarinaalmeidacarrico@gmail.com (C.C.); geral@phdtrials.com (P.P.);
     angelicagraca@campus.ul.pt (A.G.); lgoncalves@ff.ulisboa.pt (L.M.G.); hribeiro@campus.ul.pt (H.M.R.)
 2   PhD Trials, Rua das Murtas, nº1B, 1º, 1700-309 Lisboa, Portugal
 *   Correspondence: jmmarto@ff.ulisboa.pt; Tel.: +351-(217)-946-400

 Received: 20 February 2019; Accepted: 15 March 2019; Published: 19 March 2019

 Abstract: Quercus Suber Bark from Quercus suber L. is a natural, renewable and biodegradable
 biomaterial with multifunctional proprieties. In this study, we used it as solid particles to stabilize
 a Pickering emulsion. The main goal was to produce an optimized topical formulation using
 biocompatible organic particles as stabilizers of the emulsion instead of the common surfactants,
 whilst benefiting from Quercus suber L. proprieties. In this work, a Quality by Design (QbD) approach
 was successfully applied to the production of this emulsion. A screening design was conducted,
 identifying the critical variables of the formula and process, affecting the critical quality attributes of
 the emulsion (droplet size distribution). The optimization of the production was made through the
 establishment of the design space. The stability was also investigated during 30 days, demonstrating
 that Quercus Suber Bark-stabilized emulsions are stable since the droplet size distribution lowers.
 In vitro studies were performed to assess antioxidant and antiaging efficacy, which revealed that the
 formulation had indeed antioxidant proprieties. A physicochemical characterization demonstrated
 that the formulation presents a shear-thinning fluid, ideal for topical administration. The in vivo
 compatibility study confirmed that the final formulation is not skin irritant, being safe for human
 use. A sensorial analysis was also performed, using a simple sensory questionnaire, revealing very
 positive results. Thus, the use of Quercus Suber Bark particles as a multifunctional solid ingredient
 contributed to achieve a stable, effective and innovative Pickering emulsion with a meaningful
 synergistic protection against oxidative stress.

 Keywords: Quercus suber L.; Quercus Suber Bark particles; Pickering emulsion; anti-oxidant activity;
 Quality by Design approach

1. Introduction
     Emulsions are thermodynamically unstable, their study and development being some of the
most difficult and complex subjects in the pharmaceutical and cosmetic fields. Emulsions emerge as a
good solution for topical drug delivery. Its main interest is to encapsulate a hydrophilic or lipophilic
active molecule inside the dispersed phase, ensuring its protection against environmental stress and
degradation and allowing its controlled delivery [1–3].
     Emulsions are most commonly stabilized by synthetic surfactants, some of which can even raise
environmental issues and be intrinsically toxic [3,4].
     Pickering emulsions, on the other hand, are surfactant-free liquid or semi-solid systems stabilized
by solid particles. Consequently, these solid-stabilized emulsions constitute an interesting alternative

Pharmaceutics 2019, 11, 131; doi:10.3390/pharmaceutics11030131           www.mdpi.com/journal/pharmaceutics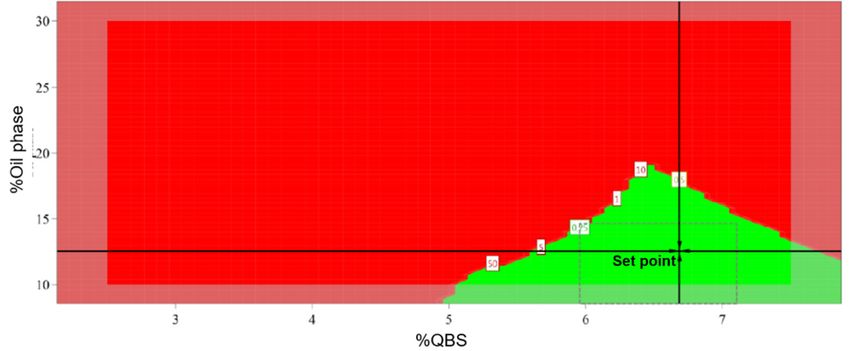
Pharmaceutics 2019, 11, 131                                                                           2 of 16

strategy for encapsulating drugs in topical pharmaceutical formulations [5]. This type of emulsion
was named after Spencer U. Pickering, whose paper first described the phenomenon in 1907.
This stabilization of emulsion droplets is due to particle’s dual wettability: partial wetting of the surface
of the solid particles by water and oil is the origin of the strong anchoring of these particles at the
oil–water interface [6,7]. Wettability allows the spontaneous accumulation of particles at the mentioned
interface, which is stabilized against coalescence by volume exclusion and steric hindrance [8].
     In these emulsions, one of the liquids will wet the solid particles more than the other. The liquid
with the poorest wetting properties is considered the disperse phase. The type of emulsion is
determined by the contact angle (θ) between the particle and the interface, which quantifies the
wettability of the particles at the oil–water interface. Contact angles lower than 90◦ give rise to o/w
emulsions while contact angles higher than 90◦ favour w/o emulsions. However, if the particles
have very high contact angles (too lipophilic) or very low ones (too hydrophilic), they will tend to be
dispersed in either the oil or aqueous phases, respectively, leading to very unstable emulsions [1].
     The effectiveness of the solid particles in acting as Pickering emulsion stabilizers depends on
particle size, shape, concentration, wettability and interactions between particles. The particles
should be substantially smaller than the targeted emulsion droplet size. In addition, small sized
particles have the advantage of reducing the amount required to stabilize a given emulsion droplet
interface [1,8,9]. Various types of solid particles can be used in Pickering emulsions including organic,
such as polymer latex or starch, or inorganic, such as silica, titanium dioxide and clay particles.
Nowadays, novel delivery systems such as nanoparticles and cyclodextrins (CD) are also being studied
and developed [7,10,11].
     The most common particle stabilized emulsion systems tested today are based on inorganic
particles. There is a wide range of commercially available particle sizes (from a few nanometers to several
microns), surface areas, and adjustable hydrophobicity (improved by changing the particle coating,
the extent of chemical modifications, or the degree of substitution by functional groups). Different
types of inorganic-based particles have been successfully used and recognized as efficient stabilizers for
topical Pickering emulsions, such as silica and Titanium dioxide (TiO2 ), among others [9,10,12].
     Presently, there is a strong market trend towards the formulation of green and natural
products, creating a huge variety of pharmaceuticals and cosmetics. This motivates companies
to develop particles based on material derived from plants or microorganisms, that is, renewable
resources, meeting the demand for more eco-friendly products. The biocompatibility and the
environment-friendly characteristic of organic particles constitute a great advance in healthcare and
pharmaceutical products [13,14]. Starch and CDs are some of the new sources of particles used for
stabilizing Pickering emulsions [5,6].
     Surprisingly, another type of organic material that can be used as a Pickering emulsion stabilizer
is Quercus Suber Bark (QSB), more commonly known as Cork. Cork is a natural material obtained
from the outer bark of Quercus suber L. Cork is a lightweight material with other characteristic such as
being impermeable to liquids, a good thermal insulator, resistant to microbial activity and presents a
high friction coefficient [15]. It is a renewable and biodegradable raw bioresource concentrated mainly
in the Mediterranean region [16]. It consists essentially of suberin, lignin and cellulose, containing also
a small amount of extractives, fatty acids, terpenes, long chain aliphatic compounds and saccharides.
The presence of several extractable phenolic acids was also identified.
     The interest on these natural phenolic compounds relies on the wide variety of relevant properties
shown by this family, namely, their antioxidant, anti-inflammatory, radical scavenger and antimicrobial
properties. Several studies prove that the extracts obtained from QSB have in fact anti-oxidant,
anti-ageing, anti-inflammatory and anti-fungal properties all from a naturally occurring and sustainable
material [15].
     This heterogeneity of chemical composition and its extraordinary properties make QSB a material
with a lot of potential and considerable importance in several industries [17,18]. Moreover, like other
natural compounds, they do not show many of the adverse effects frequently shown by their synthetic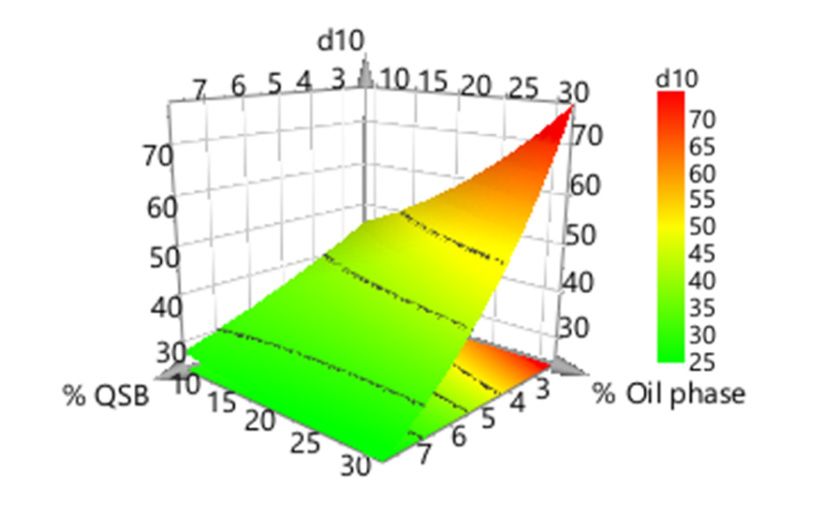
Pharmaceutics 2019, 11, 131                                                                          3 of 16

counterparts. Altogether, this justifies the considerable growing interest on its use for pharmaceutical,
nutraceutical and cosmetic applications [15,17,19,20].
      The aim of this work was to develop and optimize an emulsion stabilized by QSB particles,
meeting the demands of the consumers for green and natural products, using biocompatible organic
particles in Pickering emulsions for high skin compatibility, whilst profiting from QSB proprieties such
as antioxidant and antiaging capacity. The physicochemical stability, namely, droplet size distribution,
of such emulsions was assessed. The in vitro efficacy was also studied, in particular the antioxidant
activity, using HaCat cell cultures and antiaging capacity. In vivo safety and compatility properties of
the final formulation, including the Human Repeat Insult Patch Test (HRIPT) were also evaluated.

2. Materials and Methods

2.1. Materials
     Quercus Suber Bark (PureCork B 100) (QSB) was obtained from Amorim Cork Composites (Santa
Maria da Feira, Portugal). The oils used were Liquid Paraffin obtained from António M. S. Cruz,
Material de Laboratório, Lda. (Lisbon, Portugal), caprylic/capric acid triglyceride (Tegosoft®CT)
(CT), phenoxyethyl caprylate (Tegosoft®XC) (XC), dimethicone (Abil®350) and cetyl dimethicone
(Abil®Wax 9840), the last four a kind gift from Evonik Industries AG (Essen, Germany). 1,2-Hexanediol
(Dermosoft®Hexiol) were obtained from Dr. Straetmans (Hamburg, Germany). Sodium acrylates
copolymer (and) Lecithin (Lecigel™) were obtained from Lucas Meyer Cosmetics (Champlan, France).
Purified water was obtained by reverse osmosis and electrodeionization (Millipore, Elix 3) being
afterwards filtered (pore 0.22 µm). 20 ,70 -dichlorodihydrofluorescein diacetate (H2-DCFDA) was from
Life Technologies (Carlsbad, CA, EUA), and spontaneously immortalized human keratinocyte cell
lines HaCaT (CLS, Eppelheim, Germany) were used for antioxidant activity and cytotoxicity assays
with cells.

2.2. Methods

2.2.1. Quercus Suber Bark (QSB) Particle Size Distribution
     Particle size distribution was determined using a Malvern Mastersizer 2000 (Malvern Instruments,
Malvern, UK), coupled with a Hydro S accessory. The refractive index used was 1.52 (default). For a
correct turbidity, corresponding to an obscuration between 10–20%, the sample was added to the
chamber containing purified water. The readings were performed under mechanical stirring (1750 rpm)
and ultrasounds (25%). Data was expressed in terms of relative distribution of volume of particles in
the range of size classes, and given as diameter values corresponding to percentiles of 10, 50 and 90.
The Span value is a useful statistical parameter to characterize the particle size distribution, and it was
calculated using Equation [5]:
                                                  d(90) − d(10)
                                          Span =                                                         (1)
                                                      d(50)

2.2.2. Wettability Measurements of QSB Particles
     The contact angles of the samples were measured by means of the Wilhelmy plate technique,
using a Tensiometer K12 (Krüss GmbH, Hamburg, Germany). For applying this technique, a rectangle
shape substrate coated with a double-side tape (20 × 20 mm) was used and the powder was coated
onto its surface. It was ensured that the tape was uniformly coated with powder so that there was
no tape exposed. The solid sample (QSB particles) was hung perpendicular to the liquid surface.
Five different liquids were used: water, caprylic/capric acid triglyceride (CT), phenoxyethyl caprylate
(XC), dimethicone and cetyl dimethicone. Each liquid was placed in a clean glass dish and raised
by means of a motorized platform to contact with the powder plate. The platform was raised at
the speed of 6 mm/min and the submersion distance was 2 mm. The volume of liquid used for the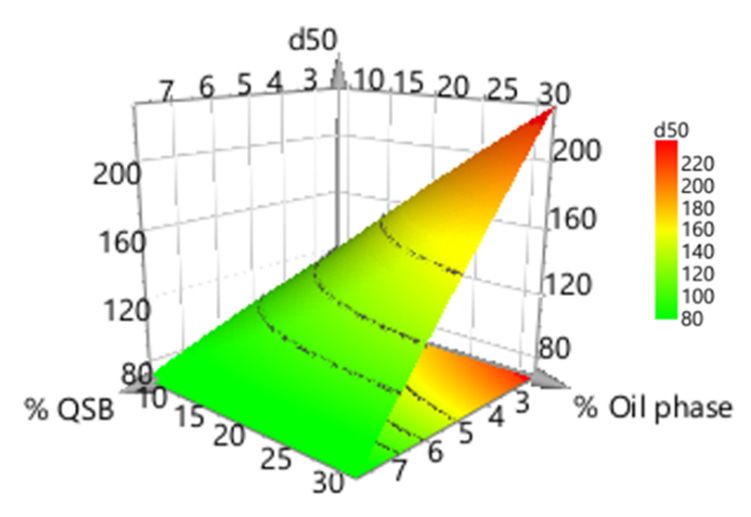
Pharmaceutics 2019, 11, 131                                                                          4 of 16

contact-angle measurements was ca. 50 cm3 . The contact angle was calculated from the measured
force by transposing the Wilhelmy equation using Krüss Laboratory Desktop Software (version 3.2,
Krüss GmbH, Hamburg, Germany).

2.2.3. Preparation and Characterization of Emulsions Stabilized by QSB Particles
    QSB particles were firstly dispersed in the caprylic/capric acid triglyceride. The oil and aqueous
phases were then mixed using an UltraTurrax®homogenizer (IKA-Werke GmbH & Co. KG, Staufen,
Germany) at 12,000 rpm during 5 min at room temperature (cold process). Using a light microscope
(Olympus BX51, Shinjuku, Japan) with 10× objectives with normal light, we verified the existence and
shape of the emulsions’ droplets.

2.2.4. Droplet Size Analysis
     The size distribution of the emulsions’ droplets was determined using the same method described
in Section 2.2.1. In order to achieve an acceptable turbidity, each sample, corresponding to an
obscuration between 10–20 %, was added to the sample chamber containing filtered purified water
using a stirrer at 700 rpm during 30 s.

2.2.5. Optimization Studies

Identification of Quality Target Product Profile (QTPP) and Critical Quality Attributes (CQAs)
      The first and most important element when using the QbD approach to assist formulation and
process design is to pre-define the desired final QTPP (Table 1). The QTPP describes the product
quality and forms the basis for defining the CQAs and critical process parameters (CPPs). The first step
is to define the desired QTPP, which depends on scientific, regulatory and practical considerations and
previous work. One of the important features of an emulsion is its droplet size distribution, namely,
d(10), d(50), d(90) and span, because it influences other important characteristics such as rheology
and stability.

                                          Table 1. QTPP of QSB-stabilized emulsions.

                         QTPP Element                             Target                 Reference
                    Route of administration                       Topical                  [21]
                                                       Emulsion (Pickering emulsion)        [5]
                                                         Droplet size distribution:
                          Dosage form                       d(10)—30–50 µm
                                                           d(50)—100–150 µm                 [5]
                                                           d(90)—130–190 µm
                                                             Span—1.5–1.9
                              Stability                 Without separation of phases        [5]
                                                         Efficacy: Anti-oxidant and
                         In vitro studies                   anti-elastase activity         [15]
                                                         Safety: Cytotoxicity assay
                                                       Skin biocompatibility: Human
                         In vivo studies                                                   [22]
                                                      repeat insult patch test (HRIPT)

2.2.6. Risk Analysis of CQAs
     The first step in the risk assessment was to gather all the possible factors that could influence
product quality. For this purpose, the identification of critical variables and the levels used in
DoE were based on the literature and previous work. With the information collected, Ishikawa
diagrams were constructed to identify the potential risks associated to emulsion stability as well as the
process parameters, identifying the CQAs that have the greatest chance of generating product failure.
Pharmaceutics 2019, 11, 131 5 of 16
The droplet size was defined and further delineated to identify potential risks and after the analysis;
two variables were identified for optimization in the following studies.
2.2.7. Design of Experiments (DoE)
The formula of the emulsions was optimized using a two-factor Central Composite Design (CCD).
The independent variables for the process optimization had already been studied in previous work [5]
and were not, for that reason, analysed here. For the formula optimization, the percentage of oil phase
and the percentage of QSB particles were the independent variables analyzed.
To investigate the variables affecting the responses studied, we used a central composite design
composed of five levels, coded as −α, −1, 0, 1, and +α, for the formula with CT as the oil phase.
The value for alpha (1.147) was chosen in order to ensure design rotability.
This design required 11 experimental runs (Table 2) with three replicated centre points for more
uniform estimate of the prediction variance over the entire design space. The data was analysed
using the MODDE®Pro 11 software (Umetrics, Umeå, Sweden) and statistical analysis was considered
significant when the estimated p-values were lower than an α error of 0.05.
Table 2. Design of experiments (QSB-stabilized emulsion optimization).
Design Matrix Experimental Matrix for Formula Optimization
Exp Name Run Order
QSB Oil phase %QSB %Oil phase % Aq. Phase
N1 1 −1 −1 2.50 10.00 87.50
N2 6 1 −1 7.50 10.00 82.50
N3 11 −1 1 2.50 30.00 67.50
N4 9 1 1 7.50 30.00 62.50
N5 7 −1.14744 0 2.13 20.00 77.87
N6 10 1.14744 0 7.87 20.00 72.13
N7 2 0 −1.14744 5.00 8.53 86.47
N8 8 0 1.14744 5.00 31.47 63.53
N9 3 0 0 5.00 20.00 75.00
N10 4 0 0 5.00 20.00 75.00
N11 5 0 0 5.00 20.00 75.00
Then, the response was studied, which means the droplet size distribution of all 11 experimental
runs. The size distribution of the emulsions’ droplets was measured by light scattering using a Malvern
Mastersizer 2000 (Malvern Instruments, Worcestershire, UK) coupled with a Hydro S accessory as
previously detailed (Section 2.2.1.).
2.2.8. Stability Assessment of Optimized Formulation
Based on the QbD approach, an optimized formulation stabilized by QSB particles (QSB-stabilized
emulsion) was created. To assess the stability of this optimized formulation, 3 batches with the same
conditions were prepared and their respective droplet size distribution measured at different times,
for 1 month (0, 14 and 30 days).
2.2.9. In Vitro Studies
Cytotoxicity Assay
The cytotoxicity was evaluated using general cell viability endpoint MTT reduction
(3-(4,5-dimethyl-2-thiazolyl)-2,5-diphenyl-2H-tetrazolium bromide) assay. Cell viability was assessed
after 24 h of incubation of a spontaneously immortalized human keratinocyte cell line HaCaT (CLS,Pharmaceutics 2019, 11, 131 6 of 16
Eppelheim, Germany) with different concentrations of QSB-stabilized emulsion (100 µg/mL to
1 µg/mL) and the procedure was performed according a previous published work [6].
Anti-Oxidant Activity
The intracellular production of reactive oxygen species (ROS) within cells was evaluated
with a fluorimetric technique using 2,7’ dichlorodihydrofluorescein diacetate (H2-DCFDA).
HaCaT sub-confluent cells grown in 96 well plates were incubated for 30 min with 20 µM of H2-DCFDA
in the dark, at 37 ◦ C and the procedure was performed according a previous published work [23].
Data from 12 replicates was reported as relative fluorescence units (RFU) percentage and expressed as
a mean fluorescence ratio (fluorescence of exposed cells/fluorescence of unexposed control from the
same experiment). The normal cell medium was used as negative control and ascorbic acid (AA) was
used as positive control. These results were reported as the mean ± standard deviation.
Enzymatic Inhibition Assay
Fluorometric assays for the QSB-stabilized emulsion inhibition activity were carried out in 200 µL
assay buffer (0.1 M HEPES pH 7.5 at 25 ◦ C) containing 20 µL of 0.17 µM HNE (stock solution 1.7 µM
in 0.05 M acetate buffer, pH 5.5), 155 µL of assay buffer and 5 µL of each concentration of tested
inhibitors. After 30 min of incubation at 25 ◦ C, the reaction was initiated by the addition of 20 µL
of fluorogenic substrate to a final concentration of 200 µM (MeO-Suc-Ala-Ala-Pro-Val-AMC, Merck,
Darmstadt, Germany). The Michaelis–Menten constant (Km ) of this substrate of HNE was previously
determined to be 185 µM (data not shown). For all assays, saturated substrate concentration was used,
throughout, in order to obtain linear fluorescence curves. Controls were performed using enzyme
alone, substrate alone, enzyme with DMSO and a positive control (Sivelestat sodium salt hydrate,
Sigma Aldrich, St. Louis, MO, EUA) [23].
2.2.10. Physicochemical Characterization
The pH measurements were performed with the pH-meter (S20 Seven easy pH, Mettler Toledo,
Columbus, OH, EUA) and the data collected after 5 min at room temperature. Six replicates of the
measurements were performed for the emulsion.
The apparent viscosity and rheological profile of QSB-FF were evaluated at room temperature,
using a Brookfield Rotation Viscosimeter®, RV DV-II, SSA with a spindle 07 (Brookfield Engineering
Laboratories, Middleboro, MA, USA ) immersed into the sample of the emulsion. The shear rate [1/s]
versus shear stress [Pa] plots (flow curves) were obtained by submitting the samples to a shear rate
sweep from 12.24 to 122/s up (ascent curve) and down (descent curve). This means that the angular
velocities varied from 10 rpm to 100 rpm and each one was read after 30 s, and then reversed the
velocity to the initial.
2.2.11. In Vivo Compatibility and Sensorial Studies
Human Repeat Insult Patch Test (HRIPT)
A safety evaluation study (Ref. 4971216.L, 01/2017) was performed on the QSB-stabilized
emulsion, using the Marzully and Maibach [24] HRIPT protocol. Briefly, the product was applied on
the back of 51 healthy volunteers that gave their prior informed written consent. For the induction
period, a series of nine patches (Finn Chamber standard) were performed over a period of 3 weeks.
Reactions after patching were scored according to International Contact Dermatitis Research Group.
The results are expressed in score of skin irritation, calculated from the “marks” allocated to the visible
signs: erythema, oedema, vesicle, papule (from 1 to 2 or 3) and bulla, scab (2 if presence) which
takes into account the intensity of skin reactions. For each subject (and for each observation time),
an individual daily irritation score was calculated: sum of all the marks obtained for the observed
signs. A 2 week-rest period was maintained without application of the test emulsion. During thePharmaceutics 2019, 11, 131 7 of 16
challenge period, new patches were prepared and fixed in the same manner as in the induction period,
Pharmaceutics
but also on2019, 11, x FOR
the right PEER
side REVIEW
of the back(i.e., a virgin site). 7 of 16
The protocol was approved by the local Ethical Committee (MS/2017/4457/P22315) and respected
cosmetic products.
the Helsinki The study
Declaration and thewas conducted
AFSSAPS under the
regulations supervisionHRIPT
on performed of a studies
dermatologist who
on cosmetic
participated
products. The instudy
the evaluation of irritation/allergic
was conducted reactionsoftoathe
under the supervision emulsions. who participated in the
dermatologist
evaluation of irritation/allergic reactions to the emulsions.
2.2.11.2. Sensorial Analysis
Sensorial Analysis
Thirty-eight volunteers were questioned to scale characteristics of the QSB-stabilized emulsion.
An inquiry was presented
Thirty-eight volunteers to them and each volunteer
were questioned answered a fewofquestions
to scale characteristics about the emulsion
the QSB-stabilized emulsion.
sensory attributes, such as fragrance, consistency and stickiness, skin feel during application
An inquiry was presented to them and each volunteer answered a few questions about the emulsion (ease of
application, spreadability
sensory attributes, such asand oiliness),
fragrance, skin feel after
consistency andapplication (hydration,
stickiness, skin softness
feel during of the skin
application and
(ease of
freshness) and the willingness to buy the product. Responses were given in a scale from
application, spreadability and oiliness), skin feel after application (hydration, softness of the skin and 1 to 4.
Sensory parameters
freshness) were evaluated
and the willingness to buy by
theapplying a small amount
product. Responses of QSB-stabilized
were given emulsion
in a scale from in the
1 to 4. Sensory
back of theirwere
parameters hands and rubbed
evaluated it into the
by applying skin until
a small amountit totality disappeared.
of QSB-stabilized emulsion in the back of their
hands and rubbed it into the skin until it totality disappeared.
2.2.12. Statistical Analysis
2.2.12. Statistical Analysis
Results are expressed as mean values ± standard deviation (SD). Statistical evaluation of data
Resultsout
was carried are using
expressed as mean
GraphPad values
Prism ± standard
v. 5.02 deviation
(GraphPad (SD).
Software, Statistical
San evaluation
Diego , CA, USA) by of one-
data
was carried
way ANOVA out(Analysis
using GraphPad Prism by
of variance), v. 5.02 (GraphPad
a Tukey’s Software,test
comparison Sanin
Diego, CA,
the in USA)
vitro by one-way
studies, with
ANOVA (Analysis
significance of variance),
set at p-valuesPharmaceutics 2019, 11, 131 8 of 16
3.2. Wettability Measurements of QBS Particles
According to Bancroft Rule, the emulsion type is often related to the preferential solubility of
the emulsifying agent in one of the phases, which means the phase in which the stabilizing agent is
more soluble will be the continuous phase, those preferentially soluble in water stabilize o/w systems
and vice versa [27]. In this surfactant-free system stabilized by solid particles, one of the liquids will
probably wet the solid more than the other liquid, with the more poorly wetting liquid becoming the
disperse phase. The importance of the wettability of the particles at the oil–water interface is quantified
by the contact angle, θ, the angle that the particle makes with it, which will determine the type of
emulsion. If the contact angle, measured through the aqueous phase, is inferior to 90◦ the emulsion will
be o/w and, by contrast, if the contact angle is higher than 90◦ , the emulsion will be w/o. In this case,
it was intended to achieve an o/w emulsion because it is more pleasant cosmetologically speaking.
By the present analysis (Table 3), QSB particles have high wettability in all the oils but especially
in CT, since the contact angles are lower than 30º. The contact angle of the solid particles with water is
higher than 90º, which would indicate that QSB particles will stabilize more effectively w/o emulsions.
Concerning the wettability results, it was concluded that CT was better suited for the oil phase.
Table 3. Contact angle of water, Caprylic/Capric Triglyceride (CT), Phenoxyethyl Caprylate (XC),
Dimethicone and Cetyl Dimethicone with QSB (Quercus Suber Bark) particles (mean ± SD, n = 3).
Contact Angle (θ ◦ )
Particles
Water CT XC Dimethicone Cetyl Dimethicone
QSB 97.3 ± 0.3 0.0 ± 0.0 8.0 ± 2.4 25.2 ± 8.7 10.4 ± 11.8
Cork is a very light raw material; weighing just 0.16 g/cm2 , it is practically impermeable to liquids
and gases, thanks to suberin and ceroids, and it is highly resistant to moisture. Thus, this characteristic
supports cork as a promising material to stabilize w/o Pickering emulsions.
However, there is a phenomenon known as phase inversion by which the dispersed phase
becomes the continuous phase and vice versa, it can be considered a useful route to produce emulsion
made of very fine droplets and it is widely used in fabrication of cosmetic products. Phase inversion
can be brought about by changing the temperature of the system, by changing the volume fraction of
the phases, by adding salts or by imposing particular flows [28]. In this case, the percentage of water
we used for the formulations, relative to the quantity of oil phase, is much larger, which allows the
emulsion to be o/w, reverting from the expected w/o.
3.3. Characterization of Emulsions Stabilized by QSB Particles
Macroscopic observation of the emulsion, after one week, revealed that emulsion was practically
homogeneous and exhibited no separation of phases. The obtained emulsion was o/w type, confirming
the theory described in the previous point. Based on the macro and microscopic observation and on the
droplet size distribution, the oil phase of the emulsion stabilized by QSB particles was selected. CT was
the best choice since it presented the smaller droplet size allied to a very good stability, based on the
macroscopic observation of 2-week and 4-week emulsion, where it presented a homogenous aspect and
no separation of phases (Table 4). In addition, in the microscopic observation of emulsion, the droplets
were clearly visible, small and uniformly shaped.Pharmaceutics 2019, 11, 131 9 of 16
Table 4. Droplet size distribution of QSB-based emulsion.
Droplet Size Distribution (µm)
Batch
Span d10 d50 d90
T 0 days
1 1.6 ± 0.0 33.1 ± 0.2 88.4 ± 1.1 179.2 ± 2.7
2 1.7 ± 0.0 32.0 ± 0.3 87.3 ± 1.0 179.5 ± 2.8
3 1.6 ± 0.0 34.6 ± 0.2 90.7 ± 0.6 182.1 ± 1.3
T 14 days
1 1.7 ± 0.0 30.1 ± 0.1 79.5 ± 0.5 161.2 ± 1.1
2 1.6 ± 0.0 32.3 ± 0.5 82.8 ± 3.2 161.6 ± 6.5
3 1.6 ± 0.0 29.5 ± 0.1 76.7 ± 0.4 153.0 ± 0.7
T 30 days
1.6 ± 0.0
1 PEER REVIEW
Pharmaceutics 2019, 11, x FOR 31.2 ± 0.1 82.90.4 166.3 ± 1.2 9 of 16
2 1.6 ± 0.0 34.5 ± 0.2 91.1 ± 0.6 180.6 ± 1.2
3.4. Optimization Studies
3 1.7 ± 0.0 30.1 ± 0.1 80.9 ± 0.4 164.4 ± 1.3
Risk Analysis of CQAs
3.4. Optimization Studies
Factors potentially affecting the quality attributes of the Pickering emulsions were formulation
Risk Analysis
and process of CQAs
related. Critical variables were identified and the effects of these variables on the droplet
size were studied (Figure 2). Thisthe
Factors potentially affecting screening
quality experimental design
attributes of the has the
Pickering advantage
emulsions of minimizing
were formulation
the number of experiments required to identify the most critical factors affecting the response.
and process related. Critical variables were identified and the effects of these variables on the droplet After
the
size were studied (Figure 2). This screening experimental design has the advantage of minimizingthe
risk analysis and based on the literature and previous work, plus knowledge acquired in the
laboratory
number of during the experiment,
experiments we arrived
required to identify to the
the most conclusion
critical factorsthat the major
affecting CQAs were
the response. After the
the
percentage
risk analysisofand
QSB particles
based on theand the volume
literature of internal
and previous work, phase (percentageacquired
plus knowledge of oil phase)
in the and those
laboratory
were the variables that were studied. The process variables have an impact on
during the experiment, we arrived to the conclusion that the major CQAs were the percentage of QSB product quality;
however, theythe
particles and were optimized
volume previously,
of internal using the same
phase (percentage conditions
of oil phase) and as those
described
wereelsewhere [5]. that
the variables
wereThe amount
studied. Theofprocess
QSB particles used
variables havein an
theimpact
designedon experiments
product quality;washowever,
estimatedtheybased
wereonoptimized
previous
work [5], in which 5% amount of solid particles was selected
previously, using the same conditions as described elsewhere [5]. as the CCD “0” level and 2.5 and 7.5 %
as the “-α” and “α” levels, respectively.
Figure 2. Ishikawa diagram illustrating factors that may have impact on the droplet size of a
Figure 2. Ishikawa diagram illustrating factors that may have impact on the droplet size of a QSB-
QSB-stabilized emulsion [29].
stabilized emulsion [29].
The amount of QSB particles used in the designed experiments was estimated based on previous
3.5.
work Establishment
[5], in whichof5%
Design Space
amount of solid particles was selected as the CCD “0” level and 2.5 and 7.5 % as
the “-α” and “α” levels, respectively.
3.5.1. Response Surface Analysis
The data obtained by the experimental design was analyzed resorting to the MODDE® software
and polynomial models were obtained. An ANOVA was also performed and the p-value was
calculated for each variable. When the p-value found was equal or greater than 0.05, it was assumed
that no significant effect was present. Moreover, the information derived from the models was
expanded graphically by using isoresponsive curves. A good correlation was obtained between the
observed and predicted values as indicated by the R2 value between 0.93 and 0.99 for all variables inPharmaceutics 2019, 11, 131 10 of 16
3.5. Establishment of Design Space
3.5.1. Response Surface Analysis
The data obtained by the experimental design was analyzed resorting to the MODDE®software
and polynomial models were obtained. An ANOVA was also performed and the p-value was calculated
for each variable. When the p-value found was equal or greater than 0.05, it was assumed that no
significant effect was present. Moreover, the information derived from the models was expanded
graphically by using isoresponsive curves. A good correlation was obtained between the observed
and predicted values as indicated by the R2 value between 0.93 and 0.99 for all variables in the
optimization study.
In Table 5, the coefficient column reflects each factor’s relative strength, the higher the absolute,
the greater the effect of that factor on the response.
Table 5. Summary of regression analysis results for measured responses (central composite design),
for formula optimization.
d(10) d(50) d(90) Span
Formula Parameters
Coeff ± SE Coeff ± SE Coeff ± SE Coeff ± SE
K 1.58 0.03 126.27 3.74 255.02 7.61 0.23 0.01
QSB −0.16 0.02 −46.02 2.65 −52.63 5.39 0.09 0.01
Oil NS NS 23.81 2.65 60.74 5.39 0.05 0.01
Oil*Oil NS NS NS NS NS NS NS NS
QSB*QSB NS NS NS NS NS NS 0.06 0.01
Oil*QSB NS NS −22.46 3.41 NS NS 0.07 0.01
Oil—% Oil Phase; QSB—% Quercus Suber Bark particles. Coeff—Coefficient Scaled and centered; SE—Standard
Error; k—Constant; NS (no significant)—p > 0.05.
A positive value indicates an effect that increases the response and a negative value represents
an inverse relationship between the response and the factor. A general interpretation indicates that
although an increase in QSB concentration and a decrease in the oil phase contributed to a narrower
droplet size distribution, the former had a more dominant effect. In what concerns the formula
optimization, the response surface plots are shown in Figure 3.
Considering our formula optimization, the statistically significant variables (p < 0.05) that affected
the droplet size distribution were concentration of QSB particles and volume of oil phase. Indeed,
a negative correlation was observed for the percentage of QSB particles in the dependent variables
d(10), d(50) and d(90), meaning that an increase in the QSB particles amount in the emulsion will result
in a decrease in droplet size. According to several authors, the size of the droplets decreases with
increasing solid particle concentration, leading to the formation of emulsions throughout the entire
mixture volume without any coalescence or phase separation. However, if the droplet size approaches
the size of the solid particles, flow oscillations are induced, leading to droplet break-up and increased
polydispersity [30].
The percentage of oil phase also influenced the droplet size distribution, but with a positive
correlation, which means that, with an increase in percentage of internal phase, the smaller droplets
tend to aggregate, originating larger droplets, that will lead to higher values of droplet size. A positive
correlation was found for Span, respecting both concentration of QSB particles and % of internal phase,
meaning that an increase in QSB or oil phase concentration can lead to a wider droplet size distribution.The percentage of oil phase also influenced the droplet size distribution, but with a positive
correlation, which means that, with an increase in percentage of internal phase, the smaller droplets
tend to aggregate, originating larger droplets, that will lead to higher values of droplet size. A
positive correlation was found for Span, respecting both concentration of QSB particles and % of
Pharmaceutics 2019, 11, 131 11 of 16
internal phase, meaning that an increase in QSB or oil phase concentration can lead to a wider droplet
size distribution.
Pharmaceutics
Pharmaceutics2019, 11,11,
2019, x FOR PEER
x FOR REVIEW
PEER REVIEW 1111
ofof
1616
(a) (b)
(c)(c) (d)
(d)
Figure 3.3.
Figure3. Isoresponse
Isoresponse
Isoresponse curves
curves (graph
curves (graph floor)
(graph floor) and
floor) response
and
and surface
response
response plotsplots
surface
surface of relative
plots size distribution
ofofrelative
relativesize (µm),
sizedistribution
distribution
respectively:
(µm), (a) d(10),
(µm),respectively:
respectively: (b)
(a)(a) d(50),
d(10),
d(10),(b) (c)
(b) d(90)(c)(c)
d(50),
d(50), and (d) and
d(90)
d(90)span, for
and(d) formula
(d)span,
span,for optimization.
forformula % QSB—%
formulaoptimization.
optimization. Quercus
%%QSB—%
QSB—%
Suber Bark
Quercus
Quercus particles.
Suber
SuberBark
Barkparticles.
particles.
3.5.2. Design Space
3.5.2.
3.5.2.Design
DesignSpace
Space
The design space (DS) concept is defined as the multidimensional combination and interaction
The
Thedesign
designspacespace(DS)
(DS)concept
conceptisisdefined
definedasasthe
themultidimensional
multidimensionalcombination
combinationand andinteraction
interaction
of input variables and process parameters that have been demonstrated to provide assurance of
ofofinput
inputvariables
variablesand andprocess
processparameters
parametersthatthathave
havebeen
beendemonstrated
demonstratedtotoprovide
provideassurance
assuranceofof
quality [31]. In this study, response surface methodology was applied to establish the DS. The process
quality
quality[31].
[31].InInthis
thisstudy,
study,response
responsesurface
surfacemethodology
methodologywas wasapplied
appliedtotoestablish
establishthe
theDS.
DS.The
Theprocess
process
key parameters that had been demonstrated to affect emulsions quality were used to construct the DS
key
keyparameters
parametersthat thathad
hadbeen
beendemonstrated
demonstratedtotoaffect
affectemulsions
emulsionsquality
qualitywere
wereused
usedtotoconstruct
constructthe
the
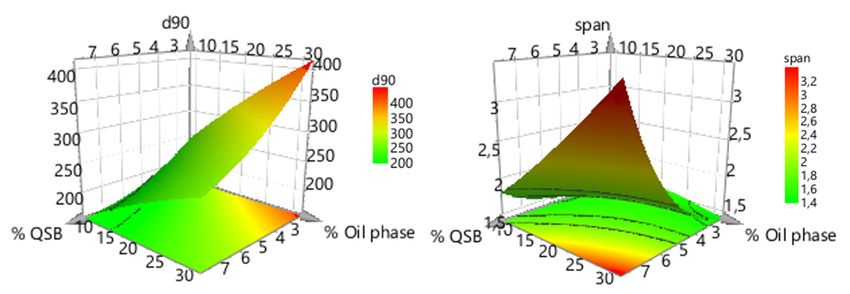
(Figure 4).
DSDS(Figure
(Figure4).4).
Figure 4. Plot evidence the design space for the QSB-based emulsion.
Figure
Figure4.4.Plot
Plotevidence
evidencethe
thedesign
designspace
spacefor
forthe
theQSB-based
QSB-basedemulsion.
emulsion.
Every single point corresponds to a combination of our studied variables. The green area
Every
Everysingle
corresponds single point
point
to a range ofcorresponds
corresponds
combinations totofor
a acombination
combination
which ofofour
the droplet our studied
sizestudied variables.
remains within The
variables. The
the green
greenarea
pre-definedarea
corresponds
corresponds
acceptable to a range
to a(Figure
limits of
range 3). combinations
of combinations for which
for which
This plot provides the
a range droplet
thewithin size
dropletthesizeremains
remains
value within the pre-defined
withinparameter
of a critical the pre-defined
that
acceptable
acceptable
will limits
not affect the(Figure
limits (Figure
final 3).3).This
response,Thisplot
plotprovides
provides
meaning, a arange
as long range within
within
as each the
thevalue
variable valueofofa acritical
is maintained parameter
critical parameter
within that
that
its range,
will not
will notaffect
affect the
thefinal response,
final response, meaning,
meaning, asaslong
long as each
as eachvariable
variableis maintained
is maintained
the droplet size can be successfully predicted and controlled. The DS was established for formula within
within its range,
its range,the
the
droplet
dropletsize
sizecancanbebesuccessfully
successfullypredicted
predictedand andcontrolled.
controlled.The
TheDS DSwas
wasestablished
establishedfor forformula
formula
optimization,
optimization,whichwhichwas wasdelineated
delineatedininthe thegreen
greenregion
regionininFigure
Figure3.3.The
Theoptimal
optimalconditions
conditionsdefined
defined
bybythe DS plot were 12.5% of CT and 6.7% of QSB, as shown in the set point of
the DS plot were 12.5% of CT and 6.7% of QSB, as shown in the set point of the previous figure. the previous figure.
3.6.
3.6.Final
FinalFormulation
FormulationPharmaceutics 2019, 11, 131 12 of 16
optimization, which was delineated in the green region in Figure 3. The optimal conditions defined by
the DS plot were 12.5% of CT and 6.7% of QSB, as shown in the set point of the previous figure.
3.6. Final Formulation
Physicochemical Characterization
The pH value was 5.42 ± 0.01, which is compatible with the pH of the human skin [32].
The viscosity profile of a formulation provides important information about the production,
Pharmaceutics 2019, 11, x FOR PEER REVIEW 12 of 16
processing and performance. Structural differences in the formulations can be inferred from the
flow curves. Rotational shear experiments measure the ability of a system to resist to structural
deformation during the standardized shearing procedure. The flow curves showed that QSB-
deformation during the standardized shearing procedure. The flow curves showed that QSB-stabilized
stabilized emulsion was a non-Newtonian fluid, which means that its viscosity is dependent on the
emulsion was a non-Newtonian fluid, which means that its viscosity is dependent on the shear rate.
shear rate. This emulsion was also characterized as shear thinning fluid, since a nonlinear curve was
This emulsion was also characterized as shear thinning fluid, since a nonlinear curve was obtained
obtained and the apparent viscosity decreased with increased shear rate (shear thinning behaviour)
and the apparent viscosity decreased with increased shear rate (shear thinning behaviour) [33,34].
[33,34].
In addition, the relation between the shear stress and the shear rate was probably also
In addition, the relation between the shear stress and the shear rate was probably also time-
time-dependent, showing a thixotropic behaviour. Considering the time during which this formulation
dependent, showing a thixotropic behaviour. Considering the time during which this formulation
was submitted to different forces, it was possible to verify that the apparent viscosity was not only
was submitted to different forces, it was possible to verify that the apparent viscosity was not only
dependent on the shear rate magnitude, but also on the time of the shear rate application. In this
dependent on the shear rate magnitude, but also on the time of the shear rate application. In this
context, the emulsion exhibited thixotropic behaviour because, observing the down curve of Figure 5,
context, the emulsion exhibited thixotropic behaviour because, observing the down curve of Figure
there is a slow recovery of the microstructure of the fluid to its initial state, taking a measurable time
5, there is a slow recovery of the microstructure of the fluid to its initial state, taking a measurable
for the viscosity to recover [33,35]. As the emulsion behaved as a shear-thinning fluid, it is suitable for
time for the viscosity to recover [33,35]. As the emulsion behaved as a shear-thinning fluid, it is
topical administration.
suitable for topical administration.
Figure 5. Flow curve of the QSB-based emulsion (line—up curve; dot—down curve).
Figure 5. Flow curve of the QSB-based emulsion (line—up curve; dot—down curve).
3.7. Stability Assessment of Optimized Formulation
3.7. Stability Assessment of Optimized Formulation
After preparing the optimized formulation of Pickering emulsion stabilized by QSB particles
After preparing
(QSB-stabilized the optimized
emulsion), formulation
given to us by the DS,ofit Pickering emulsion
was important stabilized
to assess by QSB
its stability particles
to see if the
(QSB-stabilized emulsion),
QSB-stabilized emulsion givenmaintain
would to us by athe DS, it was
cohesive important
structure to assess
and remain its stability
a stable to see
emulsion. if this
For the
QSB-stabilized emulsion would maintain a cohesive structure and remain a stable
purpose, we prepared three batches of QSB-stabilized emulsion and measured their droplet size emulsion. For this
purpose,
throughout wea prepared threewas
month. A plot batches of QSB-stabilized
elaborated to compare the emulsion anddistribution
droplet size measured their droplet
between size
the three
throughout
batches and,ainmonth.
the same A plot was
batch, elaborated
after 14 and 30todays.
compare the droplet size distribution between the
threeAsbatches and, the
expected, in the same
three batch,showed
batches after 14very
andsimilar
30 days.profiles, which means they are reproducible,
sinceAs expected,
they are all the three
from batches showed
QSB-stabilized very similar
emulsion. The profiles, which
curves also meansvery
present theysimilar
are reproducible,
profiles of
since they are all from QSB-stabilized emulsion. The curves also present very similar
droplet size distribution, which means that, over time, the emulsion remained stable, with a cohesive profiles of
droplet size distribution, which means that, over time, the emulsion remained stable,
structure. The more homogeneous the graph looks, the more stable the emulsion is. The droplet size with a cohesive
structure.
distributionTheofmore homogeneous
QSB-stabilized the graph
emulsion can belooks, the as
defined more stable the emulsion
a Normal-Gaussian is. The droplet
distribution. size
Moreover,
distribution of QSB-stabilized emulsion can be defined as a Normal-Gaussian distribution.
a mono-modal distribution was observed, meaning that the emulsions remained stable for at least a Moreover,
amonth
mono-modal
[36]. distribution was observed, meaning that the emulsions remained stable for at least a
month [36].
3.8. In Vitro Studies
3.8.1. Cytotoxicity AssayPharmaceutics 2019, 11, 131 13 of 16
3.8. In Vitro Studies
3.8.1. Cytotoxicity Assay
To predict the potential cytotoxicity of the QSB-stabilized emulsion, cell viability was evaluated
using HaCaT cell line using an MTT assay. The cell viability of QSB-stabilized emulsion was
100.3 ± 6.6%. According to the OECD guideline, an irritant substance is predicted if the mean relative
tissue viability is found below 50% of the mean viability of the negative controls for a 15–60 min
of exposition time [37]. Thus, the QSB-stabilized emulsion can be intended as non-irritant and the
amounts of2019,
Pharmaceutics QSB11,particles used
x FOR PEER can be considered safe.
REVIEW 13 of 16
3.8.2. Anti-Oxidant
3.8.2. Anti-Oxidant and
and Anti-Elastase
Anti-Elastase Activity
Activity
The possible
The possible protective
protectiveeffect
effectofofQSB-stabilized
QSB-stabilizedemulsion
emulsionagainst oxidative
against damage
oxidative damagein HaCaT
in HaCaTcell
lineslines
cell was investigated in vitro.
was investigated The QSB-stabilized
in vitro. emulsion
The QSB-stabilized has shown
emulsion hasanti-oxidant activity (Figure
shown anti-oxidant 6)
activity
and the capacity to inhibit the oxidation of other molecules. This is supported by the knowledge
(Figure 6) and the capacity to inhibit the oxidation of other molecules. This is supported by the of the
existence ofof
knowledge Quercus Suber of
the existence Bark’s antioxidant
Quercus proprieties
Suber Bark’s [17]. proprieties [17].
antioxidant
120
QSB- stabilized emulsion Ascorbic acid Medium
100
* *
% of reduction of ROS
80
60
40
20
0
H2O2 UV radiation
Figure 6. ROS (Reactive Oxygen Species) reduction after exposure to H2 O2 of HaCaT cells and UV-B
Figure 6. ROS (Reactive Oxygen Species) reduction after exposure to H2O2 of HaCaT cells and UV-B
radiation, containing QSB-stabilized emulsion and ascorbic acid. The data are expressed as the mean of
radiation,
at least 12 containing QSB-stabilized
replicate experiments emulsion
± standard and ascorbic
deviation. acid. The
Significance: (*)data are expressed
p < 0.05 as thecontrol
versus positive mean
of at least 12 replicate
cells (ascorbic acid). experiments ± standard deviation. Significance: (*) p < 0.05 versus positive
control cells (ascorbic acid).
Ascorbic acid was used as a positive control due to its potent antioxidant properties, measured
by theAscorbic
capacityacidtowas used as
reduce a positive
ROS species, control
and due to its itpotent
because antioxidant
possesses properties,
a variety of othermeasured
topical
by the capacity
advantages to reduce
including ROS species, from
photoprotection and because
UVR, and it possesses
improvement a variety of other
of a variety oftopical advantages
inflammatory skin
including photoprotection
disorders [38]. from UVR, and improvement of a variety of inflammatory skin disorders
[38]. As the statistical analysis indicates, the QSB-stabilized emulsion led to an evident reduction
As the
of ROS, statistical
although, analysis
when indicates,
compared, nottheas QSB-stabilized
accentuated asemulsion led to acid
with ascorbic an evident
and withreduction of
a higher
ROS, although, when compared, not as accentuated as with ascorbic acid and with
standard deviation. This antioxidant phenomenon can probably be explained by the presence of certain a higher standard
deviation.
compositesThisof QSB.antioxidant
The presencephenomenon can probably
of several phenolic acids inbeQSB explained by theand,
was identified presence of studies,
in several certain
composites of QSB. The presence of several phenolic acids in QSB was identified
these phenolic compounds revealed a wide variety of relevant properties, namely, their antioxidant and, in several
studies, these
and radical phenolicproperties
scavenger compounds revealed
[17,39]. a wide
Suberin, variety
a natural of relevant properties,
aliphatic-aromatic namely,
cross-linked their
polyester,
antioxidant and radical
is the main composite scavenger
of QSB and wasproperties [17,39].toSuberin,
likewise shown a naturalproprieties
have antioxidant aliphatic-aromatic cross-
[39,40]. Another
linked polyester, is the main composite of QSB and was likewise shown
group of constituents of QSB identified to have antioxidant behavior was terpenes, one of the mostto have antioxidant
proprieties
extensive and [39,40].
variedAnother group
structural of constituents
compounds of QSB
occurring identified
in nature, to have antioxidant
providing behavior
relevant protection was
under
terpenes,
oxidative one of [41].
stress the most extensive and varied structural compounds occurring in nature, providing
relevant protection under oxidative stress [41].
The QSB-stabilized emulsion was evaluated for inhibitory activity on human neutrophil elastase
and its IC50 was found to be 0.25 mg/mL. This anti-elastase phenomenon can probably be explained
by the presence of certain phenolic compounds of QSB. Several studies showed that extracts
containing gallic, protocatechuic and caffeic acids inhibit elastase activity. In addition, terpenoid
compounds are elastase inhibitors, preventing the degradation of elastin fibrous structure in thePharmaceutics 2019, 11, 131 14 of 16
The QSB-stabilized emulsion was evaluated for inhibitory activity on human neutrophil elastase
and its IC50 was found to be 0.25 mg/mL. This anti-elastase phenomenon can probably be explained
by the presence of certain phenolic compounds of QSB. Several studies showed that extracts containing
gallic, protocatechuic and caffeic acids inhibit elastase activity. In addition, terpenoid compounds are
elastase inhibitors, preventing the degradation of elastin fibrous structure in the dermal matrix [15].
3.9. In Vivo Compatibility and Sensorial Studies
In vivo safety testing can be used to generate product claims. HRIPT was conducted to justify the
claim “dermatological tested”. During the HRIPT study, no reactions or skin sensitization/irritation
were observed in the initial three weeks of contact or even after the final challenge contact. Thus,
very good skin compatibility was obtained for QSB-stabilized emulsion. The cosmetic properties
of the QSB-stabilized emulsion were assessed using a simple sensory questionnaire in which the
basic characteristics, like application and skin feel, were evaluated by volunteers, during and
after application. Results showed that QSB-FF met consumer appeal and acceptance requirements.
The general opinion was truly positive and so QSB-FF presented the highest scores for spreadability
and skin feel on application. It presented a low score for oiliness and stickiness. The fragrance was
very much appreciated by the volunteers and they considered that it was easy to apply and quick
to spread. In the after feel, volunteers reported hydration and softness and the intent to buy was
somewhat high.
4. Conclusions
Accordingly, a novel Quercus suber-based Pickering emulsion for topical application was
design and characterized. The QSB-stabilized emulsion developed met the predefined goal of
using biocompatible organic particles to create a high skin compatible emulsion. As previously
outlined, QSB-stabilized emulsion had the necessary characteristics to make it a suitable vehicle for
topical delivery system, presenting compatible pH for the human skin and shear-thinning behaviour.
The in vitro study revealed that QSB-stabilized emulsion shows anti-oxidant and anti-elastase activity.
This can be explained by the presence of several phenolic acids, suberin and terpenes in Quercus Suber
Bark. The in vivo compatibility study confirmed that QSB-stabilized emulsion is not skin irritant,
being safe for human use. In addition, the sensorial analysis confirmed that QSB-stabilized emulsion
was very appreciated by the volunteers. They considered it easy to apply and quick to spread, giving a
feel of softness and hydration to the skin.
Our findings combined with data reported so far enrich existing knowledge about the potent
anti-oxidant action of QSB and highlight that topical Pickering emulsion stabilized by eco-friendly
particles could be a very promising area in the pharmaceutical and cosmetic industry.
Author Contributions: C.C. prepared the formulations and performed the optimization and stability studies.
A.G. and L.M.G. performed the in vitro characterization studies. P.P. performed the in vivo studies. H.M.R. and
J.M. designed and supervised the experiments. All authors contributed for the manuscript preparation.
Funding: This research was funded by Fundação para a Ciência e a Tecnologia, Portugal (UID/DTP/04138/2013
and PTDC/MEC-DER/30198/2017).
Conflicts of Interest: The authors state no conflict of interest and have received no payment in preparation of
this manuscript.
References and Note
1. Marto, J.; Ascenso, A.; Simões, S.; Almeida, A.J.; Ribeiro, H.M. Pickering emulsions: Challenges and
opportunities in topical delivery. Expert Opin. Drug Deliv. 2016, 13, 1093–1107. [CrossRef]
2. Ribeiro, H.M.; Morais, J.A.; Eccleston, G.M. Structure and rheology of semisolid o/w creams containing cetyl
alcohol/non-ionic surfactant mixed emulsifier and different polymers. Int. J. Cosmet. Sci. 2004, 26, 47–59.
[CrossRef] [PubMed]Pharmaceutics 2019, 11, 131 15 of 16
3. Bouyer, E.; Mekhloufi, G.; Rosilio, V.; Grossiord, J.L.; Agnely, F. Proteins, polysaccharides, and their
complexes used as stabilizers for emulsions: Alternatives to synthetic surfactants in the pharmaceutical
field? Int. J. Pharm. 2012, 436, 359–378. [CrossRef]
4. Marto, J.; Baltazar, D.; Duarte, A.; Fernandes, A.; Gouveia, L.; Militão, M.; Salgado, A.; Simões, S.; Oliveira, E.;
Ribeiro, H.M. Topical gels of etofenamate: In vitro and in vivo evaluation. Pharm. Dev. Technol. 2015, 20,
710–715. [CrossRef] [PubMed]
5. Marto, J.; Gouveia, L.F.; Jorge, I.M.; Duarte, A.; Gonçalves, L.M.; Silva, S.M.C.; Antunes, F.E.; Pais, A.A.C.C.;
Oliveira, E.; Almeida, A.J.; et al. Starch-based Pickering emulsions for topical drug delivery: A QbD
approach. Colloid Surf. B: Biointerfaces 2015, 135, 183–192. [CrossRef] [PubMed]
6. Marto, J.; Gouveia, L.F.; Gonçalves, L.; Chiari-Andréo, B.G.; Isaac, V.; Pinto, P.; Oliveira, E.; Almeida, A.J.;
Ribeiro, H.M. Design of novel starch-based Pickering emulsions as platforms for skin photoprotection.
J. Photochem. Photobiol. B: Biol. 2016, 162, 56–64. [CrossRef] [PubMed]
7. Chevalier, Y.; Bolzinger, M.A. Emulsions stabilized with solid nanoparticles: Pickering emulsions.
Colloid. Surf. A: Physicochem. Eng. Asp. 2013, 439, 23–34. [CrossRef]
8. Matos, M.; Timgren, A.; Sjöö, M.; Dejmek, P.; Rayner, M. Preparation and encapsulation properties of double
Pickering emulsions stabilized by quinoa starch granules. Colloid. Surf. A: Physicochem. Eng. Asp. 2013, 423,
147–153. [CrossRef]
9. Binks, B.P. Particles as surfactants—Similarities and differences. Curr. Opin. Colloid Interface Sci. 2002, 7,
21–41. [CrossRef]
10. Kaewsaneha, C.; Tangboriboonrat, P.; Polpanich, D.; Eissa, M.; Elaissari, A. Preparation of Janus colloidal
particles via Pickering emulsion: An overview. Colloid. Surf. A: Physicochem. Eng. Asp. 2013, 439, 35–42.
[CrossRef]
11. Timgren, A.; Rayner, M.; Sjöö, M.; Dejmek, P. Starch particles for food based Pickering emulsions.
Procedia Food Sci. 2011, 1, 95–103. [CrossRef]
12. Marku, D.; Wahlgren, M.; Rayner, M.; Timgren, A. Characterization of starch Pickering emulsions for
potential applications in topical formulations. Int. J. Pharm. 2012, 428, 1–7. [CrossRef] [PubMed]
13. Rayner, M.; Marku, D.; Eriksson, M.; Dejmek, P.; Wahlgren, M. Biomass-based particles for the formulation
of Pickering type emulsions in food and topical applications. Colloid. Surf. A: Physicochem. Eng. Asp. 2014,
458, 48–62. [CrossRef]
14. Laredj-Bourezg, F.; Chevalier, Y.; Boyron, O.; Bolzinger, M.A. Emulsions stabilized with organic solid
particles. Colloid. Surf. A: Physicochem. Eng. Asp. 2012, 413, 252–259. [CrossRef]
15. Carriço, C.; Ribeiro, H.M.; Marto, J. Converting cork by-products to ecofriendly cork bioactive ingredients:
Novel pharmaceutical and cosmetics applications. Ind. Crop Prod. 2018, 125, 72–84. [CrossRef]
16. Jové, P.; Olivella, A.C.; Cano, L. Study of the variability in chemical composition of bark layers of Quercus
Suber L. from different production areas. BioResources 2011, 6, 1806–1815. [CrossRef]
17. Santos, S.; Pinto., P.; Silvestre, A.; Neto, C.P. Chemical composition and antioxidant activity of phenolic
extracts of cork from Quercus suber L. Ind. Crop Prod. 2010, 31, 521–526. [CrossRef]
18. Castola, V.; Marongiu, B.; Bighelli, A.; Floris, C.; Laï, A.; Casanova, J. Extractives of cork (Quercus suber L.):
Chemical composition of dichloromethane and supercritical CO2 extracts. Ind. Crop Prod. 2005, 21, 65–69.
[CrossRef]
19. Subhashini, S.; Begum, S.F.M.; Rajesh, G. Antimicrobial characterisation combining spectrophotometric
analysis of different oak species. Int. J. Herb. Med. 2016, 4, 32–35.
20. Khennouf, S.; Benabdallah, H.; Gharzouli, K.; Amira, S.; Ito, H.; Kim, T.H.; Yoshida, T.; Gharzouli, A. Effect
of Tannins from Quercus suber and Quercus coccifera Leaves on Ethanol–Induced Gastric Lesions in Mice.
Int. J. Agric. Food Chem. 2003, 51, 1469–1473. [CrossRef] [PubMed]
21. Coquet, C.; Bauza, E.; Oberto, G.; Berghi, A.; Farnet, A.M.; Ferré, E.; Peyronel, D.; Dal Farra, C.; Domloge, N.
Quercus suber cork extract displays a tensor and smoothing effect on human skin: An in vivo study.
Drugs Exp. Clin. Res. 2005, 31, 89–99. [PubMed]
22. Marto, J.; Gonçalves, L.M.; Fitas, M.; Pinto, P.; Almeida, A.J.; Ribeiro, H.M. Safety assessment of starch–based
personal care products: Nanocapsules and pickering emulsions. Toxicol. Appl. Pharm. 2018, 342, 14–21.
[CrossRef] [PubMed]You can also read