Development of a novel method for the in situ dechlorination of immovable iron elements: optimization of Cl extraction yield through experimental ...
←
→
Page content transcription
If your browser does not render page correctly, please read the page content below
www.nature.com/scientificreports
OPEN Development of a novel method
for the in‑situ dechlorination
of immovable iron elements:
optimization of Cl− extraction yield
through experimental design
Marco Veneranda1,2*, Nagore Prieto‑Taboada1, Jose Antonio Carrero1, Ilaria Costantini1,
Aitor Larrañaga3, Kepa Castro1, Gorka Arana1 & Juan Manuel Madariaga1,4
The conservation of iron objects exposed to marine aerosol is threatened by the formation of
akaganeite, a highly unstable Cl-bearing corrosion phase. As akaganeite formation is responsible of
the exfoliation of the rust layer, chlorides trigger a cyclic alteration phenomenon that often ends with
the total consumption of the iron core. To prevent this degradation process, movable iron elements
(e.g. archaeometallurgical artefacts) are generally immersed in alkaline dechlorination baths.
Aiming to transfer this successful method to the treatment of immovable iron objects, we propose
the in-situ application of alkaline solutions through the use of highly absorbent wraps. As first step
of this novel research line, the present work defines the best desalination solution to be used and
optimizes its extraction yield. After literature review, a screening experimental design was performed
to understand the single and synergic effects of common additives used for NaOH baths. Once the
most effective variables were selected, an optimization design was carried out to determine the
optimal conditions to be set during treatment. According to the experimental work here presented,
the use of 0.7 M NaOH solutions applied at high temperatures (above 50 °C) is recommended. Indeed,
these conditions enhance chloride extraction and iron leaching inhibition, while promoting corrosion
stabilization.
The conservation of Built Heritage located near the coastline is constantly threatened by the presence of
chlorides1–3. As major component of marine aerosols, C l− ions trigger physical and chemical weathering of
Built Heritage m aterials4–6. Focusing on iron-based components (both structural and ornamental), chlorides
infiltration promotes the formation of unstable corrosion phases that accelerate deterioration processes7–11.
Among them akaganeite ( FeO0.883(OH)1.167Cl0.167), which chemical structure is characterized by tunnels (filled
by chloride ions) parallel to the c-axis of the tetragonal lattice, tends to form low density rust layers12, whose
henomena13,14. If not treated, akaganeite formation triggers a
high fragility facilitates cracking and exfoliation p
cyclical mechanism that often ends with the total consumption of the iron c ore15. Beyond the deterioration of iron
elements directly exposed to the external environment, chlorides can penetrate porous concrete thus reaching
steel reinforcing bars (rebar)16–18. Knowing that akaganeite is the Fe-corrosion product having the highest coef-
ficient of expansion (akaganeite 3.48 > lepidocrocite 3.03 > goethite 2.91 > hematite 2.12 > magnetite 2.0819), the
internal pressure generated by akaganeite formation on rebars causes concrete’s cracking and spalling20–22. The
consequent exposure of rebars to the aggressive external environment accelerates the propagation of reinforce-
ment corrosion, which ends undermining the structural integrity of the b uilding23.
To prevent the Cl-driven alteration of iron components, preservation treatments are therefore required to (1)
extract Cl− ions penetrated within the iron-corrosion layers and (2) shelter dechlorinated elements from further
chloride contaminations. As detailed elsewhere24, multiple guidelines are available for the optimal protection
1
Department of Analytical Chemistry, University of the Basque Country (UPV/EHU), P.O. Box 644, 48080 Bilbao,
Spain. 2Department of Condensed Matter Physics, Crystallography and Mineralogy, University of Valladolid,
Valladolid, Spain. 3General Research Services (SGIker), University of the Basque Country, Leioa, Spain. 4Unesco
Chair of Cultural Landscapes and Heritage, University of the Basque Country (UPV/EHU), 01080 Vitoria‑Gasteiz,
Spain. *email: marco.veneranda.87@gmail.com
Scientific Reports | (2021) 11:10789 | https://doi.org/10.1038/s41598-021-90006-y 1
Vol.:(0123456789)www.nature.com/scientificreports/
and repair of reinforced concrete affected by chloride i nfiltration25,26. For example, one of the most conventional
repair strategies consist in the re-passivation of rebars (e.g., by applying surface corrosion inhibitors27 or by using
electrochemical chloride extraction methods28), followed by the replacement of the contaminated concrete with
an alkaline material highly resistant to chloride penetration.
With regards to iron elements directly exposed to marine aerosol, dechlorination treatments need to be
carried out before the application of paint coatings or corrosion inhibitors29–31. In this regards, even though
very effective dechlorination strategies have been recently developed (e.g. the immersion in alkaline subcriti-
cal fluids32,33) the immersion in alkaline baths is the most employed method to stabilize movable iron items.
Indeed, besides being cost effective, easy to implement and highly effective, desalination baths also prevent iron
leaching and aesthetical alterations of the corrosion layer34–36. However, technical problems related to the in-situ
application of alkaline solutions difficult its transfer to the treatment of immovable items, as is the case of the
ornamental and structural elements of the Built Heritage.
Learning from similar field of research, the in-situ desalination of mortars and masonries is effectively
achieved by the use of extractive solutions imbibed in highly absorbent materials (e.g. cellulose pulp, carboxym-
ethyl cellulose and clays37–40). Directly applied on the element to be treated, the imbibed wraps allow a controlled
iteration of the solution with the contaminated surface, favouring the in-depth solubilization and extraction of
soluble salts (including Cl- ions)41. In spite of the proven compatibility between common wrapping materials
(such as bentonite and sepiolite clays) and strong alkaline s olutions42–45, the described method has never been
applied to the in-situ dechlorination of iron elements.
Filling this gap, a novel research line was defined to evaluate the applicability of absorbent wraps imbibed
with alkaline solutions, for the in-situ dechlorination of immovable iron elements. In this framework, the present
manuscript investigates the real effects entailed by the main alkaline solutions used for the dechlorination of
iron artefacts and defines the optimal values ensuring the best results in term of Cl− extraction, iron leaching
inhibition and corrosion stabilization.
In this regards, it is important to underline that the majority of alkaline dechlorination baths are nowadays
carried out by using NaOH-based s olutions35,36,46. In spite of their well-recognized efficacy, literature proves that
several additives have been recently proposed to further improve the stabilization capability of NaOH baths.
For example, sodium sulphite ( Na2SO3) has been used as additive to increase the desalination capability of the
solutions47,48. Similarly, the synergic use of NaOH and ethylenediamine has been tested to improve the iron leach-
ing inhibition of the alkaline bath49,which represents one of the main side effects of immersing metallic artefacts
in aqueous solutions. Numerous researchers also experimented with the deoxygenation of alkaline baths to limit
the development of new corrosion phases during t reatment50. Indeed, is it well known that during immersion,
oxygen can react with the iron surface leading to the onset of new degradation products. In addition to the use
of additives, it is well known that the efficacy of NaOH solutions can be strongly enhanced by increasing their
temperature above 50 °C51.
Considering the large number of variables to take into account, the present work focused on (1) evaluating
their single and synergic effect on the efficacy of NaOH-based baths, and (2) optimizing the extraction yield of
the dechlorination solution to be used for wraps’ imbibition. To achieve these goals, we made use of experimental
designs, which advantages in these kinds of studies has been proven in numerous works52–54.
Materials and methods
Alkaline baths comparison and optimization. Even though literature shows many scientific articles
focused on evaluating the effects entailed by those single variables/additives on the efficacy of NaOH-based
baths, only a few studies focused on maximizing the extraction yield of the proposed treatments. In this context
it must be also underlined that very little is known about the synergic effects (positive and negative) produced
by the simultaneous use of two or more variables/additives. In order to fulfil this gap of knowledge, the real
effects entailed by the mentioned variables are here investigated by means of experimental design. As described
elsewhere, this is a statistical tool that allows to identify (with the minimum number of experiment) the effect
entailed by single variables on predetermined responses, as well as monitor the possible positive/negative inter-
actions between variables55.
In detail, a screening experimental d esign56 was carried out to: (1) identify the variables having the highest
−
influence in both, Cl extraction and Fe leaching inhibition, and (2) monitor the possible positive/negative inter-
actions between variables. Taking into account the above mentioned NaOH-based baths, a full factorial design
was performed taking into consideration 5 variables and 2 levels (low and high values, codified as − 1 and + 1
respectively) without centre points (see Table 2). Afterwards, the influence of the most important variables was
investigated and optimized by central composite design (CCD) combined with response surface methodology
(RSM). As explained by Torrades et al.57 this method analyzes each variable at 5 different levels. The low, centre
and high levels of each variable are designated as − 1, 0 and + 1, respectively, while − 1.68 and + 1.68 codified levels
have the purpose of predicting the response functions outside the cubic domain (see Table 4). Each experiment
of the proposed design was carried out in triplicates. In both cases, the Unscambler software (CAMO ASA,
Norway) was employed for data interpretation.
For both experimental designs, treatments were carried out by immersing 0.25 g of powdered akaganeite
in 50 ml of alkaline solution. The ratio between sample weight and solution volume of 1/200 was established to
avoid saturation phenomena. During treatment, the vessels containing the mixture of akaganeite and NaOH
solutions were sealed to prevent the evaporation of the liquid phase and the contact with atmospheric oxygen.
Temperature was controlled using a Heraeus Function Line heating oven. With regards to solutions deoxygena-
tion, a two steps protocol was applied. In brief, a preliminary deoxygenation was carried out by immersing the
Scientific Reports | (2021) 11:10789 | https://doi.org/10.1038/s41598-021-90006-y 2
Vol:.(1234567890)www.nature.com/scientificreports/
solvent container in an ultrasonic bath (Ultrasons-H, JP Selecta, Spain) for 1 h. Afterwards, Helium sparging
was additionally performed, by bubbling the noble gas through the solutions for 5 m in58 .
Akaganeite synthesis. Even though experimental designs have been successfully used in several field of
s tudy59–61, reliable statistical results are difficult to attain through the study of heterogeneous samples (i.e. real
iron objects and rust samples). Therefore, the experiments presented in this work have been carried out by treat-
ing pure samples of akaganeite synthesised in the laboratory. The adopted strategy had the purpose of ensuring
repetitive results and simplifies the detection of corrosion phase transformations. Akaganeite synthesis was per-
formed by following the method proposed by Reguer et al.62, which consists in heating (at a constant tempera-
ture of 70 °C) an aqueous solution of F eCl3 0.1 M (reagent grade, supplied by Sigma Aldrich, purity of 97%) in
a sealed baker for 48 h. To remove the majority of free C l− ions, the precipitated powder was then subjected to
a thorough washing process using Milli-Q water. The solid phase was finally collected after centrifugation and
dried at room temperature for 7 days.
Iron corrosion characterization. The molecular composition of the final product was characterized by
means of the Analytical Xpert PRO X-Ray Diffractometer (XRD, PANalytical, Netherlands). The XRD system
is equipped with a copper tube, a vertical goniometer (Bragg–Brentano geometry), a programmable divergence
slit, a secondary graphite monochromator and a Pixcel detector. The measurement conditions were set at 40 kV,
40 mA and a scan ranging between 5 and 70 °2theta. Diffractograms interpretation was performed using Win-
PLOTR software, by comparison with the PDF-4 standards database63.
Treated samples characterization. After each experiment, the solid phase (treated akaganeite) was
separated from the NaOH-based solution by centrifugation. The quantitative analysis of extracted chlorine was
performed by using a Dionex ICS 2500 ion chromatograph (Thermo Scientific, USA) equipped with an ED50
conductivity detector and an AS 40 auto sampler. Before analysis, the NaOH-based solutions were subjected to a
dilution process using Milli-Q water. Analyses were carried out by using an IonPac AS23 (4 × 250 mm) column,
an IonPac AG23 (4 × 50 mm) pre-column, 4.5 mmol/L Na2CO3/0.8 mmol/L NaHCO3 mobile phase (reagent
grade, both supplied by Sigma Aldrich, purity of 99,9%), 25 mA suppression current and a flow of 1 mL min−1.
Extracted Cl− ions were quantified through an external calibration curve, while data processing was performed
using the 6.60-SPIA CHROMALEON software (Dionex Corporation, USA).
To assess the possible lixiviation of iron during samples treatment, a NexION 300 Inductively coupled
Plasma—Mass Spectrometry system (PerkinElmer, USA) was employed. Before analysis, NaOH-based solu-
tions were diluted (Milli-Q water), while a standard solution of HNO3 (tracepur grade, supplied by Merk, Ger-
many) was used to reach the optimal acidity value. The quantification of 56Fe isotope was performed under the
following experimental conditions: nebulizer flow of 0.9–1.0 mL m in−1, plasma flow of 18 mL m
in−1 and radio
frequency power of 1400 W. Argon with a purity of 99.995% was provided by Praxiar (Spain). Analyses were
carried out inside a clean room (class 100) and quantitative data were obtained by means of external calibration
curve, using a 1000 mg L −1 standard solution (Specpure, Plasma standard solution, Germany). Data acquisition
and interpretation was done using the NexION 1.5 software (Perkin Elmer, USA).
To verify the possible transformation of akaganeite into more stable phases, qualitative analyses were carried
out with a Fourier transform infrared spectroscopy (FTIR) system working in transmittance mode. Concretely, a
6300 FTIR spectrophotometer (Jasco, Japan) composed of a Ge on KBr beamsplitter, a Michelson interferometer
and a DLaTGS detector was used. To prepare the pellets, 0.5 mg of treated akaganeite was mixed with 170 mg of
dry KBr (FTIR grade, supplied by Sigma-Aldrich, purity > 99%), milled in an agate mortar and pressed under 10
tons/cm2 for 8 min. All analyses were carried out in the middle infrared region (from 4000 to 400 c m−1) recording
64 scans at 4 c m−1 spectral resolution. The qualitative analysis of the collected spectra was done using the Omnic
software version 7.2 (Thermo Nicolet, USA). After completing the FTIR analysis of all solid samples, the PALME
software (Program d’AnaLyse vibrationnelle de spectres de MElanges à partir de spectres purs) developed by the
LADIR Laboratory (now MONARIS, Pierre et Marie Curie University, France) was employed to semi-quantify
the detected iron corrosion p hases64. The reliability of this tool regarding the study of iron corrosion phases is
deeply described in a dedicated w ork65.
Results and discussion
Akaganeite synthesis. As represented in Fig. 1, the X-ray diffractogram obtained from the analysis of
synthetic akaganeite displays main peaks at 26.8 (relative intensity of 100%), 35.2 (79.2%), 55.9 (49.5%), 11.9
(35.9%), 39.2 (34.8%), 34.0 (31.9%), 16.8 (29.6%) and 46.5°2Theta (26.7%), which fit with the akaganeite refer-
ence standard from the PDF-4 database (00–042-1315).
In order to correctly identify and semi-quantify the potential secondary corrosion products formed dur-
ing treatment, the synthetized material need to be mineralogically pure. To verify this aspect, the whole list of
detected diffractometric peaks was analysed in detail. As summarized in Table 1, positions and relative intensity
values of all detected peaks perfectly matched the reference 00-042-1315, thus proving the synthesis of pure
akaganeite. In this sense, Table 1 also provides the corresponding basal planes of each detected signal.
Besides mineralogical purity, the synthetized akaganeite has to be highly crystalline so as to ensure treat-
ment results similar to those provided by real rust product. Therefore, the X-ray diffractogram was also used
to determine the average size of the crystalline domain (mean coherence length (MCL)) of the sample, which
value was extracted from the broadening of the main diffractometric signal using the Scherrer equation (Eq. 1)66:
Scientific Reports | (2021) 11:10789 | https://doi.org/10.1038/s41598-021-90006-y 3
Vol.:(0123456789)www.nature.com/scientificreports/
Figure 1. XRD diffractogram collected from synthesized akaganeite.
Corresponding basal
Peak position (°2Theta) Intensity (counts) FWHM (°2Theta) d-spacing (Å) Relative intensity (%) planes (h, k, l)
11.9 97.3 0.20 7.45 35.9 1, 0, − 1
16.8 80.2 0.18 5.27 29.6 0, 0, 2
26.8 270.9 0.15 3.33 100.0 1, 0, − 3
34.0 86.4 0.18 2.63 31.9 0, 0, 4
35.2 214.5 0.18 2.55 79.2 2, 1, − 1
38.2 20.7 0.26 2.35 7.6 2, 0, 4
39.2 94.4 0.13 2.30 34.8 3, 1, 0
43.0 33.1 0.20 2.10 12.2 3, 1, − 2
43.8 17.9 0.31 2.07 6.6 5, 0, − 1
46.5 72.2 0.20 1.95 26.7 1, 1, − 4
48.9 19.5 0.20 1.86 7.2 4, 0, 4
52.1 43.4 0.20 1.76 16.0 6, 0, 6
55.9 134.2 0.20 1.64 49.5 5, 1, − 2
61.2 25.1 0.26 1.52 9.3 0, 2, 0
64.4 53.2 0.26 1.45 19.6 5, 1, − 4
67.8 27.0 0.37 1.38 10.0 3, 2, − 1
Table 1. List of peaks detected from the XRD analysis of synthetic akaganeite.
(1)
βhkl = k · Lhkl · cos θ
where βhkl is the broadening of the main diffraction line measured at half the line maximum intensity (FWHM)
taking in to account instrumental contribution (βInst = 0.1°), λ is the X-ray wavelength, Lhkl is the crystal size and
θ is the diffraction angle and, K is the Scherrer shape factor (K = 0.9 was used for the calculations).
By taking into consideration the FWHM of the main peak detected at 26.8°2theta, the mean crystallite size
was calculated to be around 80 nm. This value was found to be in accordance with the MCL values calculated
from the XRD analysis of real akaganeite-rich rust samples collected from iron archaeological artefacts deeply
analyzed in previous works (between 20 and 100 nm)15,65.
Screening experimental design. According to the review on alkaline dechlorination baths provided in
the introduction section, NaOH (A), Na2SO3 (B), ethylenediamine (C), temperature (D) and deoxygenation (E)
were the variables selected for the screening experimental design. The defined low (-1) and high (+ 1) levels listed
in Table 2 were chosen according to bibliographic data35,36,46–51.
All the experiments were started at the same time and, after 48 h of treatment, solid and liquid phases were
separated by centrifugation. After filtering, washing and dilution processes the amount of extracted C l− and
leached 56Fe were quantified by IC and ICP-MS respectively. Quantitative results obtained from each experiment
are reported in Table 3.
Scientific Reports | (2021) 11:10789 | https://doi.org/10.1038/s41598-021-90006-y 4
Vol:.(1234567890)www.nature.com/scientificreports/
Codified
levels
Variables −1 1
A NaOH (M) 0 0.5
B Na2SO3 (M) 0 0.05
C Ethylenediamine (% v/v) 0 5
D Temperature (°C) 25 70
E Deoxygenation No Yes
Table 2. Variable and levels used in the full factorial screening design.
Codified variables Responses
Experiments A B C D E Cl (mg/L) Fe (μg/L)
T01 −1 −1 −1 −1 1 6037 119.1
T02 1 −1 −1 −1 1 18,090 13.5
T03 −1 1 −1 −1 1 17,956 27.4
T04 1 1 −1 −1 1 18,338 13.9
T05 −1 −1 1 −1 1 20,251 2.4
T06 1 −1 1 −1 1 19,065 13.6
T07 −1 1 1 −1 1 20,752 11.7
T08 1 1 1 −1 1 19,251 18.5
T09 −1 −1 −1 1 1 7105 151.6
T10 1 −1 −1 1 1 31,573 5.9
T11 −1 1 −1 1 1 22,418 26.1
T12 1 1 −1 1 1 32,063 14.7
T13 −1 −1 1 1 1 21,237 4.1
T14 1 −1 1 1 1 33,265 7.5
T15 −1 1 1 1 1 23,145 21.0
T16 1 1 1 1 1 33,435 7.9
T17 −1 −1 −1 −1 −1 6021 254.2
T18 1 −1 −1 −1 −1 35,081 8.9
T19 −1 1 −1 −1 −1 17,554 23.8
T20 1 1 −1 −1 −1 18,033 21.4
T21 −1 −1 1 −1 −1 20,820 12.5
T22 1 −1 1 −1 −1 18,998 24.4
T23 −1 1 1 −1 −1 20,757 18.4
T24 1 1 1 −1 −1 18,972 42.7
T25 −1 −1 −1 1 −1 6826 161.8
T26 1 −1 −1 1 −1 31,981 14.3
T27 −1 1 −1 1 −1 22,665 33.9
T28 1 1 −1 1 −1 32,626 9.5
T29 −1 −1 1 1 −1 22,124 14.7
T30 1 −1 1 1 −1 34,065 11.8
T31 −1 1 1 1 −1 23,310 16.1
T32 1 1 1 1 −1 32,889 18.6
Table 3. Design matrix and results of the 25 full factorial screening design.
The results reported in Table 3 were used to run the analysis of effects. In this sense, the table provided as
supplementary information (Table SI1) describes how the variables and their two-way interactions influence
both Cl− extraction and Fe lixiviation responses (standard cut-off α = 0.05 was set).
In brief, important inferences about Cl− extraction were deduced from p value determination. Statistical
results of single variables effects proved that NaOH and temperature have significant positive main effect on the
l− extraction (p value of 0.0001 and 0.0005 respectively). Ethylenediamine also had a positive influence
yield of C
on this variable response (p value = 0.0135) while N a2SO3 and deoxygenation shown low (p value = 0.0475) and
no significant (p value = 0.3065) influence, respectively. Regarding the synergic effects of variables, analysis of
variance proved that the two-way interaction of NaOH with Na2SO3 (A-B p value = 0.0475) and ethylenediamine
Scientific Reports | (2021) 11:10789 | https://doi.org/10.1038/s41598-021-90006-y 5
Vol.:(0123456789)www.nature.com/scientificreports/
Codified variables
Factors − 1.68 −1 0 +1 + 1.68
A NaOH (M) 0.01 0.2 0.5 0.8 1
B Temperature (ºC) 26 40 60 80 94
C Time (h) 6 30 65 100 124
Table 4. Variables and levels used in the central composite optimization design.
(A-C p value = 0.0135) had a negative influence on Cl− extraction. On the contrary, the synergic effect shown
by NaOH and temperature (A-D p value = 0.0036) was expected, as previous laboratory studies demonstrated
chloride extraction is enhanced when alkaline media are applied at high t emperatures67. The analysis of vari-
ance provided the β-coefficients of main effects and 2-way interactions of the selected variables. The determined
β-values were therefore employed to write the regression equation of C l− response:
−
R Cl = 2208+464.8A+130.1B+181.2C+358.6D−240.8AB−237.6AC+249.6AD mg/L
The obtained model presents a square correlation coefficient ( R2) of 0.976, which indicates that the 97.6% of the
extraction variability is explained by the model.
Regarding Fe lixiviation results, the single variables NaOH (p value = 0.0022), Na2SO3 (p value = 0.0083)
and ethylenediamine (p value = 0.0022) negatively affected the concentration of Fe in the solutions, which sug-
gests their active role in the inhibition of lixiviation process. On the contrary, the synergic effect of A-B (p
value = 0.0037), A-C (p value = 0.0012) and C-D (p value = 0.0028) variables increased iron lixiviation. Table
SM1 shows the null influence of temperature and deoxygenation on the iron leaching. As showed below, the
β-coefficients determined by ANOVA were employed to write the regression equation of Fe response:
R [Fe] = 35.18−20.37A−15.46B − 20.44C + 19.01AB + 23.87AC + 20.09BC µg/L
The square correlation coefficient ( R2 = 0.984) corroborated from a statistical point of view the validity of the
obtained model.
Optimization experimental design. After data interpretation, a second experimental design was carried
out to optimize the Cl− extraction feature of the alkaline desalination bath. According to the results obtained
from the screening design, NaOH and temperature parameters were selected for their remarkable positive effect
l− variable response. Regarding N
on the C l− regression equa-
a2SO3 (B) and ethylenediamine (C) variables, the C
tion displayed above clearly shows that their single variable influence have a weak positive effect on chloride
extraction (βB = + 130.1 and βC = + 181.2). However, their synergic effect with NaOH (A) (βAB = − 240.8 and
βAC = − 237.6) produces a considerable negative effect. From those results, it was deduced that B and C variables
has a positive influence only when their concentration in the solution is very low (below 0.0025 M for Na2SO3
and 2.5% v/v for ethylenediamine). As the use of inappropriate concentrations of the two compounds may trig-
ger remarkable side effects on the extraction capacity of bath solutions, they were excluded from the optimiza-
tion design. Similarly, deoxygenation was also excluded, since analysis of variance proved that it has no signifi-
cant effect on either of the two responses under study. In addition to NaOH and temperature, the variable of time
was now included in the optimization experimental design. This parameter was not considered in the screening
study since several research works already proved its determinant influence in the process of d esalination68.
As displayed in Table 4, three selected variables were used to develop a central composite design (CCD).
Concerning NaOH, as the pH of standard desalination baths is around 13.5 (reached by using 0.5 M NaOH
solutions46), molarity values that goes from 0.01 to 1 were considered so that to cover the pH range between 12
and 14. Considering the boiling point of NaOH solutions is close to 100 °C69, the maximum temperature value
was precautionary set to 94 °C. With regards to the parameter of time, it is well known that the treatment of iron
surfaces can last up to several months depending on the thickness of the corrosion layers70. However, as this
work focuses on the study of fine powdered akaganeite, the duration of the experiments could be reduced to the
order of a few days. According to preparatory experiments the maximum duration of the treatment was set to
124 h, this being the minimum time necessary to trigger the conversion of akaganeite into other mineral phases
(as suggested by the colour change of the iron-powder in the solution).
As shown in Table 5, 6 centre point experiments were performed to evaluate the repetitiveness of desalina-
tion baths. Considering that each operation was carried out in triplicates, the centre composite design matrix
was finally composed of 48 experiments. After treatment, the amount of C l− extracted and Fe lixiviated by each
solution was then quantified by IC and ICP-MS systems respectively (see Table 5). Surprisingly, several treated
samples showed a chromatic variation. Considering that this phenomenon is linked to the formation of new iron-
phases70, the PALME-FTIR method was employed for the molecular semi-quantification of all solid s amples65.
As shown in Table 5, the majority of solid samples were partially transformed into goethite. In these cases,
alkaline baths were able to remove chlorides from the crystalline structure of akaganeite, triggering its transfor-
mation. Mineral interconversion is a well-known feature of the iron oxide/hydroxide system and, as presented in
a previous work, the transformation of akaganeite into goethite can be either related to topotactic reaction or a
dissolution-reprecipitation mechanism67. In addition, FTIR-PALME results verified that dechlorination experi-
ments carried out at high temperatures involved a partial transformation of treated samples into hematite. This
Scientific Reports | (2021) 11:10789 | https://doi.org/10.1038/s41598-021-90006-y 6
Vol:.(1234567890)www.nature.com/scientificreports/
Codified variables Responses
Goethite
Experiments A B C Cl (mg/L) Fe (μg/L) Hematite % (w/w) % (w/w) Akaganeite % (w/w)
T01 − 1.68 0 0 40,953 149.7 0 3.0 97.0
T02 − 1.68 0 0 39,892 122.0 0 2.9 96.1
T03 − 1.68 0 0 39,545 140.1 0 2.7 97.3
T04 1.68 0 0 39,544 9.5 0 98.5 1.5
T05 1.68 0 0 63,756 6.2 0 99.4 0.6
T06 1.68 0 0 65,474 5.0 0 98.7 1.3
T07 0 − 1.68 0 38,709 63.0 0 3.3 96.7
T08 0 − 1.68 0 38,966 93.0 0 3.6 96.4
T09 0 − 1.68 0 39,615 59.1 0 2.9 97.1
T10 0 1.68 0 46,537 41.8 3.2 96.8 0
T11 0 1.68 0 51,511 75.4 3.1 96.9 0
T12 0 1.68 0 59,335 75.3 2.5 97.5 0
T13 0 0 − 1.68 49,472 38.0 0 34.3 65.7
T14 0 0 − 1.68 50,070 25.9 0 34.3 65.7
T15 0 0 − 1.68 51,993 33.0 0 34.2 65.8
T16 0 0 1.68 61,783 9.7 0 100 0
T17 0 0 1.68 63,693 5.7 0 100 0
T18 0 0 1.68 62,442 6.3 0 98.9 1.1
T19 −1 −1 −1 40,425 92.0 0 12.2 87.8
T20 −1 −1 −1 40,047 78.2 0 5.2 94.8
T21 −1 −1 −1 39,257 88.9 0 12.9 87.1
T22 1 −1 −1 45,667 15.3 0 40.5 59.5
T23 1 −1 −1 45,624 12.8 0 36.5 63.5
T24 1 −1 −1 46,289 12.7 0 39.3 60.7
T25 −1 1 −1 40,832 116.4 0.7 1.3 97.8
T26 −1 1 −1 42,249 106.9 0.6 0.5 98.9
T27 −1 1 −1 42,240 101.3 0.6 0.6 98.8
T28 1 1 −1 45,860 60.6 26 34.6 39.4
T29 1 1 −1 44,403 68.0 25.3 33.8 40.9
T30 1 1 −1 47,244 57.0 57.3 40.6 2.1
T31 −1 −1 1 39,475 130.4 0 3.5 96.5
T32 −1 −1 1 39,885 121.7 0 2.6 97.4
T33 −1 −1 1 39,231 93.7 0 4.0 96.0
T34 1 −1 1 53,389 23.1 0 77.7 22.3
T35 1 −1 1 54,803 21.1 0 77.5 22.5
T36 1 −1 1 53,075 26.9 0 76.5 23.5
T37 −1 1 1 41,434 160.3 0.6 0 99.4
T38 −1 1 1 41,230 88.0 0.9 0.5 98.6
T39 −1 1 1 41,988 122.5 0.5 0.8 98.7
T40 1 1 1 63,599 79.9 1.2 97.9 0.9
T41 1 1 1 63,716 76.7 1.1 97.3 1.6
T42 1 1 1 65,429 80.5 0.5 99.5 0
T43 0 0 0 67,834 13.0 0 97.4 2.6
T44 0 0 0 63,963 14.5 0 99.4 0.6
T45 0 0 0 64,068 15.2 0 98.3 1.7
T46 0 0 0 65,745 5.0 0 97.7 2.3
T47 0 0 0 67,324 19.3 0 98.7 1.3
T48 0 0 0 63,801 6.5 0 98.0 2.0
Table 5. Design matrix and results of the central composite optimization design.
phenomenon is consistent with previous studies proving that, more than depending on the pH of the alkaline
solution67, the transformation of akaganeite into hematite is thermal-induced23,67.
Scientific Reports | (2021) 11:10789 | https://doi.org/10.1038/s41598-021-90006-y 7
Vol.:(0123456789)www.nature.com/scientificreports/
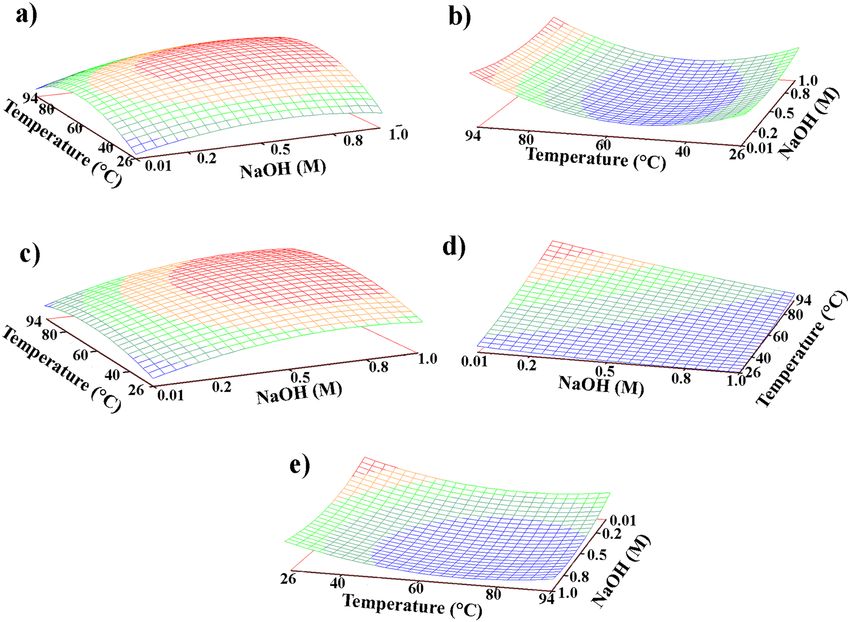
Figure 2. Response surfaces for (a) maximum C l− extraction (t = 85.0 h); (b) minimum Fe lixiviation (t = 89.6
h); (c) maximum goethite content (t = 99.4 h); (d) maximum hematite content (t = 124.0 h); (e) minimum
akaganeite content (t = 99.4 h).
Considering that the transformation of akaganeite into more stable phases is of paramount importance for
the optimal preservation of iron objects, the CCD was also used to identify the optimal conditions to obtain the
highest concentration of hematite and goethite.
Analysis of variance (ANOVA) was first performed to corroborate, from a statistical point of view, the valid-
ity of the obtained results. The ANOVA tables for the 5 response surfaces obtained from quadratic models are
provided as supplementary information (SI2).
On one side, the R-squared correlation coefficients of Cl− (0.936), Fe (0.924) responses proves that most
of the variance was explained by the model. On the other side, the lower correlation coefficients of goethite
(0.859), akaganeite (0.878) and hematite (0.569) responses is due to the fact that their relative concentration
was estimated using a semi-quantitative method (rather than the quantitative IC- and ICP-based methods used
for Cl- and Fe, respectively).
With regards to the repeatability of the experiments, the reproducibility of Cl-extraction data was calculated
by averaging the relative standard deviations (measured as percentage) of the three replicates carried out for
each CCD operation, obtaining a mean value of 3.29%.
Afterwards, the response surface methodology (RSM) was employed to identify the input variables settings
ensuring the most advantageous responses. Considering the non-linear relationship between input variables and
responses, plot results were calculated by using a full quadratic model that considers all interactions and square
effects71. As shown by the response surface provided in Fig. 2a, the extraction yield of the solution is strongly
influenced by both NaOH molarity and temperature. On one hand, Cl-extraction improves significantly when
increasing the NaOH molarity from 0.01 M to 0.7 M, while it tends to stabilize at higher concentrations (from
0.7 to 1 M). With regards to the temperature, the highest yields are obtained above 40Cº, reaching the optimal
value at 65.7ºC. According to Fig. 2b, the side reaction originating the iron leaching is only slightly affected
by the molarity of the solution, while the temperature has a significant impact. In detail, minimum values of
Fe-leaching are measured at temperatures between 30 and 70 °C, while maximum values are reached at higher
temperatures. Even though the solution’s temperature can be easily controlled during laboratory desalinations,
this is often not feasible for in-situ treatments (as is the case of the proposed method, which is based on the
application of desalination solution through the mediation of highly adsorbent wraps). However, this result is
Scientific Reports | (2021) 11:10789 | https://doi.org/10.1038/s41598-021-90006-y 8
Vol:.(1234567890)www.nature.com/scientificreports/
Variables Cl max Fe min Goethite max Hematite max Akaganeite min
Time (h) 85.0 89.6 99.4 124.0 99.4
NaOH (M) 0.71 0.42 0.79 0.01 0.67
Temperature (°C) 65.7 57.2 68.5 94.0 74.1
Table 6. Optimal variables conditions obtained by using the surface response.
important as suggests that, to improve the desalination of immovable iron elements, treatments should be carried
out during warmer seasons, where temperatures as high as 50 °C are reached in outdoor exposed metal surfaces.
The complementarity between the two response surfaces (Fig. 2a,b) is particularly relevant, as it proves that the
optimal conditions for chlorides extraction are very similar to those needed to inhibit iron leaching. Similarly,
NaOH molarity and temperature settings that enhance Cl− extraction fit to those enabling the transformation of
akaganeite into goethite (Fig. 2c). This result was predictable since the optimization of Cl-extraction increases the
possibilities of removing C l− ions within the crystal structure of akaganeite, thus, favouring its transformation
into more stable oxyhydroxide phases. The response surface displayed in Fig. 2d proves that minimum NaOH
molarity (0.01 M) and maximum temperature (94 °C) are the conditions needed for the transformation of akaga-
neite into hematite. However, the use of low NaOH molarity/high temperature solutions is strongly discouraged
since, as shown in Fig. 2a,b, these conditions cause minimum Cl− extraction and maximum Fe-leaching. Finally,
the response surface shown in Fig. 2e (akaganeite content) is in perfect agreement with the results provided in
Fig. 2c,d. Indeed, the conditions ensuring the minimum concentration of akaganeite fit with those that guarantee
the maximum content of goethite and hematite.
Thanks to response surfaces, the optimal values of temperature, NaOH molarity and time were determined
for each considered response (see Table 6).
As can be seen on Table 6, the time necessary to optimize the different responses varies considerably. For
example, the maximum transformation of akaganeite into hematite is obtained after 99 h, while the maximum
extraction of chlorides is achieved after 85 h. As this result indicates, the optimal duration of desalination
treatments does not solely depend on the amount of extracted chlorides, but also on the effect that time has on
other important variables, such as iron leaching and corrosion phases transformation. In this context it must be
also underlined that, unlike the treatment of powdered synthetic samples (this study), several variables could
affect the time needed to reach an effective desalination of real iron items, such as size and shape of the object,
porosity of the corrosion system, presence of cracks and fractures, etc. Considering they may strongly influence
the efficacy of the treatment under development, these aspects will be deeply evaluated in the next phase of the
research line presented in the introduction section.
Conclusions
This work shows the benefits provided by the use of experimental design to understand the synergic influence
of multiple variables in a system. The screening design proved temperature enhances the extraction features of
NaOH solutions, while both ethylenediamine and Na2SO3 showed negative synergic effects. After identifying
the most relevant variables, the optimization design was used to improve the solution’s yield. As a result, 0.7 was
found to be the optimal molarity for NaOH solutions, as ensures both C l− extraction enhancement and corrosion
stabilization, while inhibiting iron leaching. With regards to the temperature of application, ideal values were
measured to be between 60 and 70 °C. Although high temperatures are difficult to be maintained during in-situ
treatments, this work indicates in-situ dechlorination treatments should be applied during warmer seasons. As
NaOH solutions are compatible with many of the adsorbent materials used for the desalination of Built Herit-
age’s materials (such as sepiolite and bentonite clays) the in-situ dechlorination of immovable iron objects seems
to be feasible. However additional experimental analyses are needed to assess further aspects of the proposed
method, as to comprehend the long-term effectiveness of the treatment and evaluate the potential interactions
between the rust surface and the adsorbent material.
Received: 26 October 2020; Accepted: 29 April 2021
References
1. Smith, B. J. et al. The decay of coastal forts in southeast Brazil and its implications for the conservation of colonial built heritage.
Environ. Geol. 46, 493–503 (2004).
2. Stefanis, N. A., Theoulakis, P. & Pilinis, C. Dry deposition effect of marine aerosol to the building stone of the medieval city of
Rhodes, Greece. Build. Environ. 44, 260–270 (2009).
3. Morillas, H., Maguregui, M., Gõmez-Laserna, O., Trebolazabala, J. & Madariaga, J. M. Could marine aerosol contribute to dete-
riorate building materials from interior areas of lighthouses? An answer from the analytical chemistry point of view. J. Raman
Spectrosc. 44, 1700–1710 (2013).
4. Borges, C., Santos Silva, A. & Veiga, R. Durability of ancient lime mortars in humid environment. Constr. Build. Mater. 66, 606–620
(2014).
5. Urosevic, M., Sebastián-Pardo, E. & Cardell, C. Rough and polished travertine building stone decay evaluated by a marine aerosol
ageing test. Constr. Build. Mater. 24, 1438–1448 (2010).
6. Morillas, H. et al. In-situ analytical study of bricks exposed to marine environment using hand-held X-ray fluorescence spectrom-
etry and related laboratory techniques. Spectrochim. Acta Part B At. Spectrosc. 146, 28–35 (2018).
Scientific Reports | (2021) 11:10789 | https://doi.org/10.1038/s41598-021-90006-y 9
Vol.:(0123456789)www.nature.com/scientificreports/
7. Soulié, V. et al. Salt-induced iron corrosion under evaporating sessile droplets of aqueous sodium chloride solutions. Mater. Corros.
68, 927–934 (2017).
8. Morcillo, M., Díaz, I., Cano, H., Chico, B. & de la Fuente, D. Atmospheric corrosion of weathering steels. Overview for engineers.
Part II: Testing, inspection, maintenance. Constr. Build. Mater. 222, 750–765 (2019).
9. Iribarren, J. I., Liesa, F., Alemán, C. & Armelin, E. Corrosion rate evaluation by gravimetric and electrochemical techniques applied
to the metallic reinforcing structures of a historic building. J. Cult. Herit. 27, 153–163 (2017).
10. García, K. E., Barrero, C. A., Morales, A. L. & Greneche, J. M. Magnetic structure of synthetic akaganeite: A review of Mössbauer
data. Rev. Fac. Ing. 49, 185–191 (2009).
11. Veneranda, M. et al. Characterization of archaeometallurgical artefacts by means of portable Raman systems: Corrosion mecha-
nisms influenced by marine aerosol. J. Raman Spectrosc. 48, 258–266 (2017).
12. Xiao, H. et al. Determination of the key parameters involved in the formation process of akaganeite in a laboratory-simulated
wet-dry cyclic process. Corros. Sci. 128, 130–139 (2017).
13. Askey, A. et al. The corrosion of iron and zinc by atmospheric hydrogen chloride. Corros. Sci. 34, 233–247 (1993).
14. Alcántara, J., Chico, B., Díaz, I., de la Fuente, D. & Morcillo, M. Airborne chloride deposit and its effect on marine atmospheric
corrosion of mild steel. Corros. Sci. 97, 74–88 (2015).
15. Veneranda, M. et al. Study of corrosion in archaeological gilded irons by Raman imaging and a coupled scanning electron micro-
scope-Raman system. Philos. Trans. R. Soc. A. Math. Phys. Eng. Sci. 374, 20160046 (2016).
16. Venkatesan, P., Palaniswamy, N. & Rajagopal, K. Corrosion performance of coated reinforcing bars embedded in concrete and
exposed to natural marine environment. Prog. Org. Coatings 56, 8–12 (2006).
17. Moreno, J. D., Bonilla, M., Adam, J. M., Victoria Borrachero, M. & Soriano, L. Determining corrosion levels in the reinforcement
rebars of buildings in coastal áreas. A case study in the Mediterranean coastline. Constr. Build. Mater. 100, 11–21 (2015).
18. Sánchez-Deza, A., Bastidas, D. M., Iglesia, A. L., Mora, E. M. & Bastidas, J. M. Service life prediction for 50-year-old buildings in
marine environments. Rev. Metal. 54, 1–10 (2018).
19. Caré, S., Nguyen, Q. T., L’Hostis, V. & Berthaud, Y. Mechanical properties of the rust layer induced by impressed current method
in reinforced mortar. Cem. Concr. Res. 38, 1079–1091 (2008).
20. Balafas, I. & Burgoyne, C. J. Modeling the structural effects of rust in concrete cover. J. Eng. Mech. 137, 175–185 (2011).
21. Cao, C., Cheung, M. M. S. & Chan, B. Y. B. Modelling of interaction between corrosion-induced concrete cover crack and steel
corrosion rate. Corros. Sci. 69, 97–109 (2013).
22. Zhao, Y., Yu, J., Wu, Y. & Jin, W. Critical thickness of rust layer at inner and out surface cracking of concrete cover in reinforced
concrete structures. Corros. Sci. 59, 316–323 (2012).
23. Lu, C., Jin, W. & Liu, R. Reinforcement corrosion-induced cover cracking and its time prediction for reinforced concrete structures.
Corros. Sci. 53, 1337–1347 (2011).
24. Bertolini, L., Elsener, B., Pedeferri, P. & Polder, R. P. Surface treatments. In Corrosion of Steel in Concrete: Prevention, Diagnosis,
Repair (eds Bertolini, L. et al.) 434 (WILEY-VCH Verlag GmbH & Co, 2014).
25. Andrade, C. et al. Draft recommendation for repair strategies for concrete structures damaged by reinforcement corrosion. Mater.
Struct. 27, 415–436 (1994).
26. Monteiro, F. C. B., Trautwein, L. M. & Almeida, L. C. The importance of the European standard EN 1504, on the protection and
repair of concrete structures. J. Build. Pathol. Rehabil. 2, 1–12 (2017).
27. Prieto, M. I., Cobo, A., Rodríguez, Á. & González, M. D. L. N. The efficiency of surface-applied corrosion inhibitors as a method for
the repassivation of corroded reinforcement bars embedded in ladle furnace slag mortars. Constr. Build. Mater. 54, 70–77 (2014).
28. Miranda, J. M., Cobo, A., Otero, E. & González, J. A. Limitations and advantages of electrochemical chloride removal in corroded
reinforced concrete structures. Cem. Concr. Res. 37, 596–603 (2007).
29. Sherif, E. S. M. Effects of 5-(3-aminophenyl)-tetrazole on the inhibition of unalloyed iron corrosion in aerated 3.5% sodium
chloride solutions as a corrosion inhibitor. Mater. Chem. Phys. 129, 961–967 (2011).
30. Mayavan, S., Siva, T. & Sathiyanarayanan, S. Graphene ink as a corrosion inhibiting blanket for iron in an aggressive chloride
environment. RSC Adv. 3, 24868–24871 (2013).
31. Jeyasubramanian, K., Benitha, V. S. & Parkavi, V. Nano iron oxide dispersed alkyd coating as an efficient anticorrosive coating for
industrial structures. Prog. Org. Coatings 132, 76–85 (2019).
32. Näsänen, L. M. E., González-Pereyra, N. G., Cretté, S. A. & DeVivieś, P. The applicability of subcritical fluids to the conservation
of actively corroding iron artifacts of cultural significance. J. Supercrit. Fluids 79, 289–298 (2013).
33. Bayle, M. et al. Corrosion product transformations in alkaline baths under pressure and high temperature: The sub-critical stabi-
lisation of marine iron artefacts stored under atmospheric conditions. Mater. Corros. 67, 190–199 (2016).
34. Degrigny, C. & Spiteri, L. Electrochemical monitoring of marine iron artefacts during their storage/stabilisation in alkaline solu-
tions. in Metal 04: Proceedings of the International Conference on Metals Conservation = actes de la conférence internationale sur la
conservation des métaux, Canberra, Australia, 4–8 October 2004 315–331 (2004).
35. Selwyn, L. Overview of archaeological iron: The corrosion problem, key factors affecting treatment, and gaps in current knowled.
in Proceedings of Metal 2004 National Museum of Australia Canberra ACT99–119 (2004).
36. Kergourlay, F. et al. Mechanisms of the dechlorination of iron archaeological artefacts extracted from seawater. Corros. Sci. 53,
2474–2483 (2011).
37. Bosch-Roig, P., Lustrato, G., Zanardini, E. & Ranalli, G. Biocleaning of Cultural Heritage stone surfaces and frescoes: Which
delivery system can be the most appropriate?. Ann. Microbiol. 65, 1227–1241 (2015).
38. Carretero, M. I., Bernabé, J. M. & Galán, E. Application of sepiolite-cellulose pastes for the removal of salts from building stones.
Appl. Clay Sci. 33, 43–51 (2006).
39. Prieto-Taboada, N. et al. The problem of sampling on built heritage: A preliminary study of a new non-invasive method. Environ.
Sci. Pollut. Res. 21, 12518–12529 (2014).
40. Pozo-Antonio, J. S., Rivas, T., López, A. J., Fiorucci, M. P. & Ramil, A. Effectiveness of granite cleaning procedures in cultural
heritage: A review. Sci. Total Environ. 571, 1017–1028 (2016).
41. Torrielli, G., Gaggero, L., Caratto, V. & Ferretti, M. Innovative method and apparatus for deep cleaning of soluble salts from mortars
and lithic materials. Energy Procedia 97, 523–530 (2016).
42. Martinez-Ramirez, S., Puertas, F. & Blanco-Varela, M. T. Stability of sepiolite in neutral and alkaline media at room temperature.
Clay Miner. 31, 225–232 (1996).
43. Kelessidis, V. C., Tsamantaki, C. & Dalamarinis, P. Effect of pH and electrolyte on the rheology of aqueous Wyoming bentonite
dispersions. Appl. Clay Sci. 38, 86–96 (2007).
44. Choo, K. Y. & Bai, K. Effects of bentonite concentration and solution pH on the rheological properties and long-term stabilities
of bentonite suspensions. Appl. Clay Sci. 108, 182–190 (2015).
45. Anh, H. N., Ahn, H., Jo, H. Y. & Kim, G. Y. Effect of alkaline solutions on bentonite properties. Environ. Earth Sci. 76, 1–10 (2017).
46. Kergourlay, F. et al. Influence of corrosion products nature on dechlorination treatment: Case of wrought iron archaeological ingots
stored 2 years in air before NaOH treatment. Corros. Eng. Sci. Technol. 45, 407–413 (2010).
47. Doménech-Carbó, A. et al. Monitoring stabilizing procedures of archaeological iron using electrochemical impedance spectroscopy.
J. Solid State Electrochem. 18, 399–409 (2014).
Scientific Reports | (2021) 11:10789 | https://doi.org/10.1038/s41598-021-90006-y 10
Vol:.(1234567890)www.nature.com/scientificreports/
48. Guilminot, E. et al. Influence of crucial parameters on the dechlorination treatments of ferrous objects from seawater. Stud. Conserv.
57, 227–236 (2012).
49. Selwyn, L. S. & Argyropoulos, V. Removal of chloride and iron ions from archaeological wrought iron with sodium hydroxide and
ethylenediamine solutions. Stud. Conserv. 50, 81–100 (2005).
50. Ståhl, K. et al. On the akaganéite crystal structure, phase transformations and possible role in post-excavational corrosion of iron
artifacts. Corros. Sci. 45, 2563–2575 (2003).
51. North, N. A. & Pearson, C. Washing methods for chloride removal from marine iron artifacts. Stud. Conserv. 23, 174–186 (1978).
52. Dang, H. H. et al. Zeolitic-imidazolate framework-derived N-self-doped porous carbons with ultrahigh theoretical adsorption
capacities for tetracycline and ciprofloxacin. J. Environ. Chem. Eng. 9, 104938 (2021).
53. Van Tran, T. et al. Combined minimum-run resolution IV and central composite design for optimized removal of the tetracycline
drug over metal–organic framework-templated porous carbon. Molecules 24, 1887 (2019).
54. Nguyen, D. T. C. et al. Biogenic synthesis of MgO nanoparticles from different extracts (flower, bark, leaf) of Tecoma stans (L.)
and their utilization in selected organic dyes treatment. J. Hazard. Mater. 404, 124146 (2021).
55. Barker, T. B. & Milivojevich, A. Quality by Experimental Design (Chapman and Hall, 2016).
56. Preu, M., Guyot, D. & Petz, M. Development of a gas chromatography-mass spectrometry method for the analysis of aminogly-
coside antibiotics using experimental design for the optimisation of the derivatisation reactions. J. Chromatogr. A 818, 95–108
(1998).
57. Torrades, F., Saiz, S. & García-Hortal, J. A. Using central composite experimental design to optimize the degradation of black
liquor by Fenton reagent. Desalination 268, 97–102 (2011).
58. Bakalyar, S. R., Bradley, M. P. T. & Honganen, R. The role of dissolved gases in high-perormance liquid chromatography. J. Chro-
matogr. 158, 277–293 (1978).
59. Sharif, K. M. et al. Experimental design of supercritical fluid extraction—A review. J. Food Eng. 124, 105–116 (2014).
60. Vera Candioti, L., De Zan, M. M., Cámara, M. S. & Goicoechea, H. C. Experimental design and multiple response optimization.
Using the desirability function in analytical methods development. Talanta 124, 123–138 (2014).
61. Meng, H., Hu, X. & Neville, A. A systematic erosion-corrosion study of two stainless steels in marine conditions via experimental
design. Wear 263, 355–362 (2007).
62. Reguer, S. et al. Structural evidence for the desalination of akaganeite in the preservation of iron archaeological objects, using
synchrotron X-ray powder diffraction and absorption spectroscopy. Corros. Sci. 51, 2795–2802 (2009).
63. Kabekkodu, S. N., Faber, J. & Fawcett, T. New Powder Diffraction File (PDF-4) in relational database format: Advantages and
data-mining capabilities. Acta Crystallogr. Sect. B Struct. Sci. 58, 333–337 (2002).
64. Costantini, I. et al. Comparison of semiquantification experimental methodologies using micro-Raman spectroscopy: Palme
software as an alternative tool for the study of salt efflorescence. J. Raman Spectrosc. 47, 1415–1421 (2016).
65. Veneranda, M. et al. FTIR spectroscopic semi-quantification of iron phases: A new method to evaluate the protection ability index
(PAI) of archaeological artefacts corrosion systems. Corros. Sci. 133, 68–77 (2018).
66. Scherrer, P. Kolloidchemie Ein Lehrbuch. Chemische Technologie in Einzeldarstellungen. in (ed. Scherrer, P.) 387–409 (Springer,
1912).
67. Cornell, R. M. & Giovanoli, R. Transformation of akaganeite into geothite and hematite in alkaline media. Clays Clay Miner. 38,
469–476 (1990).
68. Dillmann, P., Watkinson, D., Angelini, E. & Adriaens, A. Corrosion and Conservation of Cultural Heritage Metallic Artefacts
(Woodhead Publishing, 2013).
69. Bialik, M., Sedin, P. & Theliander, H. Boiling point rise calculations in sodium salt solutions. Ind. Eng. Chem. Res. 47, 1283–1287
(2008).
70. Antunes, R. A., Costa, I. & de Faria, D. L. A. Characterization of corrosion products formed on steels in the first months of atmos-
pheric exposure. Mater. Res. 6, 403–408 (2003).
71. Noordin, M. Y., Venkatesh, V. C., Sharif, S., Elting, S. & Abdullah, A. Application of response surface methodology in describing
the performance of coated carbide tools when turning AISI 1045 steel. J. Mater. Process. Technol. 145, 46–58 (2004).
Acknowledgements
This work has been funded by the DEMORA project (Grant No. PID2020-113391GB-I00), funded by the Span-
ish Agency for Research (through the Spanish Ministry of Science and Innovation, MICINN, and the European
Regional Development Fund, FEDER).
Author contributions
M.V. carried out the synthesis of akaganeite and redacted the manuscript. N.P.-T. performed chromatographic
analysis. J.A.C. performed ICP-MS analysis. I.C. performed FTIR semi-quantitative analysis. A.L. performed
XRD analysis and reviewed the manuscript. K.C. created the experimental designs. G.A. and J.M.M. acquired
the financial support for the project leading to this publication. All authors provided critical feedback and helped
shape the research and the manuscript.
Competing interests
The authors declare no competing interests.
Additional information
Supplementary Information The online version contains supplementary material available at https://doi.org/
10.1038/s41598-021-90006-y.
Correspondence and requests for materials should be addressed to M.V.
Reprints and permissions information is available at www.nature.com/reprints.
Publisher’s note Springer Nature remains neutral with regard to jurisdictional claims in published maps and
institutional affiliations.
Scientific Reports | (2021) 11:10789 | https://doi.org/10.1038/s41598-021-90006-y 11
Vol.:(0123456789)www.nature.com/scientificreports/
Open Access This article is licensed under a Creative Commons Attribution 4.0 International
License, which permits use, sharing, adaptation, distribution and reproduction in any medium or
format, as long as you give appropriate credit to the original author(s) and the source, provide a link to the
Creative Commons licence, and indicate if changes were made. The images or other third party material in this
article are included in the article’s Creative Commons licence, unless indicated otherwise in a credit line to the
material. If material is not included in the article’s Creative Commons licence and your intended use is not
permitted by statutory regulation or exceeds the permitted use, you will need to obtain permission directly from
the copyright holder. To view a copy of this licence, visit http://creativecommons.org/licenses/by/4.0/.
© The Author(s) 2021
Scientific Reports | (2021) 11:10789 | https://doi.org/10.1038/s41598-021-90006-y 12
Vol:.(1234567890)You can also read