Dispelling the Myth of a Pandemic of the Unvaccinated - February 1, 2022
←
→
Page content transcription
If your browser does not render page correctly, please read the page content below
Dispelling the Myth of a Pandemic of the
              Unvaccinated

                 February 1, 2022

          https://www.canadiancovidcarealliance.org/
Introduction

According to mainstream media, Ontario health data show that the unvaccinated are up to 60-

times more likely to end up in intensive care units (ICUs) with COVID-19 than the vaccinated .1-3

With alarming headlines, the media promoted a narrative that the unvaccinated are driving the

pandemic and increasing the burden on ICUs in Ontario. These headlines typically depict the

unvaccinated as careless vectors of disease, potentially dangerous and thus essentially

responsible for society's current COVID-19 plight. In this environment, vaccine mandates and

other public and private policies have been issued to the detriment of the unvaccinated that are

often based on real world cohort analyses of COVID-19 database such as the retrospective

review conducted by the Ontario Science Table (OST).4

Because such assertions have far-reaching consequences for both medical treatments as well

as civil rights, there is a need for a critical evaluation of the accuracy of the various claims, given

that they can lead to increasing stigmatization from both the public and various levels of

government against those who have chosen to not undergo vaccination against COVID-19. The

vaccines in question are those currently in use in Canada where two of four use mRNA

platforms, and the others use adenovirus-based delivery of DNA, from which mRNA is

generated. Each of these vaccines ultimately produce the spike protein of SARS-CoV-2, which

is presented on the surfaces of vaccinated cells. The following analysis will put the assumed

versus actual data into a more rigorous context with the goal of supporting informed decision

making at both an individual and health policy level.

                                                  1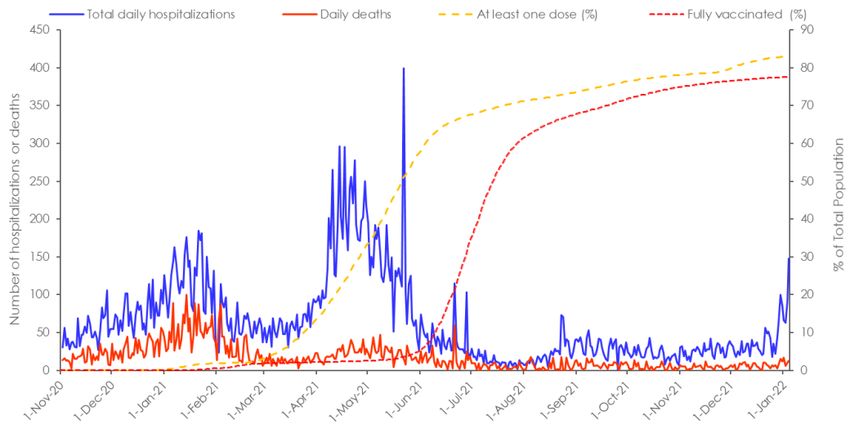
The practice of mass vaccination is based on the notion of “herd immunity”, in that when a high

percentage of the population has either contracted and recovered from any particular disease,

thus gaining natural immunity, or has gained sterilizing immunity through specific vaccinations,

the disease cannot spread further and should not be transmittable to those who have neither

form of immunity (e.g., unexposed or immunocompromised persons). Thresholds for attainment

of herd immunity vary depending on many factors including characteristics of the virus,

population and vaccines. Early modelling of COVID-19 vaccine impact showed that herd

immunity should be achievable when only 55% of the population has been vaccinated under

reasonably favorable conditions.5,6 Although the traditional definition of herd immunity included

both natural and vaccine-derived immunity, at the outset of the COVID-19 pandemic the World

Health Organization conveniently changed the definition of herd immunity to something that is

achieved almost entirely through vaccination.7

It is also worth noting that historically, vaccination alone has not been routinely successful in

providing long lasting herd immunity for some diseases, due to secondary vaccine failure.8-11

The latter may occur as immune responses in terms of levels of antibody levels, T cells, and

even memory cells decline over time.12-17 Long-lasting success of a vaccination campaign in

halting disease is almost exclusively dependent on the use of vaccines that confer sterilizing

immunity and do not suffer rapid secondary vaccine failure.18-21 Two doses of novel mRNA

COVID-19 vaccines by Pfizer or Moderna or the viral vector vaccine of AstraZeneca, in contrast

to those derived from conventional vaccine platforms, seem to exhibit a relatively rapid decline

in efficacy, and as such can be characterized as “leaky”, with outbreaks occurring over short

time periods even in the fully vaccinated.22 In addition, it is increasingly clear that individuals

receiving COVID-19 vaccines can become re-infected or experience breakthroughs, as well as

transmit the virus to others.23-26 Moreover, any efficacy initially promoted for these vaccines was

                                                   2
based on PCR-confirmed symptomatic infection against the original Wuhan strain, and we
currently lack proper assessment of transmission-blocking efficacy of the vaccine against
emerging COVID-19 variants.27-34 Most tests of antibody efficacy are based on assessing the
extent to which vaccinal antibodies interfere with the binding of the SARS-CoV-2 spike protein
to the host cell receptor ACE2. In the variants, mutations within the receptor binding domain
may enhance the binding to ACE2, but reduce recognition by specific antibodies that target this
region. However, immune responses are directed against many different regions of the spike
protein, and binding of antibodies to these regions can also confer significant immune
protection. In any event, it is misleading to insist, as often do the media or the OST, that mass
vaccination with COVID-19 vaccines will be effective over the long term or that they will be a
means of achieving herd immunity. This becomes even more problematic when failure of the
vaccines to block transmission is blamed on the unvaccinated.
The following analysis of the Public Health Ontario and Government of Ontario, Ministry of
Health COVID-19 databases demonstrate that the current vaccine strategy is ineffective and
even harmful, and that Health Care Officials in Ontario and elsewhere must stop blaming the
unvaccinated and focus instead on more effective policies to help navigate the pandemic. It will
focus on three areas of concern: the methodology of the studies used to support current policy,
the lack of effectiveness of current vaccination policy, and how current policy has neglected to
consider vaccine safety.
Methods
Total and daily COVID-19 cases, total hospitalizations and deaths data were obtained from the
“Full COVID-19 Summary Data for Ontario” datasheet available at the Public Health Ontario
(PHO) COVID-19 Data Tool webpage35 on January 5, 2022. In this dataset, hospitalization
numbers include all cases reported as ever being hospitalized during their infection. Daily
3hospitalizations were calculated from the difference between total hospitalizations for the index
date and the previous day. Similarly, the number of daily deaths were calculated from the
difference between total deaths reported for the index date and the previous day. The number of
daily COVID-19 cases, case rates (per 100,000, 7-day average), individuals in intensive care
units (ICU) and in hospital (excluding ICU) due to COVID-19 by vaccination status, and
individuals with at least one, two (fully vaccinated) or three (boosters) vaccine doses were
obtained from the “COVID-19 Vaccine Data in Ontario” datasheets available at the Government
of Ontario Data Catalogue 36 on January 5, 2022. Number of individuals in ICU and in hospital
excluding ICU were combined in order to obtain the total number of individuals in hospital due to
COVID-19 by vaccination status. Daily mean temperature at Toronto International Airport was
obtained from the Government of Canada, Historical Weather and Climate Data webpage for
the TORONTO INTL A, ONTARIO station37 on January 5, 2022. Data from all sources where
combined, organized, processed, and plotted in Excel. While index dates for the Government of
Ontario Data Catalogue were reporting dates with numbers indexed to the day in which
numbers were released, PHO data were indexed to the day prior (of data collection). This
caused a one-day shift between datasets that became apparent when trying to use them
together. To harmonize the datasets, data collection dates were used as index dates for both
datasets.
Findings
1) Concerns Regarding Study Methodology of Supporting Evidence
The strength of a medical recommendation should rest on the level of evidence on which it is
based. The highest level of evidence comes from a double-blinded randomized Phase III trial
showing benefits against a standard of care in a specific population. 38 In contrast, retrospective
analyses are unable to control for the influence of confounding variables and thus are more
4effectively used to generate hypotheses that can later be validated in prospective controlled
trials. Such analyses should not be used to support mandatory treatment recommendations.39
For example, retrospective analyses must be appropriately interpreted by considering the
completeness of the data set, the terminology used, and the monitoring protocols, as well as the
methods employed and verifiable assumptions.
Data Completeness
Population based COVID-19 registries are designed to collect data on COVID status, but not
data on hospitalization events.36,40 Presently we know that the Canadian COVID-19 database
preferentially captures data on symptomatic individuals and almost certainly underrepresents
those who refuse or are not required to undergo testing or those who are asymptomatic.41 For
this reason, any such results should be extrapolated with caution when considering mildly
symptomatic or asymptomatic individuals.
Conducting an analysis on COVID-19 hospitalization outcomes would require merging the
COVID-19 database with one that is able to capture hospital level events, and as such the
completeness of hospital data captured would need to be taken into consideration to ensure
reliability of the outcomes. Likewise, data would need to be interpreted in light of differences in
monitoring or sampling across vaccination groups. Comparing outcomes by vaccination groups
assumes these groups are homogeneous. However, there may have been multiple differences
between groups, including natural immunity, disease exposure, and risk of severe disease. In
Toronto, from January 1st to July 31st 2020, there were just under 1,000 hospitalized COVID-19
cases in the 70+ age group and just over 600 hospitalizations in the 50-69 age group.42 Aside
from age, underlying medical conditions such as “obesity, diabetes with complication and
anxiety disorders were the strongest risk factors for severe COVID-19 illness”.43 As details
5about other potentially relevant variables were not provided by Public Health Ontario, caution
should be used when ascribing differences in observed outcomes to vaccination status alone.
Terminology
Another factor to consider is the definitions used to describe vaccination status. Public Health
Ontario defines vaccination status based on immunity achieved 14 days after any second
dose,44 contradicting at least one company, Pfizer, that in the Phase III trial asserted that
immunity can be established after 7 days.45 It follows that fully vaccinated individuals will be
considered partially vaccinated up to 14 days after their shot, and individuals receiving their first
dose will be categorized as unvaccinated up to 14 days later. These overlapping definitions
confound interpretation of outcomes as many vaccinated individuals will be classified as
unvaccinated, thus inflating the numbers of the latter and making it difficult to distinguish
differences in disease status and health outcomes (e.g., infection, hospitalization, deaths)
among vaccinated and unvaccinated.
Monitoring
The main test used to date in Ontario and elsewhere in Canada is the PCR (Polymer Chain
Reaction) assay, a test which detects genetic fragments of the SARS-CoV-2 virus in tested
individuals. Of note, when a cycle threshold (Ct) higher than 20 cycles is used to determine
COVID-19 positivity, there is a very high likelihood of false positives, i.e., that a person testing
positive does not actually have an active and transmissible infection. 46 This limitation is now
acknowledged by the Centers for Disease Control and Prevention (CDC). 47 For example, a Ct
cut-off for positivity over 35 (Public Health Ontario officially uses a Ct of 35)48 may result in up to
a 85% false positive rate.49 If these Ct levels are then used to describe “cases”, and
asymptomatic low probability persons are most of tests conducted, it will inevitably generate
inflated case numbers. Moreover, someone with COVID-19 may only be infectious between 4
6and 8 days, but may test “positive” between 22 and 33 days, introducing the possibility that a
single infection may be recorded as more than one case.46
Given our current vaccine mandate climate, unlike their vaccinated counterparts, unvaccinated
workers often have to undergo systematic asymptomatic testing.50-53 This increase in sampling
will invariably result in higher case counts in this population, based on the limitations of the PCR
test, as well as the fact the data collection systems may not be able to eliminate multiple counts
of the same infection.54,55 It is also unclear whether there are differences in testing requirements
between hospitalized individuals based on vaccination status. However, in this closely
monitored population, any differences in policy based on vaccination status would likely impact
outcomes, especially if there were financial incentives associated with testing or treating
COVID-19 patients. Moreover, it is well established that SARS CoV-2 is transmitted more
readily in communal living environments such as hospitals.56 When interpreting the data, it is
important to distinguish between individuals who were in the hospital for some non-COVID-19
related reason and test positive for SARS CoV-2 compared to those who are in the hospital due
to a COVID-19 infection. As it is often unclear what Ct was used and whether there were
differences in monitoring based on vaccination status thus Ontario COVID-19 data showing
differences between the vaccinated and unvaccinated should be interpreted with great caution.
Study Design and Analysis
Retrospective reviews of the COVID-19 database are helpful for identifying potential
associations between various events, but as they cannot control for differences in baseline
factors, monitoring, or exposure, they are unreliable, and ideally their use should be limited to
hypothesis generation leading to confirmation in a well-conducted clinical trial.57,58 Most
importantly, their role in inferring causality is limited, and therefore care should be taken in using
them to support major health policy decisions.
7COVID-19 Risk Factors
There are some well-established factors that either increase risk of severe COVID-19 outcomes
such as older age, obesity, diabetes co-morbidities,43,59 or lower risk of severe disease such as
naturally acquired prior immunity60 and younger age.61 As analyses are not always randomized
and do not control for baseline factors, it is quite possible that differences in such factors in
vaccinated and unvaccinated populations could be partially, or fully, driving the claimed effects.
For instance, it is probable that those with naturally acquired immunity and those who have
been ineligible for vaccination such as children under 12 years of age could be represented in
higher proportions in the unvaccinated population, while the elderly and those at risk of severe
disease would be more likely represented in the vaccinated group.
2) Concerns Regarding Effectiveness of Current Vaccination Policy
There have been three waves of COVID-19 cases from Nov 1, 2020 to January 4, 2022 after the
initial wave in the spring of 2020 (Figure 1). The second and third waves peaked above 4,000
cases per day in Ontario each before receding and occurred over the colder months beginning in
November 2020, declining with warmer summer weather. Unlike the second and third waves, the
fourth wave began at the height of the warmer summer weather in August, with an initial rise up
to 1,000 cases per day in early September, before dramatically shooting up to an unprecedented
18,000 cases per day by early January, more than 4-fold the size of prior peaks. As noted above,
herd immunity should be achieved with a highly effective vaccine once some 50% of the
population is immune. In this regard it should be noted that the third wave was receding before
the 50% vaccination threshold was reached for the first shot in early May and that the shape of
the decline of the curve did not change after this threshold was achieved. Such data suggest that
natural immunity rather than vaccine-induced immunity was the driving factor in the decline of the
third wave.
8By early August 2021 at least 65% of the population had been fully vaccinated, and by mid-
November 2021 the number was as high as 75% and slowly increasing over to 78% by early
January 2022. Administration of booster (third) doses started in September 2021, with an uptake
of about 28% by January 4, 2022. High rates of full vaccination could explain the minimal rise in
daily cases seen from August to September but the rise in cases could also be explained by a
shift in monitoring and sampling resulting from back-to-work and school policies requiring
increased systematic testing of asymptomatic unvaccinated individuals.50 It is notable that
analyses justifying vaccine mandates conducted by the Ontario Science Table were conducted
within this window and were likely heavily influenced by the differential testing policies. It should
be noted that daily case counts began to sharply increase with the drop in temperature in
November and December 2021, similar to the seasonal shifts in respiratory disease observed in
the previous year and seemingly at variance with increasing levels of vaccination for the overall
population. It is precisely these sorts of outcomes that led to claims, in late August and early
September, that the unvaccinated were driving the bulk of new infections and threatening ICU
capacities and that vaccine passports were required to limit the unvaccinated individuals from
entering public spaces to halt further disease spread.
9Figure 1: COVID-19 cases and deaths (data source: Public Health Ontario),35 vaccination status
in Ontario (data source: Government of Ontario, Ministry of Health, COVID-19 data catalog)36 and
mean temperature at Toronto International Airport (data source: Government of Canada,
Historical Weather and Climate Data for the TORONTO INTL A, Ontario station) 37 from November
1, 2020 to January 4, 2022.
In Figure 2A, daily COVID-19 case counts by vaccination status are plotted from Aug 8, 2021 to
January 4, 2022. These data also lead to reports, as cited above, that this was a pandemic of the
unvaccinated. However, when cases in the unvaccinated were compared to those who had
received the vaccine, the differences in case counts and rates were low and steady leading up to
early October, at which point case counts in the two groups began to overlap and then by early
December a surge in daily cases in the fully vaccinated typical of the infectious peaks of earlier
waves was clearly apparent. By early January, at the peak of the time period studied, the number
of cases in the vaccinated were 6-fold higher than in unvaccinated. It is important to note that
10unvaccinated individuals represent 20% of the population and that, children 11 years or younger,
representing 15% of the population, are the largest demographic in the unvaccinated group. As
COVID-19 vaccines were approved in Canada on November 19, 2021 for children 5 – 11 years
old for most of the time period studied, this group was ineligible for vaccination. 64 As case counts
were 6-fold higher in the fully vaccinated group compared to the unvaccinated group by mid to
late December, the Ontario data does not provide compelling support for policy decisions
recommending the vaccination of children younger than 11 years. At this time, the proportion of
cases in the fully vaccinated had surpassed that of unvaccinated (7-day average: 87.89 per 100k
vs 66.15 per 100,000, respectively), reflecting a higher degree of infectivity (Figure 2B). As
currently the vast majority of the cases are estimated to be caused by the new Omicron variant,
for the week of December 12 th-18th 2021, Omicron was estimated to make up 66.1% of Ontario
cases, rising to an estimate of 97.5% of positive Ontario cases the week of December 26 th 2021–
January 1, 2022.62 It is apparent that the vaccine designed to combat the original Wuhan strain
has become obsolete. Although increased infection rates in this group could be due to the
vaccinated engaging in higher risk activities than the unvaccinated, it also possible that it shows
vaccine enhanced disease, a concern raised in the Pfizer Safety Report.63
A
11B
Figure 2: (A) Number of cases and (B) 7-day averaged case rates by vaccination status in Ontario
from Aug 8, 2021 to Jan 4, 2022. Data source: Government of Ontario, Ministry of Health, COVID-
19 data catalog.36
Hospitalization Admissions and Death
Daily COVID-19 hospitalizations and deaths are plotted from November 1, 2020 to January 4,
2022 in Figure 3. Hospitalization admissions peaked at 200 admissions during the second wave,
between 300 and 400 admissions for the third wave and were lowest for the fourth wave peaking
at 148 on Jan 4, 2022. Likewise, COVID-19 deaths peaked at 100 deaths per day during the
second wave, were as low as 50 deaths per day in the third wave and as of January 4, 2022,
deaths for the fourth wave have not reached more than 13 deaths per day despite the dramatic
surge in cases in December.
12Figure 3: COVID-19 hospitalizations and deaths (data source: Public Health Ontario)35 and
vaccination status (data source: Government of Ontario, Ministry of Health, COVID-19 data
catalog)36 in Ontario from November 1, 2020 to January 4, 2022.
As mentioned, it is possible that the lower death rates could be attributed to increasing rates of
partial vaccination of high-risk populations from March to July, serving to prevent more severe
COVID-19 outcomes, including deaths. However, we find this interpretation unlikely, as only 35%
of the population were vaccinated at that point and many were the elderly who are known to be
immunosenescent, meaning that they have a dysregulated immune system that makes it more
difficult for them to develop sterilizing immunity and leaves them more susceptible to infection.65
However, this uncoupling could also be attributed to a lower net number of individuals who might
have been at risk of death from the disease: During the first and second waves, as the majority
of deaths due to COVID-19 were in long-term care facilities.66,67 Death rates were high in these
facilities largely because many facilities were under resourced and ill-equipped to stop aerosol
transmission of SARS-CoV-2 among residents.68-72 This, coupled with the fact that many
individuals within these facilities were at risk of severe disease,68,69,71,73 that early treatment was
13not provided to residents, and they experienced reduced rates of healthcare utilization when they
needed the most,74 and that 35% of residents had no hospitalization orders and 80% had do not
resuscitate orders made outbreaks in these facilities more likely to be fatal.66,67
By the beginning of the third wave many of those who were at risk of death from COVID-19 had
either developed immunity or had passed away, limiting the number of those vulnerable to
infection. Many vulnerable residents died due COVID-19 infections, others died due to failure to
thrive from being isolated for a full year, and another contingent may have died due to vaccine-
related injury from being given vaccines that were not well studied in this group.75 A CDC report
on the VAERS system published in early 2021 reported that 69% of all reported vaccine-emergent
deaths were in people living in long-term care facilities and occurred a median of 2 days after
vaccination.76 Although it is possible that the vaccines may have had some protective effect in
high-risk populations, it is equally possible that failed health policy related to lockdowns and mass
vaccination of elderly populations were also contributing factors.
Hospitalizations and ICU due to COVID-19 by Vaccination Status
Total in hospital and ICU due to COVID-19 by vaccination status were plotted from Aug 8, 2021
to January 4, 2022 (Figure 4). The number of patients in hospital peaked at 526 during the early
part of the time period studied, but by January 4, 2022 the number COVID-19 hospitalizations
had reached up to 2,000. Although it had increased by at least 3-fold it remained considerably
below the 21,000 total number of acute care beds available in Ontario.77 The number of people in
ICU remained low and did not surpass more 200 beds during the time period studied, did not
come close to approaching the ICU capacity for Ontario of 2,343 beds.40 Although there were
more unvaccinated compared to vaccinated people in the ICU throughout the initial time period
14studied number of admissions in the vaccinated rose progressively, to the point that on January
4, 2022, the number of vaccinated in ICU was very similar to that of unvaccinated (N= 109 vs 100)
with ICU admissions still on the rise.
A
B
15Figure 4: COVID-19 (A) Total hospitalized and (B) in ICU due to COVID-19 by vaccination status
in Ontario from August 8, 2021 to Jan 4, 2022. Data source: Government of Ontario, Ministry of
Health, COVID-19 data catalog36
Although it is possible that the vaccines were conferring protection from August through to the
end of October, reducing the risk of severe disease and resulting in lower numbers of people in
hospitalization or in ICU, such an interpretation does not explain why counts among the
vaccinated and unvaccinated were comparably low even with counts only increasing in early
November. An alternative explanation could be that differences seen in early August to late
October are reflective of changes in vaccination policies requiring systematic testing of
asymptomatic unvaccinated individuals. Such differences would be particularly apparent in
settings such as hospitals where patients are closely monitored and may have heavily influenced
the number of counts seen in this population. Additionally, as COVID-19 is transmitted in shared
community living situations such as hospitals, events among the unvaccinated may be a by-
product of hospital admission. In fact the ministry of health recently indicated that almost half of
the COVID-19 hospitalizations were people who were admitted to the hospital with another
condition and tested positive with COVID-19 rather than people in the hospital due to COVID-
1941. Although it is possible that the slight initial rise in people in hospital and ICU may reflect
vaccine efficacy, the consistently low and comparable rates among the vaccinated and
unvaccinated may more strongly reflect differences in monitoring and sampling more than
differences in infectivity.
16Another notable observation from this data is that despite surges in COVID-19 cases, total people
in hospital and ICU remained low, suggesting that the new variant is either less virulent, that a
clinically meaningful population level of immunity has now been achieved, or that there are fewer
people at risk of severe disease either due to death or immunity . Regardless of the explanation,
the findings to date call into question the need for further lockdowns and boosters.
3) Concerns Regarding the Safety of Current Vaccine Policies
The most significant limitation of retrospective analyses of real-world COVID-19 events is that
they fail to weigh the benefits of vaccination against potential risks of vaccination. Randomized
placebo controlled trials are the most reliable source of safety and efficacy data available. The 6
month data from the Pfizer phase III trial (Table 1) showed that receipt of the BNT1626b2 vaccine
increased both the absolute (17.9%) and relative (299.7%) risk of experiencing a vaccine-related
adverse event among fully vaccinated adults. 45 The study also reported relative (74.6%) and
absolute (0.5%) increases in severe adverse events, events that affect daily activity, require
medical intervention or hospitalization. Likewise, there were also relative (9.5%) and absolute
(0.05%) risk increases in serious adverse event, events that require hospitalization, were life-
threatening, or resulted in persistent disability or death. When deaths were considered for
both the blinded and open-label periods of the study there was an increase in deaths on the
vaccine arm compared to the placebo arm (20 deaths vs 14 deaths), many of which were
cardiovascular in nature (9 deaths vs 5 deaths). Although the phase trials reported relative risk
reductions in symptomatic COVID-19 cases (90.9%) and severe COVID-19 cases (95.7%) with
BNT1626b2 compared to placebo, the absolute risk reductions were modest (any 3.7% and
severe 0.1%) and lower than the absolute risk increases in adverse events (any 17.8%, severe
0.05%). When the absolute benefit of the vaccine is compared to the absolute risk, it appears that
the vaccine and by extension current vaccine policy may be doing more harm than good.
17Absolute
BNT162b2 Placebo Absolute Relative
Event Difference Risk Risk
(n) (n) Change* (%) Change* (%)
(p-value)?
-773
Cases Fully Vaccinated Adults and
77 850 -3.7 -90.9
Adolescents 7 days after 2nd dose$ (pAlthough there is a sophisticated system in place to monitor and track COVID-19 events, COVID-
19 Ontario relies on a national passive surveillance system to capture adverse events. This
system launched decades ago, is burdensome, heavily audited and provides no financial
compensation to clinicians for the considerable time required to complete the reports. Moreover,
assertions on the part of public health officials claiming vaccine safety may make clinicians and
vaccine recipients alike less likely to attribute an injury to the vaccine and thus make them less
likely to report.
The phase III trials report a solicited adverse event rate of up to 78% and a severe adverse event
rate of 5% within 7 days of a given dose (Figure 5). However, Health Canada’s passive
surveillance system reports an event rate of 0.1% for vaccine recipients.78 This suggests that the
passive reporting system is largely inadequate for monitoring COVID-19 vaccine safety and that
there are likely a significant number of Canadians experiencing adverse effects from these
vaccines which are not being factored into our policy decision-making.
Figure 5: Rate of solicited and unsolicited adverse events in active surveillance studies of
COVID-19 vaccines (NCT04368728 and v-safe) and proportion of adverse events following
COVID-19 vaccination reported to passive surveillance systems (VAERS, 79 Health Canada78 and
UK Yellow Card80) relative to total vaccinated (≥1 dose) population.
19Conclusion
Although health officials claim that the unvaccinated are driving infection rates and threatening
to overload our ICU capacity, and that for this reason vaccine mandates are necessary to
manage hospital capacity, a careful inspection of the actual data does not support those claims.
First, we see that the type of analysis conducted to support these policies is based on low levels
of evidence and on studies that are highly subject to bias. These studies show that although
COVID-19 cases were higher among the unvaccinated from August through to mid-October, by
early December it was clear that the majority of cases were among the vaccinated and that this
surge in cases resulted in a higher proportion of vaccinated compared to unvaccinated
individuals in the hospital or ICU admissions despite vaccine mandates and high vaccine uptake
rates. Finally, the policy did not adequately weigh the benefits of vaccination against the risks of
vaccination which shows that the vaccines do more harm (ARI of 17.9% and 0.5%) than good
(ARR of 3.7% and 0.1%).45 In other areas of medicine we are optimizing care through scientific
discourse and inquiry, reliance on the highest levels of evidence, personalized approaches to
care, and informed consent.81-83 Now that deaths and hospitalizations are largely uncoupled
from case counts due to either high levels of immunity or the arrival of less virulent COVID-19
strains like Omicron, is it not time to end vaccine mandates and return to the established
standards of care and excellence in medicine?
References
1. Young L. Unvaccinated 60 times more likely to end up in ICU with COVID-19, Ontario
data shows. GlobalNews.ca, 2021. (Accessed January 29, 2022, at
https://globalnews.ca/news/8230051/covid-vaccine-hospitalization-risk-ontario/.)
2. Dunham J. Unvaccinated? Here are some of the things that are off-limits to you in
Canada. ctvnews.ca, 2021. (Accessed January 29, 2022, at
https://www.ctvnews.ca/health/coronavirus/unvaccinated-here-are-some-of-the-things-that-are-
off-limits-to-you-in-canada-1.5553655.)
203. Morgan G. Most COVID vaccinated Canadians mistrustful of the unvaccinated and
medical exemptions: poll. nationalpost.com, 2021. (Accessed January 29, 2022, at
https://nationalpost.com/news/canada/most-covid-vaccinated-canadians-mistrustful-of-the-
unvaccinated-and-medical-exemptions-poll.)
4. Science Table - COVID-19 Advisory for Ontario. Update on COVID-19 Projections -
Science Advisory and Modelling Consensus Tables. covid19-sciencetable.ca, 2021. (Accessed
January 29, 2022, at https://covid19-sciencetable.ca/wp-content/uploads/2021/09/Update-on-
COVID-19-Projections_2021.09.28_English-2.pdf.)
5. Hogan A, Winskill P, Watson O, et al. Report 33: modelling the allocation and impact of
a COVID-19 vaccine. imperial.ac.uk, 2020. (Accessed January 29, 2022, at
https://www.imperial.ac.uk/mrc-global-infectious-disease-analysis/covid-19/report-33-vaccine/.)
6. Phillips N. The coronavirus is here to stay-here’s what that means. Nature
2021;590:382-4.
7. Preparedness WTE. Coronavirus disease (COVID-19): Serology, antibodies and
immunity. WHO.int, 2020. (Accessed January 29, 2022, at https://www.who.int/news-
room/questions-and-answers/item/coronavirus-disease-covid-19-serology.)
8. Mathias RG, Meekison WG, Arcand TA, Schechter MT. The role of secondary vaccine
failures in measles outbreaks. Am J Public Health 1989;79:475-8.
9. Zhang Z, Chen M, Ma R, Pan J, Suo L, Lu L. Outbreak of measles among persons with
secondary vaccine failure, China, 2018. Hum Vaccin Immunother 2020;16:358-62.
10. Connell AR, Connell J, Leahy TR, Hassan J. Mumps Outbreaks in Vaccinated
Populations—Is It Time to Re-assess the Clinical Efficacy of Vaccines? Front Immunol 2020;11.
11. Edmonson MB, Addiss DG, McPherson JT, Berg JL, Circo SR, Davis JP. Mild Measles
and Secondary Vaccine Failure During a Sustained Outbreak in a Highly Vaccinated Population.
JAMA 1990;263:2467-71.
12. Vygen S, Fischer A, Meurice L, et al. Waning immunity against mumps in vaccinated
young adults, France 2013. Euro Surveill 2016;21:30156.
13. Lewnard JA, Grad YH. Vaccine waning and mumps re-emergence in the United States.
Sci Transl Med 2018;10.
14. Duintjer Tebbens RJ, Pallansch MA, Chumakov KM, et al. Expert review on poliovirus
immunity and transmission. Risk Anal 2013;33:544-605.
15. Koopman JS, Henry CJ, Park JH, Eisenberg MC, Ionides EL, Eisenberg JN. Dynamics
affecting the risk of silent circulation when oral polio vaccination is stopped. Epidemics
2017;20:21-36.
16. Burdin N, Handy LK, Plotkin SA. What Is Wrong with Pertussis Vaccine Immunity? The
Problem of Waning Effectiveness of Pertussis Vaccines. Cold Spring Harb Perspect Biol
2017;9.
17. Heffernan JM, Keeling MJ. An in-host model of acute infection: measles as a case study.
Theor Popul Biol 2008;73:134-47.
18. Focosi D, Maggi F, Casadevall A. Mucosal Vaccines, Sterilizing Immunity, and the
Future of SARS-CoV-2 Virulence. Viruses 2022;14:187.
19. Pollard AJ, Bijker EM. A guide to vaccinology: from basic principles to new
developments. Nature Reviews Immunology 2021;21:83-100.
20. Yewdell JW. Individuals cannot rely on COVID-19 herd immunity: Durable immunity to
viral disease is limited to viruses with obligate viremic spread. PLoS Pathog 2021;17:e1009509.
21. Hellerstein M. What are the roles of antibodies versus a durable, high quality T-cell
response in protective immunity against SARS-CoV-2? Vaccine X 2020;6:100076.
22. Scott J, Richterman A, Cevik M. Covid-19 vaccination: evidence of waning immunity is
overstated. BMJ 2021;374:n2320.
23. Read AF, Mackinnon MJ. Pathogen evolution in a vaccinated world. Evolution in health
and disease 2008;2:139-52.
2124. Keeling M, Tildesley M, House T, Danon L. The mathematics of vaccination. Math Today
2013;49:40-3.
25. Read AF, Baigent SJ, Powers C, et al. Imperfect vaccination can enhance the
transmission of highly virulent pathogens. PLoS Biol 2015;13:e1002198.
26. Brown CM, Vostok J, Johnson H, et al. Outbreak of SARS-CoV-2 infections, including
COVID-19 vaccine breakthrough infections, associated with large public gatherings—Barnstable
County, Massachusetts, July 2021. Morb Mortal Weekly Rep 2021;70:1059.
27. Reis BY, Barda N, Leshchinsky M, et al. Effectiveness of BNT162b2 Vaccine against
Delta Variant in Adolescents. N Engl J Med 2021;385:2101-3.
28. Thiruvengadam R, Awasthi A, Medigeshi G, et al. Effectiveness of ChAdOx1 nCoV-19
vaccine against SARS-CoV-2 infection during the delta (B.1.617.2) variant surge in India: a test-
negative, case-control study and a mechanistic study of post-vaccination immune responses.
Lancet Infect Dis 2021.
29. Lopez Bernal J, Andrews N, Gower C, et al. Effectiveness of Covid-19 Vaccines against
the B.1.617.2 (Delta) Variant. N Engl J Med 2021;385:585-94.
30. Torgovnick J. Effectiveness of Covid-19 Vaccines against the B.1.617.2 (Delta) Variant.
N Engl J Med 2021.
31. Dejnirattisai W, Shaw RH, Supasa P, et al. Reduced neutralisation of SARS-COV-2
Omicron-B.1.1.529 variant by post-immunisation serum. medRxiv 2021:2021.12.10.21267534.
32. Collie S, Champion J, Moultrie H, Bekker L-G, Gray G. Effectiveness of BNT162b2
Vaccine against Omicron Variant in South Africa. N Engl J Med 2021.
33. Singanayagam A, Hakki S, Dunning J, et al. Community transmission and viral load
kinetics of the SARS-CoV-2 delta (B.1.617.2) variant in vaccinated and unvaccinated individuals
in the UK: a prospective, longitudinal, cohort study. Lancet Infect Dis 2021;22:183-95.
34. Keegan LT, Truelove S, Lessler J. Analysis of Vaccine Effectiveness Against COVID-19
and the Emergence of Delta and Other Variants of Concern in Utah. JAMA Network Open
2021;4:e2140906-e.
35. Public Health Ontario. Ontario COVID-19 Data Tool. publichealthontario.ca, 2022.
(Accessed January 29, 2022, at https://www.publichealthontario.ca/en/data-and-
analysis/infectious-disease/covid-19-data-surveillance/covid-19-data-tool?tab=summary.)
36. Government of Ontario. Ontario Data Catalogue - COVID-19 Vaccine Data in Ontario.
ontario.ca, 2022. (Accessed January 29, 2022, at https://data.ontario.ca/dataset/covid-19-
vaccine-data-in-ontario.)
37. Government of Canada. Historical Weather and Climate Data for Toronto International A
Station. climate.weather.gc.ca, 2022. (Accessed January 29, 2022, at
https://climate.weather.gc.ca/climate_data/daily_data_e.html?StationID=51459.)
38. Misra S. Randomized double blind placebo control studies, the "Gold Standard" in
intervention based studies. Indian J Sex Transm Dis AIDS 2012;33:131-4.
39. Talari K, Goyal M. Retrospective studies - utility and caveats. J R Coll Physicians Edinb
2020;50:398-402.
40. Government of Ontario. COVID-19: Hospitalizations. ontario.ca, 2021. (Accessed
December 28, 2021, at https://COVID-
19.ontario.ca/data/hospitalizations#hospitalizationsByICUBed.)
41. Public Health Ontario. Confirmed Cases of COVID-19 Following Vaccination in Ontario:
December 14, 2020 to January 16, 2022. publichealthontario.ca, 2022. (Accessed January 29,
2022, at https://www.publichealthontario.ca/-/media/documents/ncov/epi/covid-19-epi-
confirmed-cases-post-vaccination.pdf?sc_lang=en.)
42. City of Toronto. COVID-19: Epidemiological Summary of Cases - Which COVID-19
cases required medical attention? toronto.ca, 2022. (Accessed January 29, 2022, at
https://www.toronto.ca/home/covid-19/covid-19-pandemic-data/covid-19-epidemiological-
summary-of-cases-data/.)
2243. Kompaniyets L, Pennington AF, Goodman AB, et al. Underlying Medical Conditions and
Severe Illness Among 540,667 Adults Hospitalized With COVID-19, March 2020-March 2021.
Prev Chronic Dis 2021;18:E66.
44. Ontario Ministry of Health. COVID-19 Fully Vaccinated and Previously Positive
Individuals: Case, Contact and Outbreak Management Interim Guidance. health.gov.on.ca,
2021. (Accessed January 29, 2022, at
https://www.health.gov.on.ca/en/pro/programs/publichealth/coronavirus/docs/contact_mngmt/C
OVID-19_fully_vaccinated_interim_guidance.pdf.)
45. Thomas SJ, Moreira ED, Kitchin N, et al. Safety and Efficacy of the BNT162b2 mRNA
Covid-19 Vaccine through 6 Months. N Engl J Med 2021;385:1761-73.
46. Mina MJ, Peto TE, García-Fiñana M, Semple MG, Buchan IE. Clarifying the evidence on
SARS-CoV-2 antigen rapid tests in public health responses to COVID-19. The Lancet
2021;397:1425-7.
47. Centers for Disease Control and Prevention. Frequently Asked Questions about
Coronavirus (COVID-19) for Laboratories - Interpreting Results of Diagnostic Tests. 2021.
(Accessed October 29, 2021, at https://www.cdc.gov/coronavirus/2019-
ncov/lab/faqs.html#Interpreting-Results-of-Diagnostic-Tests.)
48. Public Health Ontario. Explained: COVID-19 PCR Testing and Cycle Thresholds.
publichealthontario.ca, 2021. (Accessed January 31, 2022, at
https://www.publichealthontario.ca/en/about/blog/2021/explained-covid19-pcr-testing-and-cycle-
thresholds.)
49. Public Health Ontario. An Overview of Cycle Threshold Values and their Role in SARS-
CoV-2 Real-Time PCR Test Interpretation. publichealthontario.ca, 2020. (Accessed January 29,
2022, at https://www.publichealthontario.ca/-/media/documents/ncov/main/2020/09/cycle-
threshold-values-sars-cov2-pcr.pdf?la=en.)
50. Government of Ontario Ministry of Health. Management of Cases and Contacts of
COVID-19 in Ontario August 11, 2021 (version 13.0) health.gov.on.ca, 2021. (Accessed
January 29, 2022, at
https://www.health.gov.on.ca/en/pro/programs/publichealth/coronavirus/docs/contact_mngmt/m
anagement_cases_contacts.pdf.)
51. CBC News. Ontario announces mandatory vaccine plans for health, education workers;
3rd doses for some. cbc.ca, 2021. (Accessed January 29, 2022, at
https://www.cbc.ca/news/canada/toronto/ontario-covid-vaccines-requirement-health-care-
education-1.6143378.)
52. Herhalt C. Unvaccinated Ontario teachers must submit to twice weekly COVID-19 testin.
toronto.ctvnews.ca, 2021. (Accessed January 29, 2022, at
https://toronto.ctvnews.ca/unvaccinated-ontario-teachers-must-submit-to-twice-weekly-covid-19-
testing-1.5574333.)
53. Pringle J. Unvaccinated Ottawa police employees must undergo testing every three days
under COVID-19 vaccine policy. ottawa.ctvnews.ca, 2021. (Accessed January 29, 2022, at
https://ottawa.ctvnews.ca/unvaccinated-ottawa-police-employees-must-undergo-testing-every-
three-days-under-covid-19-vaccine-policy-1.5634864.)
54. Public Health Ontario. Trends of COVID-19 Incidence in Ontario publichealthontario.ca,
2021. (Accessed January 29, 2022, at https://www.publichealthontario.ca/-
/media/documents/ncov/epi/covid-19-epi-trends-incidence-ontario.pdf?sc_lang=en.)
55. Goodfield K. Ontario records 745 new COVID-19 cases, 14 deaths while citing data
issue. toronto.ctvnews.ca, 2021. (Accessed January 29, 2022, at
https://toronto.ctvnews.ca/ontario-records-745-new-covid-19-cases-14-deaths-while-citing-data-
issue-1.5292064.)
56. Morawska L, Tang JW, Bahnfleth W, et al. How can airborne transmission of COVID-19
indoors be minimised? Environ Int 2020;142:105832.
2357. Ranstam J. Hypothesis-generating and confirmatory studies, Bonferroni correction, and
pre-specification of trial endpoints. Acta Orthop 2019;90:297-.
58. Mann CJ. Observational research methods. Research design II: cohort, cross sectional,
and case-control studies. Emerg Med J 2003;20:54-60.
59. Kompaniyets L, Goodman AB, Belay B, et al. Body mass index and risk for COVID-19–
related hospitalization, intensive care unit admission, invasive mechanical ventilation, and
death—united states, march–december 2020. Morb Mortal Weekly Rep 2021;70:355.
60. Cohen KW, Linderman SL, Moodie Z, et al. Longitudinal analysis shows durable and
broad immune memory after SARS-CoV-2 infection with persisting antibody responses and
memory B and T cells. Cell Rep Med 2021;2:100354.
61. Woolf SH, Chapman DA, Lee JH. COVID-19 as the Leading Cause of Death in the
United States. JAMA 2021;325:123-4.
62. Public Health Ontario. Sars-Cov-2 Whole Genome Sequencing In Ontario, January 18,
2022. publichealthontario.ca, 2022. (Accessed January 19, 2022, at
https://www.publichealthontario.ca/-/media/documents/ncov/epi/covid-19-sars-cov2-whole-
genome-sequencing-epi-summary.pdf?sc_lang=en.)
63. Pfizer. 5.3.6 Cumulative Analysis of Post-authorization Adverse Event Reports (Report
to the FDA) [starting page 103 of the Nevada Board of Health Meeting December 3 2021]
dpbh.nv.gov 2021. (Accessed January 29, 2022, at
https://dpbh.nv.gov/uploadedFiles/dpbhnvgov/content/Boards/BOH/Meetings/2021/Public%20C
omments%20276%20to%20294.pdf.)
64. Government of Canada. Health Canada Authorizes Use of Comirnaty (the Pfizer-
Biontech Covid-19 Vaccine) in Children 5 to 11 Years of Age. canada.ca, 2021. (Accessed
January 29, 2022, at https://www.canada.ca/en/health-canada/news/2021/11/health-canada-
authorizes-use-of-comirnaty-the-pfizer-biontech-covid-19-vaccine-in-children-5-to-11-years-of-
age.html.)
65. Crooke SN, Ovsyannikova IG, Poland GA, Kennedy RB. Immunosenescence and
human vaccine immune responses. Immun Ageing 2019;16:25.
66. Marrocco FN, Coke A, Kitts J. Ontario’s Long-Term Care COVID-19 Commission Final
Report. ltccommission-commissionsld.ca, 2021. (Accessed January 29, 2022, at
http://www.ltccommission-commissionsld.ca/report/pdf/20210623_LTCC_AODA_EN.pdf.)
67. Canadian Institute for Health Information. The Impact of COVID-19 on Long-Term Care
in Canada: Focus on the First 6 Months. CIHI Ottawa, ON, Canada; 2021.
68. World Health Organization. Infection prevention and control guidance for long-term care
facilities in the context of COVID-19: interim guidance, 8 January 2021. World Health
Organization, 2021. (Accessed January 29, 2022, at
https://apps.who.int/iris/rest/bitstreams/1326056/retrieve.)
69. Dykgraaf SH, Matenge S, Desborough J, et al. Protecting Nursing Homes and Long-
Term Care Facilities From COVID-19: A Rapid Review of International Evidence. J Am Med Dir
Assoc 2021;22:1969-88.
70. Brown KA, Jones A, Daneman N, et al. Association Between Nursing Home Crowding
and COVID-19 Infection and Mortality in Ontario, Canada. JAMA Intern Med 2021;181:229-36.
71. Thompson D-C, Barbu M-G, Beiu C, et al. The Impact of COVID-19 Pandemic on Long-
Term Care Facilities Worldwide: An Overview on International Issues. BioMed Research
International 2020;2020:8870249.
72. Tang S, Mao Y, Jones RM, et al. Aerosol transmission of SARS-CoV-2? Evidence,
prevention and control. Environ Int 2020;144:106039-.
73. Akhtar-Danesh N, Baumann A, Crea-Arsenio M, Antonipillai V. COVID-19 excess
mortality among long-term care residents in Ontario, Canada. PLoS One 2022;17:e0262807.
2474. Sundaram M, Nasreen S, Calzavara A, et al. Background rates of all-cause mortality,
hospitalizations, and emergency department visits among nursing home residents in Ontario,
Canada to inform COVID-19 vaccine safety assessments. Vaccine 2021;39:5265-70.
75. Wyller TB, Kittang BR, Ranhoff AH, Harg P, Myrstad M. Nursing home deaths after
COVID-19 vaccination. Tidsskrift for Den norske legeforening 2021.
76. Gee J, Marquez P, Su J, et al. First Month of COVID-19 Vaccine Safety Monitoring -
United States, December 14, 2020-January 13, 2021. MMWR Morb Mortal Wkly Rep
2021;70:283-8.
77. Ontario Hospital Association. Fact Sheet on Hospital Capacity. oha.com, 2021.
(Accessed January 29, 2022, at
https://www.oha.com/Bulletins/OHA%20Fact%20Sheet%20on%20Hospital%20Capacity%20an
d%20Projections%20Jan%2015%202021.pdf.)
78. Government of Canada - Health Canada. Reported side effects following COVID-19
vaccination in Canada. health-infobase.canada.ca, 2021. (Accessed January 29, 2022, at
https://health-infobase.canada.ca/covid-19/vaccine-safety/.)
79. U.S. Department of Health and Human Services (HHS). Vaccine Adverse Event
Reporting System - VAERS Data. vaers.hhs.gov, 2021. (Accessed January 29, 2022, at
https://vaers.hhs.gov/data.html.)
80. UK Government - Medicines & Healthcare products Regulatory Agency. Coronavirus
vaccine - weekly summary of Yellow Card reporting. gov.uk, 2021. (Accessed January 29, 2022,
at https://www.gov.uk/government/publications/coronavirus-covid-19-vaccine-adverse-
reactions/coronavirus-vaccine-summary-of-yellow-card-reporting.)
81. Chow N, Gallo L, Busse JW. Evidence-based medicine and precision medicine:
Complementary approaches to clinical decision-making. Precision Clinical Medicine 2018;1:60-
4.
82. Madden K, Bhandari M. Can Evidence-Based Medicine and Personalized Medicine
Coexist? Personalized Hip and Knee Joint Replacement 2020:1-5.
83. Shah P TI, Turrin D, et al. I. Informed Consent. [Updated 2021 Jun 14]. StatPearls
[Internet] Treasure Island (FL): StatPearls Publishing; Available from:
https://wwwncbinlmnihgov/books/NBK430827/ 2022.
25You can also read