Distribution and characteristics of wastewater treatment plants within the global river network
←
→
Page content transcription
If your browser does not render page correctly, please read the page content below

Earth Syst. Sci. Data, 14, 559–577, 2022
https://doi.org/10.5194/essd-14-559-2022
© Author(s) 2022. This work is distributed under
the Creative Commons Attribution 4.0 License.

       Distribution and characteristics of wastewater treatment
                 plants within the global river network
      Heloisa Ehalt Macedo1 , Bernhard Lehner1 , Jim Nicell2 , Günther Grill1 , Jing Li2 , Antonio Limtong1 , and
                                                 Ranish Shakya1
                      1 Department  of Geography, McGill University, Montreal, QC H3A 0B9, Canada
                  2 Department   of Civil Engineering, McGill University, Montreal, QC H3A 2K7, Canada
          Correspondence: Heloisa Ehalt Macedo (heloisa.ehaltmacedo@mail.mcgill.ca) and Bernhard Lehner
                                                 (bernhard.lehner@mcgill.ca)
                                    Received: 27 June 2021 – Discussion started: 4 August 2021
                       Revised: 6 December 2021 – Accepted: 8 December 2021 – Published: 9 February 2022

      Abstract. The main objective of wastewater treatment plants (WWTPs) is to remove pathogens, nutrients, or-
      ganics, and other pollutants from wastewater. After these contaminants are partially or fully removed through
      physical, biological, and/or chemical processes, the treated effluents are discharged into receiving waterbodies.
      However, since WWTPs cannot remove all contaminants, especially those of emerging concern, they inevitably
      represent concentrated point sources of residual contaminant loads into surface waters. To understand the sever-
      ity and extent of the impact of treated-wastewater discharges from such facilities into rivers and lakes, as well as
      to identify opportunities of improved management, detailed information about WWTPs is required, including (1)
      their explicit geospatial locations to identify the waterbodies affected and (2) individual plant characteristics such
      as the population served, flow rate of effluents, and level of treatment of processed wastewater. These charac-
      teristics are especially important for contaminant fate models that are designed to assess the distribution of sub-
      stances that are not typically included in environmental monitoring programs. Although there are several regional
      datasets that provide information on WWTP locations and characteristics, data are still lacking at a global scale,
      especially in developing countries. Here we introduce a spatially explicit global database, termed HydroWASTE,
      containing 58 502 WWTPs and their characteristics. This database was developed by combining national and re-
      gional datasets with auxiliary information to derive or complete missing WWTP characteristics, including the
      number of people served. A high-resolution river network with streamflow estimates was used to georeference
      WWTP outfall locations and calculate each plant’s dilution factor (i.e., the ratio of the natural discharge of the
      receiving waterbody to the WWTP effluent discharge). The utility of this information was demonstrated in an as-
      sessment of the distribution of treated wastewater at a global scale. Results show that 1 200 000 km of the global
      river network receives wastewater input from upstream WWTPs, of which more than 90 000 km is downstream
      of WWTPs that offer only primary treatment. Wastewater ratios originating from WWTPs exceed 10 % in over
      72 000 km of rivers, mostly in areas of high population densities in Europe, the USA, China, India, and South
      Africa. In addition, 2533 plants show a dilution factor of less than 10, which represents a common threshold
      for environmental concern. HydroWASTE can be accessed at https://doi.org/10.6084/m9.figshare.14847786.v1
      (Ehalt Macedo et al., 2021).

Published by Copernicus Publications.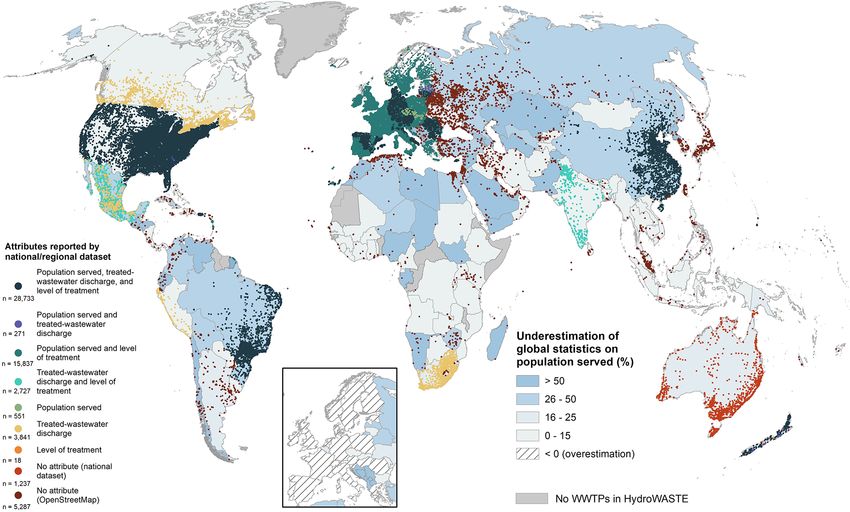
560                            H. Ehalt Macedo et al.: Distribution and characteristics of global wastewater treatment plants

1   Introduction                                                    it is necessary to determine the location where these efflu-
                                                                    ents are being released. This information can help in iden-
In all inhabited regions of the world, the water quality            tifying which particular WWTPs should be targeted for the
of rivers, lakes, and ultimately the ocean depends on how           implementation of more stringent treatment standards and/or
wastewater produced from human activities in upstream ar-           be upgraded through the deployment of advanced treatment
eas, especially those that are densely populated, is processed      technologies. For example, Rice and Westerhoff (2015) an-
and disposed. Globally produced domestic and municipal              alyzed the effects of WWTP effluent locations upstream of
wastewater is estimated to amount to 360 km3 yr−1 , of which        drinking water treatment plants, and Vigiak et al. (2020) esti-
41 km3 yr−1 (11.4 %) is treated in wastewater treatment             mated the domestic waste emissions to European waters from
plants (WWTPs) and then re-used, 149 km3 yr−1 (41.4 %) is           WWTPs.
treated in WWTPs and then discharged, and 170 km3 yr−1                 Therefore, for regulatory purposes, national and regional
(47.2 %) is not treated in WWTPs but released directly into         governments, non-governmental organizations, and com-
the environment (Jones et al., 2021). According to recent as-       mercial data providers gather information about the exact
sessments, approximately 3.1 billion people worldwide had           geospatial location of WWTPs and their attributes such as the
access to sewage systems connected to WWTPs in 2017                 population served, treated-wastewater discharge, and level
(WHO and UNICEF, 2019).                                             of treatment. Datasets on WWTPs are available at differ-
   Although the overall goal of WWTPs is to reduce the load         ent scales, with different attributes, and with highly variable
of pollutants reaching downstream waterbodies, they typi-           frequencies of updates. Datasets from Europe (EEA, 2017)
cally focus on the removal of organic matter and macro-             and from the United States (US EPA, 2016) contain infor-
pollutants and not pollutants of emerging concern. Thus, one        mation on the location and characteristics of WWTPs (e.g.,
of the issues of growing importance with respect to global          generated load, treatment capacity, and level of treatment)
wastewater treatment is the efficiency of removal of specific       and are easily accessed and readily available for download.
contaminants, particularly those related to new products or         In contrast, many countries, such as those throughout most
chemicals that are released without appropriate regulatory          of South America, Africa, eastern Europe, and Asia do not
oversight and with uncertain or unknown effects on the en-          provide readily accessible information about their wastewa-
vironment and human health (WHO and UN Habitat, 2018).              ter sector. The main sources of global wastewater informa-
These “emerging contaminants” (e.g., pharmaceutically ac-           tion, available at the country level, are the Joint Monitor-
tive compounds, microplastics, and ingredients in household         ing Programme for Water Supply, Sanitation and Hygiene
and personal care products) are not commonly monitored,             database (JMP-WASH) (WHO and UNICEF, 2019) and the
and most WWTPs are not designed to remove them either               global information system on water and agriculture, AQUA-
fully or partially before releasing effluents to nearby wa-         STAT (FAO, 2016). JMP-WASH provides regular global re-
terbodies. Hence, wastewater is collected from municipal            ports on drinking water and sanitation coverage for tracking
sources, transported to a location where they may or may            progress toward the Sustainable Development Goal for clean
not be treated, and then released into the environment. As a        water and sanitation (SDG 6) that has been defined by the
result, WWTPs serve as concentrated point sources of con-           United Nations (Herrera, 2019). AQUASTAT provides data
tamination to receiving waterbodies (Daughton and Ternes,           on water resources and water use, with an emphasis on agri-
1999; Musolff et al., 2008). Once the contamination en-             cultural water management.
ters the river network it continues to flow downstream, po-            Also at the global scale, Jones et al. (2021) recently pro-
tentially accumulating with other contaminants from multi-          duced a modeled, spatially disaggregated map of the amounts
ple sources along the way, to sometimes deleterious effects         of wastewater production, collection, treatment, and re-
(UNEP, 2016; van Vliet et al., 2021).                               use. Besides estimating previously unavailable country-level
   Studies have demonstrated that the fraction of wastewater        wastewater statistics, the authors downscaled the country-
in rivers downstream of effluent discharge is directly propor-      level data to a 5 arcmin resolution grid using return-flow
tional to effects on biodiversity and ecosystems (Munz et al.,      data from the global hydrological model PCR-GLOBWB 2
2017; Neale et al., 2017; Bunzel et al., 2013). Therefore, the      (PCRaster Global Water Balance). Nonetheless, the new
dilution factor (i.e., the ratio between the natural discharge of   dataset includes neither the exact point location of treat-
the receiving waterbody and the WWTP effluent discharge)            ment plants, the location of their individual discharges into
is one of the major determinants of ecological risks orig-          the stream network, nor the level of treatment of pro-
inating from WWTPs (Link et al., 2017). Dilution factors            cessed wastewater. Some web interface platforms such as
have been used to predict potential exposure to down-the-           Wikimapia and OpenStreetMap also provide WWTP loca-
drain chemicals from population density (Keller et al., 2014),      tions as point coordinates. Both platforms are built based
which at a regional level can help prevent negative effects by      on contributions from users around the world and are free
identifying zones of high contaminant concentrations (i.e.,         for public use. The information is global and constantly up-
“hotspots”). However, to pinpoint which waterbodies are po-         dated. However, user input may not be equally distributed in
tentially affected by treated wastewater discharged upstream,       space; thus some regions are incomplete. Furthermore, the

Earth Syst. Sci. Data, 14, 559–577, 2022                                             https://doi.org/10.5194/essd-14-559-2022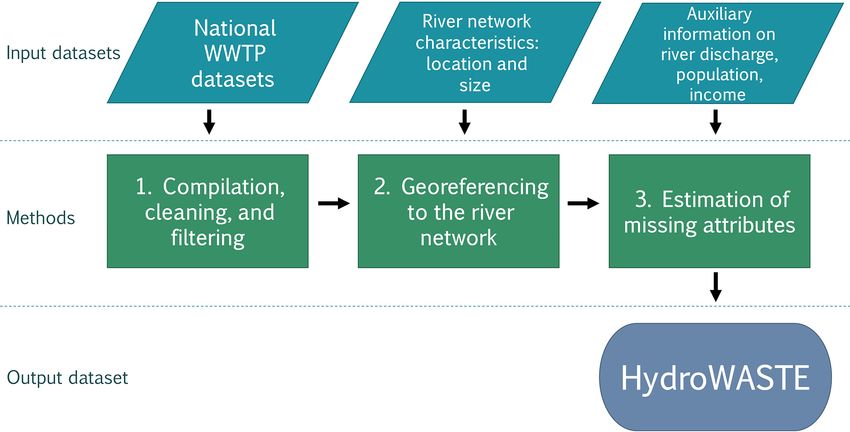
H. Ehalt Macedo et al.: Distribution and characteristics of global wastewater treatment plants                                 561

locations are not necessarily verified, and information other
than point coordinates is often missing. Currently no com-
prehensive global database of geolocated WWTPs exists.
   One of the main applications of WWTP datasets with spa-
tially explicit locations is in water quality modeling, repre-
senting point sources of contaminants discharged into the
river and lake system. In Europe, the Urban Waste Water
Treatment Directive (UWWTD) (EEA, 2017) has been used
as input data in water quality models for pharmaceuticals
and nanoparticles, such as ePiE (Oldenkamp et al., 2018)
and GWAVA (Dumont et al., 2015). In the United States,
WWTP information from the Clean Watersheds Needs Sur-               Figure 1. Conceptual overview of the methodology used to create
vey (CWNS) (US EPA, 2016) has been incorporated in the              the global database of wastewater treatment plants, HydroWASTE.
models PhATE (Anderson et al., 2004) and iSTREEM (Kapo
et al., 2016) to assess the concentration of pharmaceuticals
and other chemicals in river systems. In Canada and China,          2     Data and methods
WWTP information from government sectors was used as
an input for the contaminant fate module of the river-routing       2.1    Development of HydroWASTE
model HydroROUT (Grill et al., 2016, 2018).
   Whereas these existing contaminant fate models operate           To create HydroWASTE, three main steps were undertaken,
from local to regional scales, i.e., from catchments to con-        as shown in Fig. 1: (1) the combination of national and re-
tinents, water pollution is of global concern. Robust esti-         gional datasets, including the correction of errors using the
mates of current and future changes in water quality are            WWTP point locations and attributes available; (2) the geo-
needed to support global environmental and health risk de-          referencing of WWTPs to a global river network, in order
cision making and to sustainably manage water resources             to connect the facilities to their receiving waterbodies; and
to ensure clean and accessible water for all, as required by        (3) the estimation of missing attributes for each WWTP, in-
SDG 6 (Van Vliet et al., 2019; Tang et al., 2019; Strokal           cluding the population served, treated-wastewater discharge,
et al., 2019). To achieve this goal, global water quality as-       and level of treatment, using geospatial methods and auxil-
sessments must be spatially consistent and comparable to be         iary datasets such as modeled river discharge estimates, grid-
able to identify hotspots of contamination and trends in wa-        ded global population numbers, gross national income per
ter pollution over time and across large regions. Global wa-        capita, and country-level statistics on sanitation.
ter quality models can also account for large-scale drivers            The design of HydroWASTE was tailored for its potential
that might not be captured by small-scale models (Tang et           application in water quality modeling. The main attributes
al., 2019). One of the main challenges for global water qual-       that are typically required to simulate the wastewater com-
ity modeling is the lack of spatial consistency in datasets for     ponent in water quality models include the following (Grill
model inputs, especially in regions where data are insuffi-         et al., 2016, 2018): (1) the WWTP’s location (point coor-
cient for a detailed assessment (Strokal et al., 2019; Tang et      dinates); (2) the estimated effluent outfall location (linkage
al., 2019; Kroeze et al., 2016). Due to the limited informa-        between a WWTP and river network); (3) the number of
tion on global wastewater, all published global water qual-         people served by the WWTP; (4) the amount of treated-
ity models until now (e.g., GLOBAL-FATE, Global NEWS,               wastewater discharge; and (5) the level of treatment offered
WorldQual, GlowPa, and IMAGE-GNM) quantify the load                 by the WWTP classified as primary, secondary, or advanced
of wastewater into the river system using population density        (which includes tertiary and any other processes that reduce
and national sanitation statistics as proxies (e.g., Font et al.,   the level of contaminants in the wastewater below that attain-
2019; Strokal et al., 2019; Mayorga et al., 2010; Van Drecht        able through secondary treatment). The WWTP location is a
et al., 2009; Williams et al., 2012; Beusen et al., 2015; Hofs-     necessary requirement for any spatially explicit assessment
tra et al., 2013). More specifically, calculations are typically    that is based on point sources of effluents discharged through
based on the fractions of population connected to sewage sys-       WWTPs. Beyond knowing the actual location of the plant, it
tems per country.                                                   is also important to provide the approximate effluent outfall
   To address this important shortcoming, the objective of          location into the local river network, which can differ sub-
the presented study is to develop a novel global database of        stantially from the WWTP location. The number of people
WWTPs as a means for estimating the distribution of treated         served by WWTPs is required to estimate contaminant loads
wastewater in the global river network at high spatial reso-        that reach the facility, while the treated-wastewater discharge
lution. The database, termed HydroWASTE, includes the ex-           and the corresponding level of treatment provide the basis
plicit geospatial locations of WWTPs, their main character-         for calculating the loads of treated or untreated contaminants
istics, and their linkages to the global river and lake network.    that are discharged by the facility into receiving waterbod-

https://doi.org/10.5194/essd-14-559-2022                                              Earth Syst. Sci. Data, 14, 559–577, 2022

562                           H. Ehalt Macedo et al.: Distribution and characteristics of global wastewater treatment plants

ies. If no data concerning the population served are available,   datasets include records of decentralized wastewater treat-
treated-wastewater discharge can be used in lieu of this, pro-    ment systems, stormwater facilities, and other wastewater
vided that a reasonable conversion factor between the two         collection systems that are not connected to a WWTP. Some
can be estimated (see Sect. 2.1.4 below). Some of these at-       datasets include records with geographic coordinates outside
tributes can be directly compiled from national or regional       the expected national or regional boundaries, which were as-
WWTP datasets, after applying the necessary unit conver-          sumed to be errors and removed from HydroWASTE. More
sions and quality checks. Other attributes must be estimated      details about each dataset can be found in Sect. S1 of the
based on geographical and statistical methods.                    Supplement.

2.1.1   Cleaning, filtering, and combing WWTP national            2.1.2   Auxiliary datasets
        datasets
                                                                  River network attributes
After intensive literature and online searches, several na-
tional (or multi-national/regional in the case of Europe)         To assign the estimated effluent outfall location of each
WWTP datasets were identified that provide the geographic         WWTP, various raster and vector layers representing the river
location of WWTPs, as well as a varying list of additional        network and catchment boundaries were obtained from a
attribute information such as the population served, amount       global hydrographic database termed HydroSHEDS (Lehner
of effluents discharged, and level of treatment (Table 1).        et al., 2008), which was derived from digital elevation data
In cases of multiple datasets being available for the same        provided by NASA’s Shuttle Radar Topography Mission
country, such as in the case of the USA or for individual         (SRTM) at 90 m (3 arcsec) resolution. For our study, we used
European countries, the most comprehensive or most con-           a standardized derivative of this database, termed HydroAT-
sistent dataset was chosen rather than merging all avail-         LAS (Linke et al., 2019), that offers sub-basin delineations
able data in order to avoid issues of duplicate records. In       at 12 hierarchical levels of increasingly finer subdivisions.
most cases, datasets were retrieved from pertinent govern-        We applied the smallest sub-basin breakdown of level 12,
ment agencies through publicly accessible website platforms       which provides 1 034 083 sub-basins globally with an av-
or personal communication. The quality, completeness, and         erage area of 130.6 km2 (standard deviation of 146.9 km2 ).
consistency of the datasets strongly vary among the dif-          HydroATLAS also offers a preprocessed river network, in-
ferent sources and nations. For all countries where no na-        cluding discharge information, that was extracted at 500 m
tional data repositories were available, WWTP point loca-         (15 arcsec) grid cell resolution and represents all rivers and
tions (without further attribute information) were added from     streams where the average discharge exceeds 100 L s−1 or
the open-source web platform of OpenStreetMap (OSM;               the upstream catchment area exceeds 10 km2 or both. Long-
https://www.openstreetmap.org/, last access: October 2019).       term (i.e., 1971–2000) average natural river discharge esti-
   The selected datasets listed in Table 1 use different at-      mates were provided by the global hydrological model Wa-
tribute nomenclatures and reporting units. For example, in        terGAP version 2.2 (Water – Global Assessment and Prog-
the European dataset, the population size is reported in terms    nosis; Müller Schmied et al., 2014), which were downscaled
of “population equivalent”; that is, it assumes one person        from their original resolution of 0.5◦ grid cells to the Hy-
produces 54 g of dissolved organic pollutants, expressed as       droSHEDS resolution of 500 m using geostatistical tech-
biological oxygen demand (BOD) per 24 h. Therefore, it ac-        niques (Lehner and Grill, 2013). To assess dilution factors
counts not only for permanent residents of the surround-          and treated-wastewater ratios in the global river system at
ing area but also for ambient populations, i.e., for differ-      low-flow conditions, we used the minimum discharge as pro-
ences between daytime and nighttime populations, including        vided in the HydroATLAS database, i.e., the lowest monthly
tourists (Nakada et al., 2017). The term “population served”,     flow value within an average year.
as used in most national datasets, generally refers to the pop-
ulation physically connected to the particular WWTP, thus         Country-level wastewater statistics
paying fees for the service (Daughton, 2012). Regarding the
reported value of treated-wastewater discharge, many na-          To infer missing attributes in the WWTP records, global
tional/regional datasets, including those of the USA and Eu-      datasets with information on wastewater at a country level
rope, provide explicit values for both “design capacity” and      were used.
“wastewater treated”. Where available, we used wastewater           Treated-wastewater discharge at the country level was
treated to refer to the amount of treated-wastewater dis-         provided by Jones et al. (2021), who collected and stan-
charge (the type of attribute per record is identified in the     dardized data from online sources, especially the Food
HydroWASTE database).                                             and Agriculture Organization’s (FAO) AQUASTAT database,
   Filtering was necessary for some datasets that include ad-     Global Water Intelligence (GWI), the European Statistical
ditional records not regarding WWTPs, especially for the          Office (Eurostat), and the United Nations Statistics Division
most comprehensive datasets of the USA and Europe. These          (UNSD). The study provides data for the year 2015, and,

Earth Syst. Sci. Data, 14, 559–577, 2022                                           https://doi.org/10.5194/essd-14-559-2022
Table 1. National and regional datasets included in the HydroWASTE database with their reported attributes. For comparison, country-level statistics of the population served, as
provided by the JMP-WASH database (WHO and UNICEF, 2019), and treated-wastewater discharge, as provided by Jones et al. (2021), are listed. For more information on the
individual datasets, see Sect. S1 of the Supplement.
ID Country/region Number of National/regional dataset name (source) Population served Treated-wastewater discharge Treatment Year
WWTPs included
in HydroWASTE
(106 ) (106 m3 d−1 ) level updated
National/regional JMP-WASH National/regional Jones et al.
dataset dataset (2021)
1 Europe 24 971 Urban Waste Water Treatment Directive 585.3a 451.9 55.2 101.1 X 2020
(EEA, 2017)
https://doi.org/10.5194/essd-14-559-2022
2 USA 14 819 Clean Watersheds Needs Survey 258.1 262.9 126.8 125.4 X 2012
(US EPA, 2016)
3 Brazil 2820 Atlas Esgotos (ANA, 2017) 71.7 129.9 11.3 20.7 X 2017
4 Mexico 2540 Sistema Nacional de Información del X 94.9 11.9 9.0 X 2018
Agua (CONAGUA, 2018)
5 China 2486 Ministry of Environmental Protection 480.8 810.1 93.9 85.5 X 2010
of China (Grill et al., 2018)
6 Canada 2064 Wastewater Systems Effluent X 29.2 15.3 13.1 X 2017
Regulations (WSER)
(Environment Canada, 2017)
7 Australia 1234 National Wastewater Treatment Facili- X 21.1 X 5.5 X 2016
ties Database (Hill et al., 2012)
8 South Africa 964 National Integrated Water Information X 31.5 6.9 4.3 X 2019
System (DWS, 2019)
9 India 816 Central Pollution Control Board X 132.1 23.3 9.8 X 2015
(CPCB, 2015)
10 New Zealand 317 Wastewater Treatment Plant Inventory 3.5 3.8 1.3 0.9 X 2019
H. Ehalt Macedo et al.: Distribution and characteristics of global wastewater treatment plants
(Water New Zealand, 2019)
11 Peru 184 Plantas de Tratamiento de Agua X 21.1 2.6 1.6 X 2018
Residual (SUNASS, 2018)
12 Remaining countriesb 5287 OpenStreetMap (OSM) X 975.8 X 138.3 X 2020
Total 58 502 1399.4 2964.3 348.5 515.3
XData mostly available with few exceptions. X Data not available. a Capacity of WWTP reported in terms of population equivalent. b The countries with the most records were Russia (1269), Malaysia (484), Japan (378), Belarus (348), Turkey (319),
and Argentina (143).
Earth Syst. Sci. Data, 14, 559–577, 2022
563564 H. Ehalt Macedo et al.: Distribution and characteristics of global wastewater treatment plants
where data were unavailable, the authors used multiple linear Given these uncertainties, we developed a rule-based pro-
regressions to estimate the values. cedure within a geographic information system (GIS) to es-
The World Health Organization and the United Nations timate a representative point of connection between each
Children’s Fund (WHO/UNICEF) Joint Monitoring Program WWTP and the river network (referred to herein as the es-
(JMP) for Water Supply, Sanitation and Hygiene (WASH) is timated outfall location) using the following rule set: (1) the
responsible for monitoring the SDG target related to WASH outfall location should be within a predefined radius from
(WHO and UNICEF, 2019). For this study, we acquired san- the given WWTP point location; (2) only locations with av-
itation data for each country for the year 2017. The infor- erage natural stream flows exceeding 100 L s−1 or with an
mation selected is termed “Proportion of population using upstream catchment area exceeding 10 km2 are considered
improved sanitation facilities (sewer connections)”. possible outfall locations to avoid allocation to very small
streams; (3) if multiple options are available, priority should
Population grid
be given to larger rivers under the assumption that effluents
are generally directed towards larger rivers to increase di-
Global gridded population distributions of the year 2015 lution; and (4) the location should be within the same sub-
from the WorldPop dataset (WorldPop and CIESIN, 2018) basin as the WWTP itself to avoid misallocation to close
were disaggregated from their original spatial resolution of rivers across a watershed divide. By design, this rule set as-
1 km to the same resolution (500 m) as the applied Hy- signs the outfall location to be downstream of the WWTP
droATLAS data to allow for spatially consistent calculations. location (towards larger rivers), and this downstream alloca-
WorldPop was produced using a combination of census, tion will generally reduce cases where effluents are (possi-
geospatial, and remotely sensed data in a spatial-modeling bly erroneously) assigned to very small streams which could
framework (Tatem, 2017). cause excessive estimates of treated-wastewater concentra-
tions in follow-up water quality assessments. We thus con-
Gross national income (GNI) per capita
sider the described procedure to deliver a best-guess associ-
ation within the given river network with an intended bias
The World Bank divides economies into four income groups to deliver conservative results in terms of environmental risk
(i.e., low, lower-middle, upper-middle, and high) based on studies. It is also important to note that the estimated outfall
gross national income (GNI) per capita (in US dollars), cal- locations should not be interpreted as true and precise geo-
culated using the World Bank Atlas method (World Bank, graphic locations.
2019). This indicator not only refers to the economy but The predefined radius wherein the estimated outfall loca-
also correlates with other non-monetary measures of quality tion can be assigned to a river was set at 10 km. This choice
of life. Here, the GNI of 2019 was used to classify coun- was based on a statistical-determination process using a sub-
tries based on their capacity to deploy different levels of set of WWTPs and remote sensing imagery for manual veri-
wastewater treatment. fication (see Sect. S2.3). If the closest location of connection
to a river is further than 10 km, then the estimated outfall
2.1.3 Georeferencing WWTP outfall locations to the
of the WWTP was georeferenced to that location, indepen-
global river network
dent of distance, provided that all other rules still apply. In
cases where the WWTP location is close to the sub-basin out-
A requirement for any spatially explicit water quality assess- let, limiting the estimated outfall location to less than 10 km
ment that includes WWTPs is to know the approximate lo- away from the WWTP location, the outfall location was addi-
cation at which each plant’s effluents are discharged into a tionally moved one grid cell (∼ 500 m) further downstream,
waterbody, i.e., typically a river, a lake, or the ocean. In real- that is, into the next sub-basin and thus to a larger river, while
ity, the location of the effluent discharge into the environment keeping it close to the original WWTP location and in the
may be distinct from the WWTP’s actual location, influenced same overarching basin (Fig. 2).
by several local factors not easily obtainable and applicable
at a global scale, such as environmental policies, political and 2.1.4 Estimation of missing attributes
social conventions, ecosystem characteristics, land use, and
local conditions such as the presence of interfering pipelines As a prerequisite for many applications, such as the devel-
and canals. Therefore, the reported WWTP locations used opment of a global contaminant fate model, the characteris-
in this study are warranted neither to represent their actual tics of WWTPs should be consistent throughout the database.
outfall locations nor to intersect with the existing river net- Based on previous studies of contaminant fate in rivers (Grill
work. In addition, due to inherent quality limitations of the et al., 2016, 2018; Strokal et al., 2019), the three most im-
global HydroATLAS river network, which was derived from portant attributes required to produce realistic contaminant
a digital elevation model, and the applied spatial resolution load estimates are the (1) number of people served, (2) total
of 500 m, the river locations do not always correspond to re- treated wastewater discharged by the plant, and (3) level of
ality, especially for small streams. treatment (i.e., primary, secondary, or advanced).
Earth Syst. Sci. Data, 14, 559–577, 2022 https://doi.org/10.5194/essd-14-559-2022H. Ehalt Macedo et al.: Distribution and characteristics of global wastewater treatment plants 565
WWTP effluents to remain within specified dilution limits
to mitigate adverse effects of pollution on aquatic ecosys-
tems downstream (Link et al., 2017; Munz et al., 2017; Neale
et al., 2017). Once the different population values were es-
timated, the minimum value was selected to represent the
limit of the WWTP’s capacity in terms of the population
served. We chose the minimum to avoid excessive estimates
of WWTP treatment capacities and the population served,
which could impair subsequent water quality assessments.
For the first approach (A1) we estimated the num-
ber of people served, Pest , using the ratio between the
plant’s treated-wastewater discharge, Wrep (as reported in
the WWTP national dataset), and country-level statistics of
treated wastewater per capita, U (as reported by Jones et al.,
2021):
Wrep L d−1
Pest = . (1)
U L d−1 per capita
Figure 2. Example of georeferencing process to assign WWTP ef- We tested the validity of the relationship described by
fluent outfall locations. See text for more explanations. Eq. (1) using countries with complete data availability (see
Sect. S3.1 for details), which confirmed a strong over-
all correlation (R 2 = 0.80; n = 28 497). If the total treated
The availability of these three attributes in the original wastewater for a certain country was recorded as 0 in the
source data is highly variable between countries (Table 1). reference dataset, U was substituted by the average treated
For instance, while data for the USA, New Zealand, Brazil, wastewater per capita for the countries in the same economic
and China provide information on all three attributes, all group based on their GNI (World Bank, 2019).
other regions lack at least one of them, including Europe, In- For the second approach (A2) the method to estimate the
dia, Canada, and Mexico with two attributes and large parts maximum population served depended again on whether the
of Africa, South America, Asia, and Australia only offering WWTP record contained information on treated-wastewater
the WWTP location. For all incomplete data records, we thus discharge or not. If no attribute was included, the maxi-
inferred the missing attributes based on auxiliary information mum population served was estimated as the total popula-
related to wastewater, such as reported country-level statis- tion surrounding the WWTP within a radius of 11 km, us-
tics on water use, sanitation, and the economy, as well as ing WorldPop population counts. This radius size was de-
population distributions. termined based on the outcome of a sensitivity analysis (see
Table 2 provides an overview of the extent of missing Sect. S3.2). In the geospatial analysis, we ensured that each
data and the auxiliary data that were used to fill the gaps. person in a region was served by only one plant, thereby
Processing steps are explained in more detail below. Note avoiding double counting. In contrast, if a treated-wastewater
that the order in which the missing data were estimated is discharge attribute was available, the total population sur-
predetermined: we first completed the records of population rounding each WWTP was computed within a radius of vari-
served as the results then informed the estimation of treated- able size, based on the initial value of the population served
wastewater discharge and level of treatment. as calculated using approach A1. All WWTP records were
grouped into four size categories of the population served:
Population served < 50 000; 50 000–100 000; 100 000–500 000; and ≥ 500 000
people. The radius assigned for each group was 5, 10, 20,
For WWTP records that did not include information on the and 30 km, respectively. This radius assignment was based
population served by the plant, we estimated this attribute by on tests using the national dataset of India (see Sect. S3.3).
using up to three different approaches (A1, A2, and A3; see For the third approach (A3), we used the dilution fac-
Sect. S3 for more information), depending on data availabil- tor, DF, as defined by Eq. (2) to determine the limit of the
ity and based on the following assumptions: (A1) the pop- WWTP’s treated-wastewater discharge, W , into the receiv-
ulation served is directly related to the treated-wastewater ing river’s average natural discharge, Q, at the estimated out-
discharge of the WWTP; (A2) the population served should fall location (see Sect. 2.1.3 above). Q is provided by the
reside within relatively close proximity to the WWTP; and HydroATLAS dataset (see Sect. 2.1.2 above).
(A3) the treatment capacity of the WWTP cannot overload
Q L d−1 + W L d−1
the receiving river’s capacity for dilution. The latter assump-
DF = (2)
tion is based on the fact that governments typically regulate W L d−1
https://doi.org/10.5194/essd-14-559-2022 Earth Syst. Sci. Data, 14, 559–577, 2022566 H. Ehalt Macedo et al.: Distribution and characteristics of global wastewater treatment plants
Table 2. Summary of approaches used to estimate missing WWTP attributes based on auxiliary data.
Missing attribute Auxiliary data used to estimate missing attributes Number of WWTPs
without reported data
(% of total)
Population served With treated- Country-level treated-wastewater discharge (Jones et al., 2021) 6568 (11.2)
wastewater dis- Proportion of population using improved sanitation facilities
charge available (sewer connections) – JMP-WASH (WHO and UNICEF, 2019)
Without treated- Proportion of population using improved sanitation facilities 6542 (11.2)
wastewater dis- (sewer connections) – JMP-WASH (WHO and UNICEF, 2019)
charge available Population grid (WorldPop and CIESIN, 2018)
Treated-wastewater Population served 22 930 (38.1)
discharge Country-level treated-wastewater discharge (Jones et al., 2021)
Level of treatment Population served 11 187 (19.1)
GNI – World Bank (World Bank, 2019)
The minimum DF recommended by the European sure that the total population served per country would not
Medicines Agency (EMA) for environmental risk assess- surpass national statistics:
ments of medicinal products for human use is 10 (EMA,
2006). However, this can sometimes differ in reality. Rice Pstat
F= . (4)
and Westerhoff (2017) found a wastewater ratio higher than Ptot
50 % for over 900 streams receiving wastewater in the USA,
This correction was not applied for any country that re-
i.e., representing a DF equal or lower than 3. For the devel-
ported population served in its national WWTP dataset.
opment of HydroWASTE, we therefore applied a minimum
DF of 5; i.e., WWTPs can be assigned maximum populations
that would lead to effluent loads exceeding the EMA recom- Treated-wastewater discharge
mendation yet within the range of values that are observed
Since a WWTP’s wastewater discharge is directly related to
in reality. For WWTPs that have estimated outfall locations
the population served, Eq. (1) was modified to estimate the
within 50 km of the ocean or a large lake (defined as those
treated-wastewater discharge (West ) from the reported or es-
with a surface area larger than 500 km2 in the global Hy-
timated population served (P ) for all WWTP records that did
droLAKES dataset; Messager et al., 2016), we assume that
not report on this attribute:
environmental regulations are less restrictive, since there is
a large waterbody nearby that could greatly dilute the ef-
fluent. For this reason, A3 is not applied for these WWTPs. West L d−1 = P × U L d−1 per capita . (5)
The maximum population served, Pmax , that the river could
support was then calculated by solving Eq. (2) for W (using Level of treatment
DFmin = 5) and inserting it into Eq. (1), resulting in
The level of treatment of each WWTP was estimated based
Q L d−1
on the GNI per capita per annum categorization as defined by
Pmax = . (3) the World Bank for all countries, generally reflecting the ob-
U L d−1 per capita × (DFmin − 1)
servation that high-income countries have a higher probabil-
In cases where the treated-wastewater discharge is not re- ity of advanced wastewater treatment than low-income coun-
ported (Table 2), only approaches A2 and A3 were used, tries. The applied relationships between income, the popula-
which causes a higher level of uncertainty in these cases. tion served, and the level of treatment were determined based
Finally, the minimum value among approaches A1, A2, on national datasets that reported the level of treatment (see
or A3 was selected as the WWTPs estimate of population Sect. S3.5 for details). As a result, for countries in the high-
served (see Sect. S3.4 for an evaluation of each approach and income group (GNI ≥ USD 12 536), if the population served
the effect of using the minimum). A correction was applied by the WWTP exceeds 3000 (i.e., in predominantly urban
if the sum of the estimated population served by WWTPs settings), the level of treatment was set as advanced; other-
in a country, Ptot , exceeded the total national population wise, secondary treatment was assumed. For middle-income
connected to sewers, Pstat , as reported by the JMP-WASH countries (GNI between USD 1036 and USD 12 535), the
database. In this case, the estimated population served by level of treatment was set as secondary. We did not find any
each WWTP was multiplied by a reduction factor (F ) to en- WWTP regional datasets for countries from the low-income
Earth Syst. Sci. Data, 14, 559–577, 2022 https://doi.org/10.5194/essd-14-559-2022H. Ehalt Macedo et al.: Distribution and characteristics of global wastewater treatment plants 567
group (GNI ≤ USD 1035). We assumed that the level of treat- ulation served, treated-wastewater discharge, and level of
ment is the most basic, i.e., primary, in these countries, which treatment. From these, 58 278 records were successfully geo-
may lead to some underestimations of their actual treatment referenced to the global river network of HydroATLAS. The
potential. remaining 224 WWTPs were not linked to the river network,
as they were located on small islands or in small coastal
2.2 Application of HydroWASTE to estimate dilution
basins and are thus assumed to discharge directly to the
factors and treated-wastewater ratios in global rivers
ocean. The average distance between the WWTP location in
the source data and its estimated effluent outfall location is
The dilution factor was calculated for all WWTP records in 6.5 ± 3.1 km with a maximum distance of 21.8 km.
HydroWASTE at the estimated outfall location using Eq. (2). Figure 3 presents the spatial distribution of WWTPs in
The assessment was conducted for both average and mini- HydroWASTE. Europe and the USA show the highest den-
mum discharge conditions, i.e., using long-term natural av- sities of WWTPs, whereas China and India have some-
erage and minimum river discharge, respectively, as reported what lower densities but much larger facilities (i.e., a higher
in the HydroATLAS database (see Sect. 2.1.2 above). For population served; see Table 3). Figure 3 also shows the
WWTPs where the outfall location coincides with a lake comprehensiveness of the reported attributes of each re-
from the HydroLAKES dataset (Messager et al., 2016), DF gional dataset and an evaluation of HydroWASTE’s popu-
was calculated based on the natural discharge at the outflow lation served against the JMP-WASH database (WHO and
of the lake to the river network. Since there is no meaningful UNICEF, 2019). Since we limited our estimated values of the
value for direct discharge into the ocean or a large lake (i.e., population served so that they did not surpass the country-
lakes with a surface area larger than 500 km2 ), the DF for level records, most errors correspond to underestimations of
WWTPs where the estimated outfall location is within 10 km the population served. Exceptions occur in many European
of the ocean or a large lake is assumed to be infinite. This countries; here, the population served was calculated from
conservative assumption was made to avoid the potentially reported values in terms of population equivalent, which in-
erroneous assignment of very low DF values for WWTPs lo- cludes not only permanent residents but also the ambient
cated near a large waterbody (but on a small stream) given population and, thus, can exceed the reported national popu-
the plausible option that the WWTP can discharge its efflu- lation values in the JMP-WASH database.
ents directly into the lake or ocean, e.g., by artificial over- or Table 3 provides an overview of the 20 countries with
underground drainage, to increase dilution and ensure regu- the largest numbers of people served by WWTPs in
latory compliance. HydroWASTE. These countries contribute around 83 % of
Finally, since dilution factors are used only as a regulatory the total global treated wastewater (Jones et al., 2021). Ta-
compliance factor for WWTP effluents, i.e., determined for ble 3 also includes the attributes reported by JMP-WASH
each WWTP location individually, we also assessed the dis- (WHO and UNICEF, 2019) and Jones et al. (2021) for each
tribution of treated wastewater throughout the entire global country for comparison. For the population served, the re-
river network by calculating the ratio of accumulated treated sults confirm that HydroWASTE tends to overestimate val-
wastewater to natural discharge in every river reach. As with ues for European countries compared to JMP-WASH data,
DFs, the assessment was conducted for both average and whereas for other countries it tends to underestimate them
minimum river discharge conditions. For this, the wastewater (due to incomplete records), leading to an overall global
quantities discharged from all WWTPs were routed and ac- underestimation of 22.5 %. However, an over- or underesti-
cumulated downstream, from the estimated effluent outfall mated value of the population served does not directly trans-
locations to the ocean, and divided by the long-term natural late to equally over- or underestimated values of treated-
average and minimum river discharge, respectively, as pro- wastewater discharge. In fact, total global treated-wastewater
vided for all river reaches in the HydroATLAS database (see discharge from HydroWASTE overestimates the reported
Sect. 2.1.2 above). The WWTPs reported as “closed”, “de- global value by Jones et al. (2021) by 1.1 %. The USA is the
commissioned”, or “non-operational” were included in this country with the best accordance regarding both attributes
analysis for their potential as source of residues in river sed- analyzed, reflecting a presumed high level of data complete-
iments from former discharge (Thiebault et al., 2021). This ness and quality in HydroWASTE. But even if we removed
process was performed using the river-routing model Hydro- the datasets from the USA, Europe, and Canada from the
ROUT (Lehner and Grill, 2013). comparison, HydroWASTE still covers 92 % of the reported
treated-wastewater discharge by Jones et al. (2021) (see Ta-
ble S5).
3 Results
In terms of missing attribute information that was not
3.1 HydroWASTE: a global WWTP database
reported but was instead complemented using statistical
methods, we assigned 39 % of the total population served
HydroWASTE contains a total of 58 502 WWTPs, each in- and 33 % of the total treated-wastewater discharge in
cluding reported or estimated attributes concerning the pop- HydroWASTE through statistical estimates (Table 4).
https://doi.org/10.5194/essd-14-559-2022 Earth Syst. Sci. Data, 14, 559–577, 2022568 H. Ehalt Macedo et al.: Distribution and characteristics of global wastewater treatment plants
Table 3. Top 20 countries that have the largest numbers of people served by WWTPs according to the HydroWASTE database and their total
amount of treated-wastewater discharge. The country-level statistics for population served and treated-wastewater discharge were obtained
from the JMP-WASH database (WHO and UNICEF, 2019) and Jones et al. (2021), respectively. Under-/overestimation is calculated using the
error percentage formula “((HydroWASTE − Country-level statistics)/Country-level statistics) ×100”. For a complete list of all countries,
see Table S5.
Country Number of WWTPs Population served (106 ) Treated-wastewater discharge (106 m3 d−1 )
in HydroWASTE
HydroWASTE JMP-WASH Under-/over- HydroWASTE Jones et al. Under-/over-
estimation (%) (2021) estimation (%)
China 2486 480.9 810.1 −40.6 93.9 85.6 9.7
USA 14 819 258.1 265.9 −2.9 127.2 126.0 0.9
India 816 132.1 132.1 0.0 23.3 9.8 137.7
Germany 4257 110.6 78.9 40.3 22.9 20.0 14.5
Japan 378 85.2 94.5 −9.9 21.3 23.6 −9.9
Brazil 2820 71.7 130.0 −44.8 11.3 20.7 −45.4
France 3622 71.6 54.3 31.9 12.8 9.7 31.9
Italy 4090 70.5 56.9 23.9 15.3 11.3 35.7
UK 1887 70.4 63.1 11.5 15.7 14.1 11.5
Russia 1270 65.2 111.2 −41.4 8.4 14.3 −41.4
Spain 2118 63.5 46.0 38.0 11.6 8.3 39.7
Mexico 2540 57.7 94.9 −39.2 11.9 9.0 32.5
Egypt 132 39.1 58.1 −32.7 11.8 17.6 −32.7
Poland 1668 38.7 27.2 42.3 5.5 3.9 42.5
South Korea 87 37.0 49.2 −24.7 14.0 18.5 −24.7
Turkey 320 36.2 65.0 −44.3 4.0 7.2 −44.3
Indonesia 38 28.1 29.4 −4.6 10.8 11.3 −4.6
Canada 2064 26.2 29.3 −10.6 15.4 13.1 16.9
South Africa 964 25.1 31.5 −20.2 6.9 4.3 62.2
Colombia 63 23.6 36.3 −35.1 0.4 0.6 −35.1
Total 46 439 1791.5 2263.9 −20.9 444.4 428.9 3.6
Global 58 502 2297.6 2964.3 −22.5 520.7 515.3 1.1
In order to evaluate the robustness of the methods applied 3.2 Global dilution factors
to estimate the population served and treated-wastewater dis-
charge for records with missing information, we used a sub- The dilution factors (DFs) were calculated for every WWTP
set of 28 497 WWTPs in HydroWASTE that have reported record using Eq. (2), except for (1) WWTPs that have their
values of both attributes (see Sect. S3.1 and Table S1 for de- outfall location less than 10 km from large lakes or the ocean
tails on these data). We applied the same methods as for the (n = 10 445), for which we assigned an infinite DF (see
completion of missing attributes to additionally create an es- Sect. 2.2 for more details); (2) WWTPs that reported treated-
timated value of both reported attributes in this WWTP sub- wastewater discharge as 0 (n = 175); and (3) WWTPs not
set. Figure 4 shows the comparison between the reported and connected to the river network (n = 224). For average-flow
the estimated values. For the population served, 97.6 % of conditions, the median calculated DF among the analyzed
the estimated values were within 1 order of magnitude of re- WWTPs in HydroWASTE (47 302) is 570, but 2533 (5.4 %)
ported values, while for treated-wastewater discharge 99.1 % of the plants had a DF value below 10, i.e., lower than the rec-
remained within 1 order of magnitude. ommended threshold for environmental regulations (EMA,
The method to predict the level of treatment for WWTPs 2006). For low-flow conditions, the median DF decreases to
that lacked this attribute was evaluated by applying it to 203, and the number of WWTPs having a value below 10 in-
all WWTPs with reported levels of treatment (n = 47 315). creases to 5712 (12.1 %). Figure 5 shows the cumulative fre-
Overall, our model could correctly predict the level of treat- quency distribution of DFs calculated from HydroWASTE
ment for 70 % of plants (Table 5). The “primary” treatment using average river discharge (for low-flow conditions, see
level could not be validated, as this treatment level was pre- Fig. S6).
dicted only for low-income countries, yet no reported data As part of the methods to estimate missing attributes,
were available for this income category to compare against. Eq. (3) required the setting of a minimum DF (see Sect. 2.1.4
above) to estimate the upper limit of the population served.
We set this DF value to be 5 and applied it to a total of 479
Earth Syst. Sci. Data, 14, 559–577, 2022 https://doi.org/10.5194/essd-14-559-2022H. Ehalt Macedo et al.: Distribution and characteristics of global wastewater treatment plants 569
Figure 3. WWTP locations, attributes, and completeness of population served in HydroWASTE. Each point represents a WWTP, with colors
depicting their reported attribute completeness with respect to the population served, treated-wastewater discharge, and level of treatment.
The country’s area shading reflects the underestimation of the total population served per country in HydroWASTE as compared to global
country statistics reported by JMP-WASH (WHO and UNICEF, 2019). Due to the high point density in Europe, an inset was added to show
the underlying country shading.
Table 4. Global treated-wastewater discharge and population served by WWTPs, according to HydroWASTE database and as provided by
reported global values derived from country-level statistics. Reported WWTP data were provided by regional datasets (Table 1). Estimated
WWTP data were derived using statistical methods (see Sect. 2.1.4). n is the number of WWTP records in HydroWASTE.
Attribute WWTP WWTP Total in Global values derived from country-level statistics
reported estimated HydroWASTE
Value n Value n Value n Value Difference in Source
HydroWASTE
(%)
Population served 1399 45 392 898 13 110 2297 58 502 2964 −22.5 JMP-WASH
(106 ) Population with access to
piped sewers (WHO and
UNICEF, 2019)
Treated-wastewater 349 35 572 172 22 930 521 58 502 515 1.1 Treated municipal waste-
discharge (106 m3 d−1 ) water (Jones et al., 2021)
https://doi.org/10.5194/essd-14-559-2022 Earth Syst. Sci. Data, 14, 559–577, 2022570 H. Ehalt Macedo et al.: Distribution and characteristics of global wastewater treatment plants
Figure 4. Evaluation of the method used to estimate missing attributes (see text for more explanations): population served (a) and treated-
wastewater discharge (b). n is the number of records; NRMSE is the normalized root mean square error; PBIAS is the percent bias; NSE is
the Nash–Sutcliffe efficiency; and KGE is the Kling–Gupta efficiency. The solid line represents the 1 : 1 line, and the dashed lines represent
the error lines of 1 order of magnitude.
Table 5. Level of treatment according to the HydroWASTE database. The reported values are provided by the national datasets compiled,
and the estimated values were produced using methods described in Sect. 2.1.4. “Correct prediction of reported treatment level” refers to the
percentage of correct classifications using our prediction model.
Level of treatment Number of WWTPs Correct prediction of reported
Reported Estimated Total treatment level (%)
Primary 765 116 881 Not applicable∗
Secondary 25 681 8960 34 641 73
Advanced 20 869 2111 22 980 68
Total 47 315 11 187 58 502 70
∗ No national dataset from a country in the low-income category was available that included this attribute.
WWTPs, which represent 19 % of all plants with DFs below 1 %. Over 72 000 km (5.9 %) of impacted rivers surpass the
10. treated-wastewater ratio of 10 % (i.e., corresponding to a
dilution factor of 11), thus reaching or exceeding the rec-
3.3 Distribution of treated wastewater in global rivers ommended limit used in environmental regulations (EMA,
2006). Although 26 % (19 000 km) of these highly impacted
To demonstrate the global utility of the HydroWASTE rivers are located within close vicinity of WWTPs (i.e.,
database, we here present a first application in which we within an average distance of 8.5 km measured between the
used both the location of WWTP outfalls and their associated estimated WWTP outfall location and the first river conflu-
attributes to route the discharged effluents along the global ence thereafter) and may thus represent very local condi-
river network and calculate the ratio of treated wastewater tions and/or be affected by uncertainties in the WWTP lo-
in any river reach downstream of a WWTP in the database. cations, the remaining 74 % (53 000 km) are further down-
The global assessment shows that more than 1 200 000 km of stream from WWTPs, indicating persistent risks of high po-
rivers are located downstream of WWTPs and thus contain tential wastewater contamination. From the 15 countries with
some amount of WWTP effluents (Table 6 and Fig. 6). Of the highest total length of rivers containing any amount of
these, about 96 000 km are located downstream of WWTPs treated wastewater, more than 10 % of impacted rivers in
that offer only primary treatment. At average-flow condi- China, Mexico, India, and South Africa exceed the 10 %
tions, about one-third (398 000 km) of all rivers contain- treated-wastewater ratio in their discharge (Table 6). At low-
ing treated wastewater exceed a treated-wastewater ratio of
Earth Syst. Sci. Data, 14, 559–577, 2022 https://doi.org/10.5194/essd-14-559-2022H. Ehalt Macedo et al.: Distribution and characteristics of global wastewater treatment plants 571
Finally, we assessed the number of potentially affected
people along highly impacted rivers (i.e., rivers that carry
at least 10 % of treated wastewater). Following Richter et
al. (2010), we assume that people living within 10 km of a
river are potentially dependent on river services, such as wa-
ter provision or groundwater recharge, or are exposed to risks
related to river flows, such as flooding. With this definition,
as well as using population information provided in the Hy-
droATLAS database (Linke et al., 2019), we estimate that
874 million people live within 10 km of rivers with treated-
wastewater ratios exceeding 10 % at average-flow conditions.
As these people potentially use river waters for various pur-
poses (e.g., drinking, cleaning, fishing, and recreation), they
are at elevated risk to be affected by water quality issues, in-
Figure 5. Frequency distribution of calculated dilution fac- cluding during floods.
tors (DFs) at average-flow conditions of all WWTPs in the
HydroWASTE database (with some exceptions, see text for more
information). For results at low-flow conditions, see Fig. S6. 4 Data availability
HydroWASTE including all described attributes can be ac-
flow conditions, the length of rivers surpassing the treated- cessed at https://doi.org/10.6084/m9.figshare.14847786.v1
wastewater ratio of 10 % triples to over 213 000 km (17.6 %). (Ehalt Macedo et al., 2021).
In addition, Germany and Spain join the list of countries with
the largest percentages, both exceeding 30 % of rivers that
contain more than 10 % of treated wastewater. 5 Discussion and conclusion
Our study highlights several large river basins, includ-
ing the Hai (China), Mississippi (USA), and Orange (South Detailed water quality assessments require spatially explicit
Africa) with particularly long sections of impacted rivers information on how, where, and how much wastewater is en-
with treated-wastewater ratios exceeding 10 % at average- tering the river system. Here, we developed a global geospa-
flow conditions (Table 7). However, a given wastewater ratio tial wastewater treatment plant database, HydroWASTE, in-
is expected to have different implications depending on the volving the compilation of national and regional datasets, the
level of treatment offered by the WWTPs upstream. For ex- georeferencing of all records to a river network, and the es-
ample, although both the Mississippi basin and the Hai basin timation of attributes not originally reported by the source
have a comparable total length of rivers containing more than datasets. HydroWASTE can be used for numerous applica-
10 % treated wastewater, the higher percentage of advanced tions ranging from environmental to human health risk as-
treatment in the Mississippi basin may result in less environ- sessments. It is the first database at the global scale that
mental risk than the predominantly secondary treatment re- includes this level of detail and comprehensiveness regard-
ported in the Hai basin. We conducted two more assessments, ing geospatial WWTP locations, estimated effluent outfall
both at average-flow conditions, with a focus on ecological locations, and associated attributes, such as the population
implications of our results. First, we found that a total of served, treated-wastewater discharge, and level of treatment.
149 000 km of river stretches with a treated-wastewater ratio In a first application, these characteristics allowed for the
exceeding 1 % and 31 000 km with a ratio exceeding 10 % are assessment of the distribution of treated wastewater in the
located along rivers that are currently considered to be free- global river network.
flowing (Grill et al., 2019), i.e., rivers that are not substan- Since WWTPs are important sources of contaminants into
tially impacted by human activities that alter their connectiv- receiving waters, spatial information on treated-wastewater
ity and ecosystem services. Second, we estimate that 17 % discharge along with the key attributes is a critical input to
of rivers that contain more than 10 % of treated-wastewater water quality modeling. The most recent global assessments
discharge are flowing through protected areas, defined as did not have access to this level of detail, relying on country-
IUCN (International Union for Conservation of Nature) cate- level statistics to account for these sources. The correct loca-
gories I–VI (UNEP-WCMC and IUCN, 2021). These results tion of effluent discharge as a point source is rarely available,
show that treated-wastewater ratios could be used as an ad- and if it is, it often does not connect with the river network
ditional and complementary metric of water quality to be in- integrated in the model. In this study we followed a conser-
tegrated in refined assessments of anthropogenic impacts on vative approach to topographically connect the point sources
river health and ecological status. (WWTPs) with the river network. That is, instead of just con-
necting the WWTP to the nearest river reach, we introduced
a tolerance of, on average, 6.5 km to allocate the outfall loca-
https://doi.org/10.5194/essd-14-559-2022 Earth Syst. Sci. Data, 14, 559–577, 2022You can also read