Ecosystem-based ESIA approaches in deep-sea mining
←
→
Page content transcription
If your browser does not render page correctly, please read the page content below
Ecosystem-based ESIA approaches in deep-sea mining

Adrian Flynn1 and Giorgia Cecino1
1
    Fathom Pacific Pty Ltd, Melbourne, Australia.
Corresponding author: adrian.flynn@fathompacific.com

Abstract

A new paradigm in Environmental and Social Impact Assessment is required for permitting of
deep-sea mining. The lack of precedent, vocal opposition, scientific uncertainty and untested
legislation are some of the factors that dictate the need for novel approaches. The uncertainty
dimension has placed a focus on marine scientific research elements of ESIA. While fundamental
research is required, this focus creates the potential for atomised research topics and within the
timelines of a mining proposal, potentially leads to a body of research that is difficult to integrate
into an ESIA. Ecosystem-based approaches are needed by contractors and regulatory agencies as
a framework for assessment that connects ESIA studies to indicators of serious harm and connects
baseline studies with monitoring requirements. Ecosystem-based approaches are required to give
contractors confidence that environmental studies are nested within an integrated ESIA structure
and that study findings inform options in mine planning and link to monitoring and adaptive
management scenarios. For regulators and other stakeholders, ecosystem-based approaches are
required to ensure that environmental and societal values are addressed, that static environmental
study ‘completeness’ tests do not override information requirements, and that data from individual
projects can evolve into knowledge at the regional scale. We present practical examples of
ecosystem-based approaches to deep-sea mining that provide a socio-ecological framework for
ESIA and a tool for decision-making support and best practice.

                                                                                                     1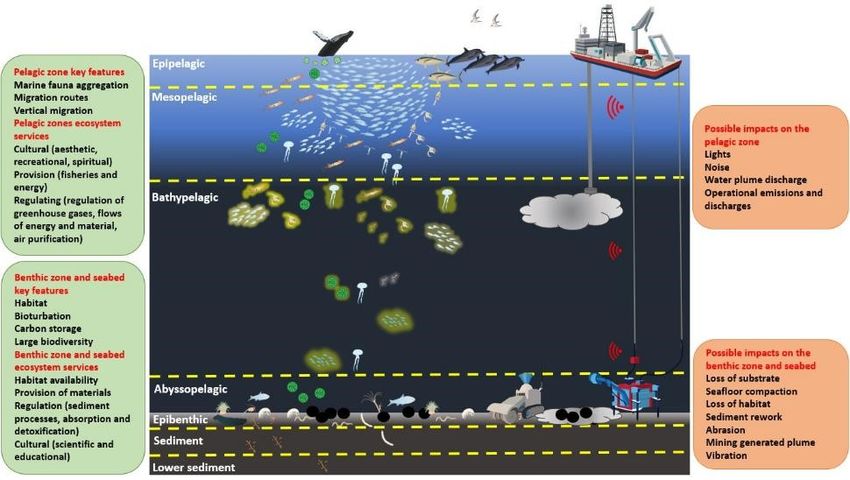
Introduction

Deep-sea mining (DSM) is predicted to become increasingly important in a world transitioning
from fossil fuels to alternative energy sources. DSM will have some level of impact on the deep-
sea environment [1] and understanding the significance of these impacts is critical to the regulatory
and societal acceptance of this practice. The International Seabed Authority (ISA), which regulates
minerals activities in international waters has developed environmental regulations and
recommendations. However, ultimately the onus is on the mining development proponent to
produce not only a compliant Environmental Impact Assessment (EIA), but also the evidence that
there will be no serious harm and the mitigation, monitoring and management plans that will be
put in place as safeguards if unexpected impacts are detected. Given the lack of precedent, and
scientific uncertainty as to ecological responses, the Precautionary Principle is installed in the
deep-sea mining development process. Environmental baseline studies, equipment tests and trial
mining are part of the evidence-building process. However, a methodology is required to pull these
data into an Ecosystem Based Management framework.

Polymetallic nodules are valuable sources of manganese, copper, nickel and cobalt and cover large
areas of the abyssal seabed [2]. Nodules represent a hard substrate in an otherwise unconsolidated
seafloor environment, representing potential colonisation substrates for sessile invertebrates.
Furthermore, nodules have surface structures that, in combination with the chemical environment,
support community compositions that differ from non-nodule sediment beds. Nodule types,
densities, distribution along the broad longitudinal gradient of the CCZ, in addition to Abyssal Hill
topography and depth regimes are among the drivers of biological distributions.

The delivery of particulate organic matter from sunlit layers of the water column to the benthic
environment is one of the major processes connecting the pelagic and benthic ecosystems [3].
Active biological interactions, such as the feeding of demersal fishes on epibenthos and infauna,
also connect the pelagic and benthic ecosystems.

Polymetallic nodule mining will interact with benthic and pelagic ecosystems via the direct
removal of nodules, reworking of sediments, the generation of near-bottom and midwater plumes
and the generation of subsea and surface noise, among other potential pressures [4]. The approval
of a nodule mining operation is contingent on a contractor demonstrating that there will be no
serious harm [5], which requires detailed baseline investigations and an Environmental Impact
Assessment (EIA) process.

Scientific studies in the water depths of the Clarion-Clipperton Zone (CCZ) (>4,000 m) are
technically challenging and expensive. Studies necessarily involve several disciplines although the
service providers of these studies are often narrowly focussed to particular subject matter expertise.
Indeed, early regulatory advice from the ISA was focussed strongly on the need for taxonomic
studies of benthic infauna and identifying the required studies and parameters for atomised
baseline studies. As such, despite decades of research activity [6-8], significant unknowns remain
in the area of integrated ecology and ecosystem function.

                                                                                                     2
The ISA recommends adopting an ecosystem-based management (EBM) approach to manage and
monitor mining operations [9]. However, ecosystem-based management must also be installed at
the front end of program design to ensure that specific studies can assemble up to integrated
assessments. Traditionally, EBM approaches focused on the impact of human activities on
ecosystem interactions, such as trophic relationships. Recently, mixed approaches have been
developed that incorporate ecosystem dynamics with social and economic perspectives and the
drivers of human generated pressures. Mixed approaches have been effective in other large area
management regimens and multi-stakeholder environments [10-12].

Figure 1: DPSER chain structure. Modified from Kelble et al. 2013.

Here we demonstrate an EBM-DPSER model (D drivers, P pressures, S status indicators, E
ecosystem services, R responses) (Figure 1) and the utility of this type of model to support
decision-making in DSM. We develop a model that relates to spatially-explicit habitats and
represents the interactions between DSM and deep-sea ecosystems and investigate the derivation
of pressures from drivers. We investigate ecosystem components and identify monitoring
indicators that link to multiple parts of the model, from the pressure components to the ecosystem

                                                                                                 3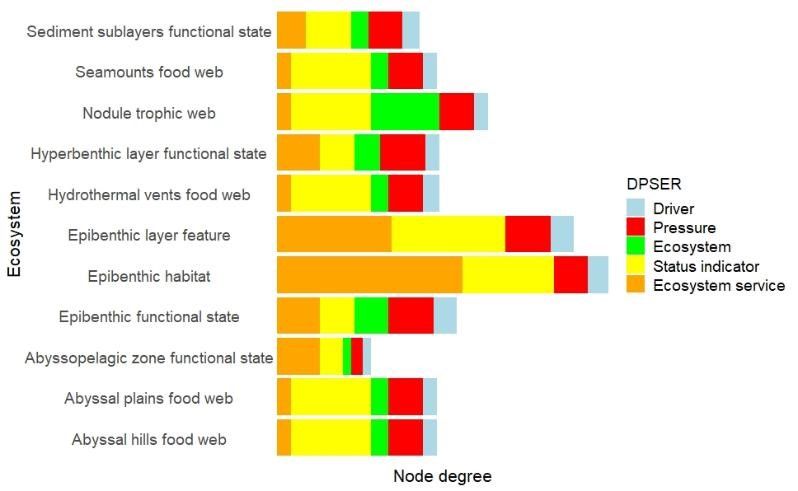
components. We apply network analysis to examine the derived ecosystem models and develop
hypotheses about which compartment or deep-sea community might be more vulnerable to deep-
sea mining, what pressures will have the largest impact on the ecosystem and propose targeted
monitoring responses. We describe how models of this kind can link to adaptive management
strategies.
Methods
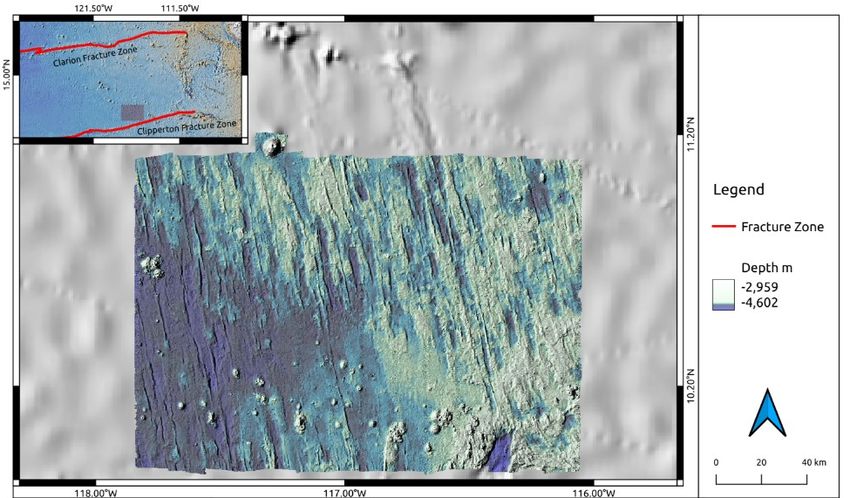
A DPSER model was developed to represent the NORI-D Area, a polymetallic nodule exploration
contract area region located in the Clarion-Clipperton Zone (CCZ) (Figure 2). The DPSER model
creation used the so-called EcoNet model, a tool of an environmental database system known as
qCore. The database is an integrated system that links individual sample data and records through
classification structures to facilitate EBM. The qCore system combines the premises of the JNCC
biotope classification scheme [12] and the CMECS abiotic classification scheme [13], and the
concepts of the Scottish Feature-Activity-Sensitivity Tool (FeAST)
(www.marine.scotland.gov.uk/feast/) and the European Union’s Good Environment Status (GES)
[14, 15]. GES concepts were used to frame the connection of status indicators in the ecosystem
model. The model was constructed on the basis of contractor data, evidence from the literature and
technical reports, describing CCZ habitats, geomorphology, marine species and ocean dynamics
and features.
Figure 2: Map of study area.
4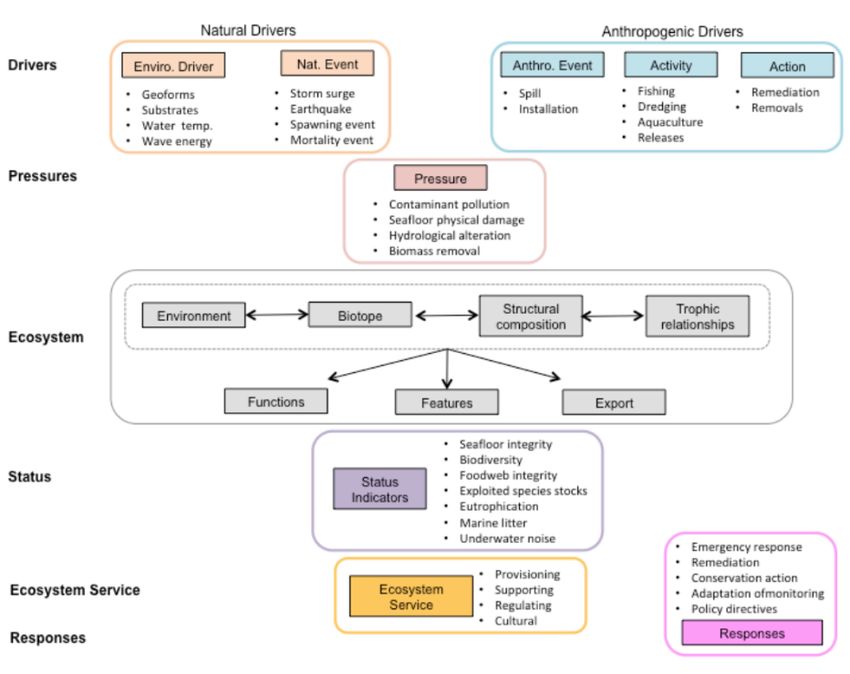
The ecosystem compartments included in the model are shown in Figure 3. Habitats are nested
within these ecosystem compartments. EcoNet uses functional guilds in the model components
that relate to trophic interactions. Fauna and indeed all components of the EcoNet model are
described using a 6-level hierarchical approach. As such, models can be constructed at exploratory
levels as planning tool in the absence of detailed information and progressively improved as
information is produced. Here we present models at level 4 of the hierarchical scheme.

Figure 3: Schematic showing the processes involved in deep-sea mining for the water column and seabed. The
figure also shows the ecological characteristics of the fauna inhabiting the pelagic and benthic zones. Pressures, key
features, and ecosystem services are listed in the text boxes.

The model was visualised as a network of nodes and links. Networks were analysed taking
advantage of graph theory, which allows to rank network nodes and calculate several network level
metrics to describe the graph properties. We calculated node degree, quantifying the number of
links connected to a node, to rank node importance. We estimated network modularity, a metric
used to detect the community structure, and edge density, often used in ecology to quantify the
stability and vulnerability of an ecological network to perturbations [16].

                                                                                                                         5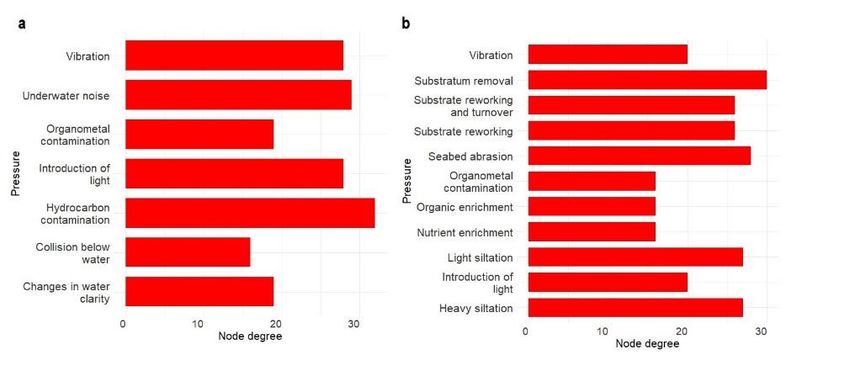
Results

We generated an EcoNet network for DSM linking all the DPSER nodes identified for all the
ecological compartments of the water column and seabed. EcoNet subnetworks were grouped
according to compartments (Figure 4).

Nodes degree was calculated as a proxy for node ‘importance’ in the model (Table 1).

Figure 4: DSM EcoNet network at Level 4 for the epipelagic (a) and epibenthic zone (b). Node colours represent the
DPSER group and node size varies according to node degree.

                                                                                                                 6
Table 1: Node degree of the top 5 most important nodes of the EcoNet model for the epibenthic and epipelagic
compartments. Nodes are classified by their DPSER group. Calculations were completed using R [17] and the package
‘igraph’ [18].
Node name Compartment DPSER group Node degree
Physical, hydrological and chemical Epibenthic Status indicator 49
conditions
Condition of the typical species and Epibenthic Status indicator 47
communities
Composition of the ecosystem components Epibenthic Status indicator 47
(habitats and species)
Relative abundance and/or biomass Epibenthic Status indicator 43
Animal-based source of energy provision Epibenthic Ecosystem 37
service
Physical, hydrological and chemical Epipelagic Status indicator 53
conditions
Animal-based source of energy provision Epipelagic Ecosystem 52
service
Trophic processes regulation Epipelagic Ecosystem 52
service
Composition of the ecosystem components Epipelagic Status indicator 50
(habitats and species)
Condition of the typical species and Epipelagic Status indicator 45
communities
At the whole network level, the epipelagic network had 0.08 modularity and 0.11 edge density,
while for the epibenthic zone we estimated 0.22 modularity and similarly a value of 0.11 for edge
density.
The pressures associated with DSM were characterised for each model compartment to investigate
the relative contribution and ranking of pressures (Figure 5). To further investigate the epibenthic
compartment, the node degree per model component was calculated (Figure 6).
7Figure 5: Node degree of the Pressure nodes for the epipelagic (a) and epibenthic (b) zone.
Figure 6: Ecosystem nodes degree for the epibenthic subnetwork, divided by DPSER groups.
Discussion
Developing a DPSER model requires careful consideration of the specific connections between
activities and pressures, and where those pressures connect in the ecosystem. Comprehensive
literature review is required and in the EcoNet system, consideration needs to be given the
hierarchical structure. Therefore, during the early stages of a DSM project, the modelling process
uncovers the main areas of model importance, information gaps, key linkages and ecosystem
services of main concern which can be used to inform study design and ESIA structure. The models
are spatially explicit, grounded by habitats and biotopes, nested in regions, as the major spatial
units of management. The models can be used to examine the connection between a regulated or
8recommended baseline data requirement and its role in the ecosystem, thereby providing an
effective decision support and stakeholder engagement tool.
Several metrics exist to interrogate different aspects of a DPSER network or compare networks
(e.g. pre- and post-disturbance). In our model, ecosystem services had a high node degree,
reflecting the large number of links to this component and indicating the importance of connecting
status indicators to these nodes. Network-level metrics elucidate which subnetwork is more
resilient to perturbations compared to others. In our example, despite the epipelagic subnetwork
being linked to fewer pressures, it was characterised by lower modularity than the epibenthic
subnetwork, suggesting that this compartment has high interconnectedness and therefore impacts
to one element in this compartment can potentially spread throughout the compartment.
DPSER models have been implemented in a number of whole-of-ecosystem management
programs and when linked with suitable indicators of environment status (which the models
themselves help to determine), the models can provide a common suite of evaluation metrics. The
hierarchical structure and the emphasis on biological responses and functions and services supports
the detection of emergent ecosystem properties that may be missed by atomised studies, an
important consideration given the uncertainties of impact processes in the deep-sea.
The structure of EcoNet style DPSER models encourage unification of studies under a common
ecological structure which could allow more effective collaboration and integration of EBM at
contract and regional level. DPSER style socio-ecological models can be one tool to help define
serious harm and to provide a basis of evidence-based decision making for adaptive management.
9References
1. Niner HJ, Ardron JA, Escobar EG, Gianni M, Jaeckel A, Jones DOB, et al. (2018) Deep-Sea
Mining With No Net Loss of Biodiversity—An Impossible Aim. Frontiers in Marine Science
5(53).
2. Hein JR, Koschinsky A, Kuhn T (2020) Deep-ocean polymetallic nodules as a resource for
critical materials. Nature Reviews Earth & Environment 1(3):158-69.
3. Drazen JC, Sutton TT (2017) Dining in the deep: the feeding ecology of deep-sea fishes. Annual
review of Marine Science 9:337-66.
4. Drazen JC, Smith CR, Gjerde KM, Haddock SH, Carter GS, Choy CA, et al. (2020) Opinion:
Midwater ecosystems must be considered when evaluating environmental risks of deep-sea
mining. Proceedings of the National Academy of Sciences 117(30):17455-60.
5. Levin LA, Mengerink K, Gjerde KM, Rowden AA, Van Dover CL, Clark MR, et al. (2016)
Defining “serious harm” to the marine environment in the context of deep-seabed mining.
Marine Policy 74:245-59.
6. Simon-Lledó E, Bett BJ, Huvenne VAI, Schoening T, Benoist NMA, Jones DOB (2019)
Ecology of a polymetallic nodule occurrence gradient: Implications for deep-sea mining.
Limnology and Oceanography 64(5):1883-94.
7. Stratmann T, Soetaert K, Kersken D, van Oevelen D (2021) Polymetallic nodules are essential
for food-web integrity of a prospective deep-seabed mining area in Pacific abyssal plains.
bioRxiv.
8. Vanreusel A, Hilario A, Ribeiro PA, Menot L, Arbizu PM (2016) Threatened by mining,
polymetallic nodules are required to preserve abyssal epifauna. Scientific Reports 6(1):26808.
9. Guilhon M, Montserrat F, Turra A (2020) Recognition of ecosystem-based management
principles in key documents of the seabed mining regime: implications and further
recommendations. ICES Journal of Marine Science, fsaa229.
10. Yee S ReefLink Database: A decision support tool for Linking Coral Reefs and Society
Through Systems Thinking. Guanica Bay Watershed Update 2012 p. 9.
11. Net Gain (2011) Final Recommendations. Submission to Natural England and JNCC. The North
Sea Marine Conservation Zones Project. The Deep Business Centre. Tower Street Hull.
12. Connor DW, Allen JH, Golding N, Howell KL, Lieberknecht LM, Northen KO, et al. (2004)
The Marine Habitat Classification for Britain and Ireland. Version 04.05 Infralittoral Rock
Section.
13. FGDC (2021) Coastal and Marine Ecological Classification Standard. US Federal Geographic
Data Committee, Washington.
1014. Directive 2008/56/EC of the European Parliament and of the Council of 17 June 2008
establishing a framework for community action in the field of marine environmental policy
(Marine Strategy Framework Directive), 2008.
15. Commission Decision (EU) 2017/848 of 17 May 2017. Laying down criteria and
methodological standards on good environmental status of marine waters and specification and
standardised methods for monitoring and assessment, and repealing Decision 2010/477/EU,
2017.
16. Tylianakis JM, Laliberté E, Nielsen A, Bascompte J (2010) Conservation of species interaction
networks. Biological Conservation 143(10):2270-9.
17.R Core Team (2019) R: A language and environment for statistical computing. Vienna, Austria.
18. Csardi G, Nepusz T (2006) The igraph software package for complex network research.
InterJournal, Complex Systems 1695(5):1-9.
11You can also read