Effect of COVID-19 lockdown on metal concentration in the water column of Asia's largest coastal lagoon
←
→
Page content transcription
If your browser does not render page correctly, please read the page content below
Preprints (www.preprints.org) | NOT PEER-REVIEWED | Posted: 14 June 2021                   doi:10.20944/preprints202106.0378.v1

                  Effect of COVID-19 lockdown on metal concentration in the water column
                  of Asia’s largest coastal lagoon

                      1Syed   Hillal Farooq, 1Amrit Kumar Mishra, 1Sandip Kumar Mohakud, 2Prasannjit
                                      Acharya 2 Pradipta Ranjan Muduli, 1Debadutta Swain
                  1
                   School of Earth Ocean and Climate Sciences, Indian Institute of Technology, Bhubaneswar,
                  Jatni, Khorda, Odisha, India
                  2
                   Wetland Research and Training Center, Chilika Development Authority, Barkul, Balugaon,
                  752030, Odisha, India
                  Corresponding author: hilalfarooq@iitbbs.ac.in
                  ABSTRACT:
                  A complete halt on all anthropogenic activities and human movement due to COVID-19
                  lockdown has provided a great opportunity to assess the impact of human activities on coastal
                  marine ecosystems. The current study assessed the concentration of the metals in water samples
                  of the largest brackish water lagoon of Asia; the Chilika lagoon in the state of Odisha, India
                  between pre-COVID-19 and post-COVID-19 lockdown scenarios. Monthly water samples
                  (n=30 stations) from 0.3 m depth were collected from three sectors of the lagoon seasonally;
                  pre-monsoon, monsoon, and post-monsoon. In addition to various physical parameters [pH,
                  salinity, alkalinity, (DO) dissolved oxygen, (TDS) total dissolved solids, and (EC) electrical
                  conductivity] the collected water samples were analysed for 18 trace metals (Al, As, Ba, Be,
                  Cd, Co, Cr, Cu, Fe, Mn, Mo, Ni, Pb, Sr, Th, Tl, U, V). Most of the physical parameters showed
                  a significant variation between pre-and post-COVID-19 scenarios, except for pH and DO. The
                  concentration of five metals (Be, Cd, Co, Ni, and Pb) remained below detection limits in all
                  water samples. The impact of COVID-19 lockdown on the concentration of the metal in the
                  water samples was noticed along with the three sectors of the lagoon. However, eight metals
                  (Al, As, Cr, Fe, Mn, Th, U, and V) were significantly different between the COVID-19
                  scenarios and the remaining five metals were not statistically significant. The mean
                  concentration of Al, As, Fe, Th, and V were higher in the pre-COVID-19 scenarios, whereas
                  only Cr and Mn were higher in the post-COVID-19 scenarios. The mean concentration of U
                  was similar among both COVID-19 scenarios, even though there were seasonal and sectoral
                  differences. The seasonal influence of riverine influx was more evident on metal concentration
                  during the monsoon season, whereas the difference between sectors was more prominent
                  during the post-monsoon season. An increased number of correlations between physical
                  parameters and metal concentration were observed in the post-monsoon season and post-
                  COVID-19 scenario. This study provides evidence that the imposition of COVID-19 lockdown
                  reduced metal influx in the water column and improved the water quality of the Chilika lagoon.
                  Our results can be used as baseline for metal concentration in surface waters of the lagoon.
                  Keywords: Trace metals, COVID-19, Lagoon ecosystem, Anthropogenic pollution, Water
                  quality, India

                                                                    1

            © 2021 by the author(s). Distributed under a Creative Commons CC BY license.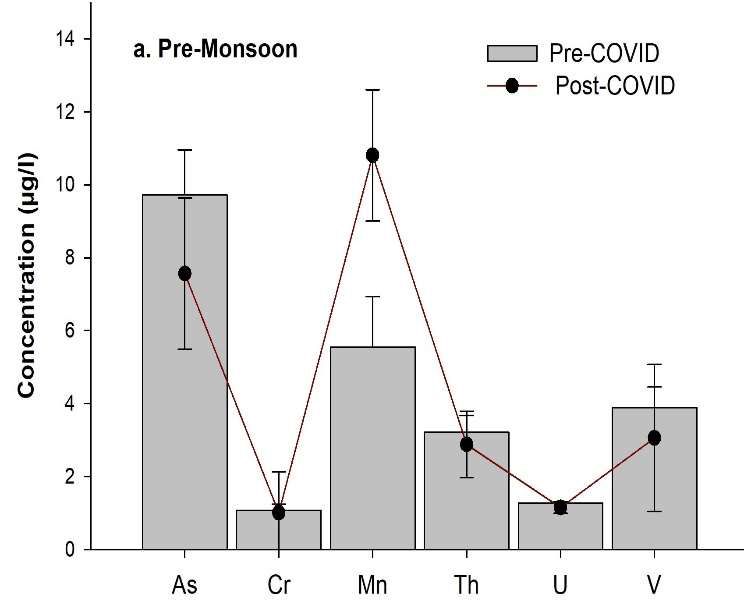
Preprints (www.preprints.org) | NOT PEER-REVIEWED | Posted: 14 June 2021                 doi:10.20944/preprints202106.0378.v1

                  INTRODUCTION
                          The spread of severe acute respiratory syndrome coronavirus-2 (SARS-CoV-2;
                  hereafter called COVID-19) had an impact on the entire world human activities, as it spread
                  across the globe (Cascella et al., 2020; WHO, 2021). Consequently, based on the repeated
                  emergence, rapid transmission, and higher causality rate the WHO declared COVID-19 as a
                  pandemic in March 2020. Following the declaration, in India, the COVID-19 led to a
                  nationwide lockdown and shut down in mid-March 2020. This lockdown (March-October
                  2020) led to the suspension of almost all industrial and agricultural activities across the country,
                  other than the essential services industry which was not closed. Under this lockdown period,
                  industrial and human activities were significantly reduced. This period provided a window of
                  opportunity to study the natural ecosystems under the lack of human-induced disturbances,
                  which would otherwise not be possible. Various researchers in India used this opportunity to
                  assess the air and water pollution status under the influence of the imposed lockdown and
                  observed a reduction in various pollutants in the natural ecosystems (Garg et al., 2020;
                  Lokhandwala and Gautam, 2020; Mishra et al., 2020; Patel et al., 2020). As major river systems
                  discharge various anthropogenic derived pollutants to the coastal ecosystems of India, the
                  lockdown also led to a reduction in coastal pollution (Mishra et al., 2020; Lotliker et al., 2021;
                  Vijay Prakash et al., 2021). However, this lockdown resulted in a decline of phytoplankton
                  biomass in the Bay of Bengal due to reduced input of nutrients (Mishra et al., 2020), whereas
                  reduction in pollutants improved the surface water quality along both the east and the west
                  coast of India (Vijay Prakash et al., 2021; Lotliker et al., 2021). However, these studies did not
                  quantify the concentration of various metals in the coastal water column, which also plays an
                  important role in maintaining water quality (Richir and Gobert, 2014). Consequently, the
                  concentration of various trace metals was quantified in the river Ganga in India during this
                  COVID-19 lockdown period and it was observed that due to lack of anthropogenic input there
                  was a reduction in the input of around 50% of the metals in the water column (Shukla et al.,
                  2021).
                           The coastal areas of India are dynamic ecosystems where there is a confluence of fresh
                  and marine water. Being at the interface of land and marine systems these ecosystems receive
                  river discharges, dredging, waste dumping, industrial effluents, domestic sewage disposal, and
                  various other pollutants (Gopal et al., 2018; Vijay Prakash et al., 2021). This continuous input
                  of anthropogenic pollutants exerts a significant impact on the coastal environments (Häder et
                  al., 2020). As a result, coastal ecosystems act as a sink of contaminants including metals (Lewis
                  and Richard, 2009). These metals play a critical role in marine ecosystem functioning (Avelar
                  et al., 2013; Mishra et al., 2019; Morsy et al., 2020). Among these metals, some are essential
                  micronutrients (Cu, Mn, Zn, etc.) for the primary producers, whereas others act as non-essential
                  and toxic to organisms (As, Cd, Cr, Hg, and Pb) when the concentration of these metals exceed
                  threshold levels (Millero et al., 2009; Stockdale et al., 2016). In recent years, the coastal waters
                  of India are experiencing water quality deterioration as a result of increasing anthropogenic
                  activities and influx of these materials into the coastal waters (Tripathy et al., 2014; Mishra et
                  al., 2015). Therefore, making it essential to monitor trace metals concentrations in the coastal
                  waters.
                          Chilika lagoon in the state of Odisha, India is one such important coastal ecosystem
                  that harbours a rich diversity of plants and animals and sustains considerable anthropogenic
                  pressure from various fishing and tourism activities (Madhusmita, 2012; Mohanty et al., 2016).
                  Considering its ecological significance, the nodal agency for monitoring of this lagoon, i.e.,
                  Chilika Development Authority (CDA) and various other researchers have monitored the water
                  quality of this lagoon (Panda et al., 2010; Ganguly et al., 2015; Barik et al., 2019; Nazneen et

                                                                   2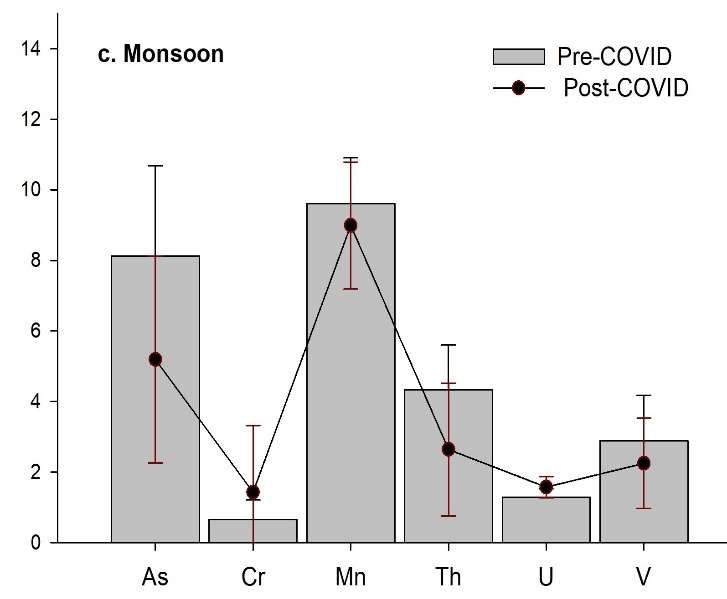
Preprints (www.preprints.org) | NOT PEER-REVIEWED | Posted: 14 June 2021 doi:10.20944/preprints202106.0378.v1
al., 2019; and references therein). Consequently, various other studies have also monitored the
metal concentration in the sediment of this lagoon (Banerjee et al., 2017; Barik et al., 2018;
Nayak et al., 2004; Nazneen et al., 2019 and references therein) and fishes and crab tissues
(Nayak et al., 2015; Parida et al., 2017; Panda et al., 2019). However, there is a significant lack
of information on the metal concentrations in the water column of this lagoon, considering the
positive impact of both riverine freshwater influx and saline water from the Bay of Bengal
(Panda et al., 2015; Sahu et al., 2014).
However, there are few studies on the coastal waters of the Bay of Bengal on water
quality and particulate matter (Mishra et al., 2020; Lotliker et al., 2021) which have been
conducted during the lockdown period, but there are no such attempted studies to provide an
overview of trace metals contamination or reduction during the COVID-19 lockdown.
Secondly, the lockdown period due to COVID-19 provided an opportunity to assess this metals
influx from riverine input as most of the human activities were suspended during this period.
Therefore, the proposed study looks into the concentration of metals in the water samples of
the Chilika lagoon, where there is an input of anthropogenic contaminants from various rivulets
and agricultural activities.
The proposed study also quantifies the concentration of various metals in the surface
water of the Chilika lagoon in three sectors; northern, central, southern, and three seasons; pre-
monsoon, monsoon, and post-monsoon and compare the concentration of the metals between
pre-COVID-19 (the year 2019-20) and post-COVID-19 (the year 2020-21) conditions. It is
hypothesized that due to the implementation of lockdown and shutdown of industrial and
human activities there should be a low concentration of metals in the post-COVID-19
scenarios. The study also measures the physical parameters of the lagoon and assesses the
correlation between seasons, sectors, and metals concentration.
METHODS
Study site:
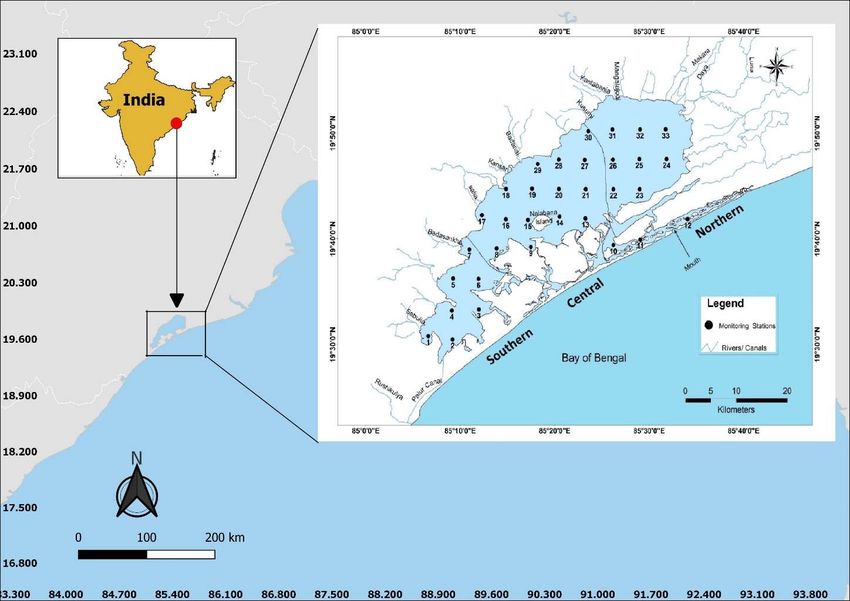
Chilika lagoon is Asia’s largest freshwater lagoon spread across 1165 km 2 (CDA,
2021). This lagoon is situated on the east coast of India in the state of Odisha of India (Fig.1).
The lagoon consists of various habitats such as seagrasses, salt marshes, mudflats, and island
ecosystems that make it one of the biodiverse ecosystems. It supports the livelihood of millions
of coastal fishermen population and acts as a feeding and breeding ground for millions of
migratory birds that come through the Central Asian Flyway (CDA, 2021). The cris-cross width
of the lagoon is around 32 km long and the lagoon is connected with the Bay of Bengal through
an artificially opened mouth (Sahu et al., 2014; Mohanty et al., 2016; Sahoo et al., 2018).
Through this mouth, there is an input of saline water which influences the water characteristics
of the lagoon (Barik et al., 2020). Other than this sea mouth, a few canals such as the Palur
canal bring seawater into the southern part of the lagoon (Fig.1). Other than these inputs there
are silt-borne freshwater discharges from the rivulets of the Mahanadi river, which drains into
the lagoon in the northern part of the lagoon. Similarly, there is drainage from degraded
catchment basins from the western and southern boundaries (Nazneen et al., 2019). For the
current study the lagoon is divided into three sectors; northern sector (n=8 stations), central
sector (n=15 stations), and southern sector (n=7 stations).
3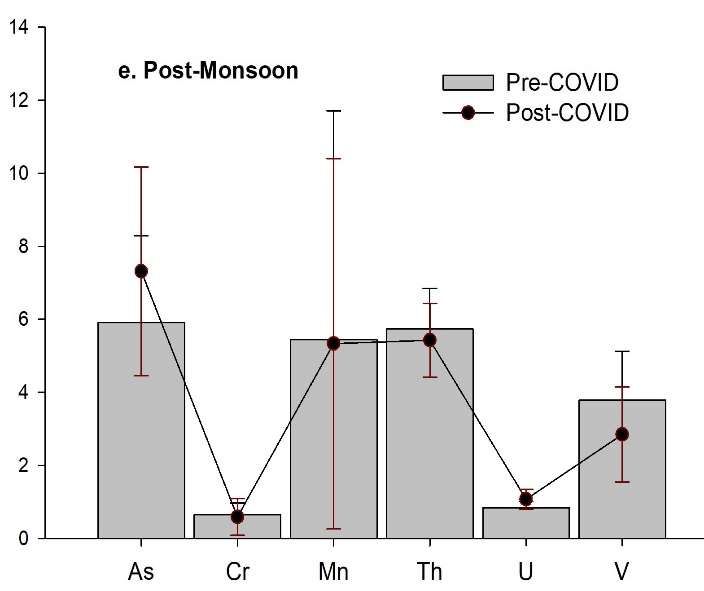
Preprints (www.preprints.org) | NOT PEER-REVIEWED | Posted: 14 June 2021             doi:10.20944/preprints202106.0378.v1

                  Fig.1. Map showing the sampling locations and three sectors of the Chilika lagoon, Odisha,
                  India.

                  Sample collection and analysis
                           Sampling was carried out from 30 prefixed locations by Wetland Research and Training
                  Center (WRTC) of CDA, Odisha, which is the nodal agency for monitoring the water quality
                  of the lagoon. Water samples were collected in May, July, September, November, and January
                  of 2019, 2020, and 2021 and divided into pre-monsoon (May), Monsoon (July +September),
                  and post-monsoon (November +January). Niskin sampler of 5 L was used to collect the sub-
                  surface (0.3 m) water samples from all the 30 stations in the three seasons for the year 2019-
                  20 and 2020-21. Physical parameters of the water samples such as pH, salinity, and electrical
                  conductivity (EC) were measured using a water quality probe (SONDE, YSI, Model no. 6600,
                  V2). Dissolved oxygen (DO) was quantified following the modified Winkler’s method
                  (Carpenter, 1996). Total alkalinity (AT) was measured following the acid titration method
                  (APHA, 2005). All of these physical parameters were analyzed for respective parameters
                  within 12 hours of sampling in the laboratory of WRTC, CDA, Odisha.
                          Nitric acid-washed 100 mL polyethylene bottles were used for the collection of water
                  samples from the 30 stations. From each station n=3 replicates were collected, acidified with
                  nitric acid (0.5 mL of HNO3, 14M Ultrapure) transported to the laboratory in dark boxes, and
                  were stored at 4ºC till further analysis. 18 trace metals (Al, As, Cd, Co, Cr, Cu, Fe, Mn, Mo,
                  Ni, Pb, Sr, Th, Tl, U, and V) were analyzed using ICP-OES (5110, Agilent, Dual view).
                  Calibration curves were prepared by analyzing the standards (Mixed Certified Calibration
                  Verification Standard, Agilent) of known concentrations. The concentration of metals in the

                                                                4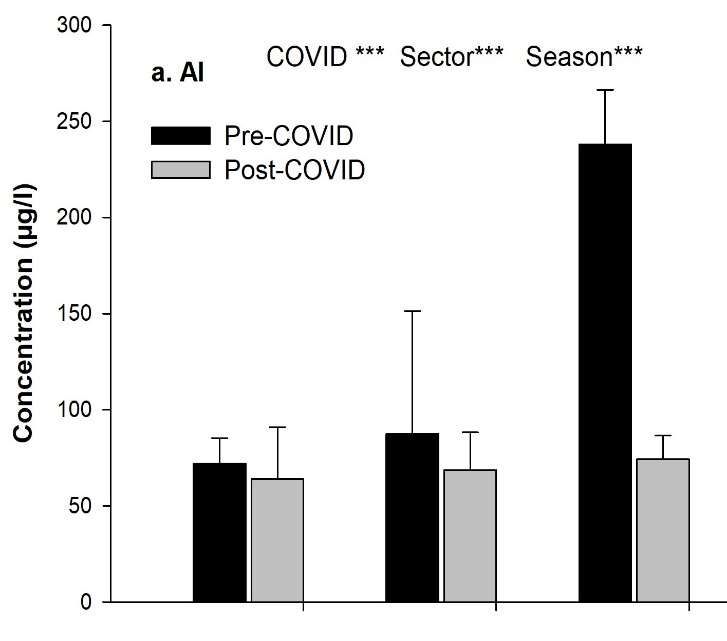
Preprints (www.preprints.org) | NOT PEER-REVIEWED | Posted: 14 June 2021                doi:10.20944/preprints202106.0378.v1

                  water samples was determined by comparing the wavelength and intensities with reference to
                  the calibration curve. The concentration of metals was expressed in µg/l or µg/l (parts per
                  billion).
                  Statistics
                          Data are shown as mean ± 1 standard deviation (SD) of the mean. A three-way ANOVA
                  was used to test for significant differences in metals concentration and between physical
                  parameters in the water samples among COVID-19 scenarios (fixed factor with 2 levels; pre-
                  and post-COVID-19), seasons (fixed factor with 3 levels; pre-monsoon, monsoon, and post-
                  monsoon) and sector (fixed factor with 3 levels; northern, central and southern) of the Chilika
                  lagoon. All data were first checked for homogeneity of variances (Flinger test) and normality
                  of distribution (Shapiro-Wilk's test). When ANOVA assumptions were not verified even after
                  root-squared or Log10 transformation, the Holm-Sidak test for multiple comparisons among
                  factors and their interactions was used. Pearson correlation coefficient was used to test the
                  correlation between physical parameters of the water samples and the concentration of the
                  metals. All statistical tests were conducted with a significance level of α = 0.05. All statistical
                  tests were conducted using SIGMAPLOT statistical software (ver.11.05).
                  RESULTS
                  Physical parameters
                          In general, the physical parameters of the Chilika lagoon varied significantly between
                  the three sectors and seasons. The physical parameters were significant and different between
                  the pre-and post-COVID-19 scenarios except for pH and DO (Table 1 and 2). Between the
                  COVID-19 scenarios the average pH, salinity, and DO were similar for the entire lagoon,
                  whereas the TDS (144.18 ± 111mg/l) and EC (79.57± 29 mS/cm) were 11-fold and 12-fold
                  higher in the post-COVID than the pre-COVID-19 scenarios. In the pre-monsoon season, the
                  TDS and EC of post-COVID scenarios were 3.2-fold and 2.8-fold higher than pre-COVID-19,
                  whereas pH, AT, and salinity were 1-fold higher. In the monsoon season, the EC was 41-fold
                  higher in the post-COVID than pre-COVID-19 scenario, whereas pH, AT, and salinity were 1-
                  fold lower in the post-COVID-19 scenarios. However, in the post-monsoon season, the EC was
                  16-fold higher in the post-COVID-19 scenario, whereas pH, salinity, and DO were 1-fold lower
                  than pre-COVID-19 scenario (Table 1). In the pre-COVID-19 scenario and seasons, the
                  southern sector of the lagoon has the highest mean values for most parameters except DO,
                  whereas in the post-COVID-19 scenario the southern sector has higher values for pH, A T and
                  salinity and the northern sector for DO, TDS, and EC (Table 1).
                  Metals content in the water
                  Out of the 18 trace metals analysed in the water samples, the concentration of five metals (Be,
                  Cd, Co, Ni, and Pb) were found to be below the detection limit at the majority of the stations.
                  Out of the remaining13 trace metals, the concentration was significant and different for 8
                  metals, except for Ba, Cu, Mo, Sr, and Tl (Fig.2 and 3 and Table 3).
                  Pre-monsoon season
                  In the pre-monsoon season, the concentration of metals such as Al, As, Fe, and Th were higher
                  in the pre-COVID-19 scenarios than post-COVID-19, whereas the concentration of Mn was
                  higher in post-COVID-19, and metals like Cr, U, and V were similar between both COVID-19
                  scenarios (Fig.2 and 3). The mean concentration of Al (132.53 ± 25.63 µg/l), As (9.72 ± 1.24
                  µg/l), Fe (40.67 ± 2.20 µg/l), and Th (3.21± 0.46 µg/l) in the pre-COVID-19 were 2-fold, 1.2-
                  fold, 1-fold and 1-fold higher than the post-COVID-19 scenario respectively (Fig. 4a and b).

                                                                  5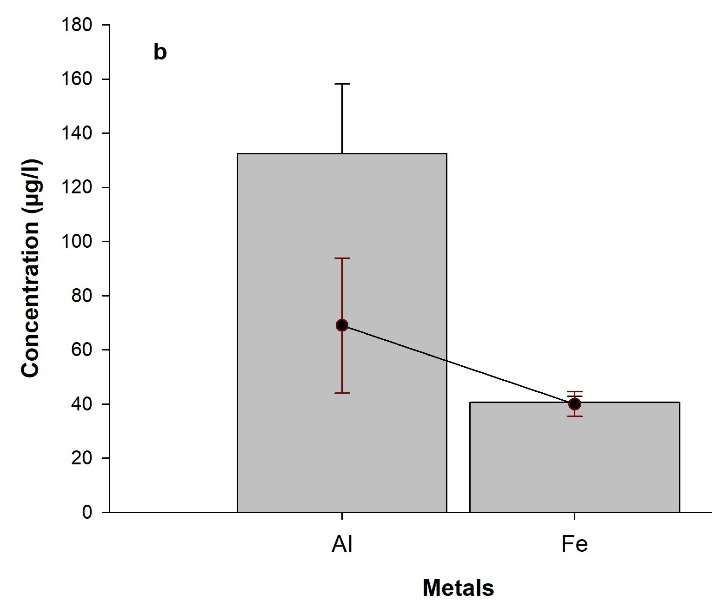
Preprints (www.preprints.org) | NOT PEER-REVIEWED | Posted: 14 June 2021   doi:10.20944/preprints202106.0378.v1

                              Pre-Monsoon                                      Monsoon                            Post-Monsoon

                                                                           6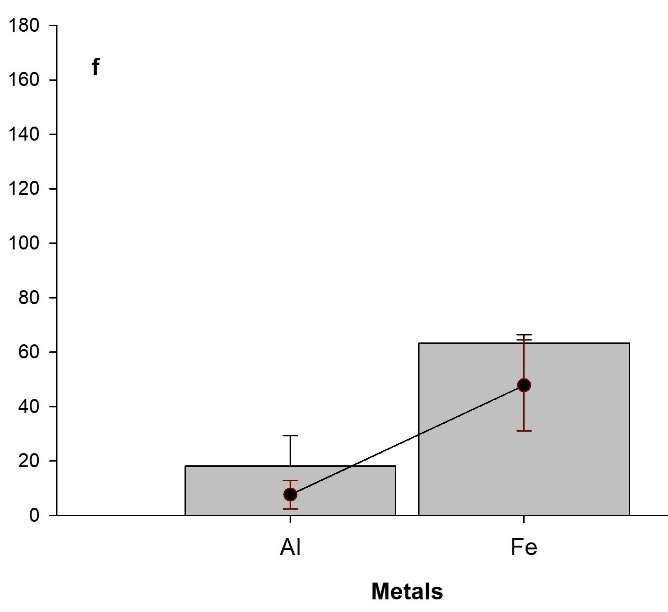
Preprints (www.preprints.org) | NOT PEER-REVIEWED | Posted: 14 June 2021   doi:10.20944/preprints202106.0378.v1

                                                                           7
Preprints (www.preprints.org) | NOT PEER-REVIEWED | Posted: 14 June 2021 doi:10.20944/preprints202106.0378.v1
8Preprints (www.preprints.org) | NOT PEER-REVIEWED | Posted: 14 June 2021 doi:10.20944/preprints202106.0378.v1
Fig.2. Metal concentration (mean ± SD) in the surface water of the Chilika lagoon within three sectors and seasons in pre- and post-COVID
scenarios. Common elements with statistical significance between the three factors (COVID, sectors and seasons) derived from three-way ANOVA
analysis are presented. Significance level (pPreprints (www.preprints.org) | NOT PEER-REVIEWED | Posted: 14 June 2021 doi:10.20944/preprints202106.0378.v1
Pre-Monsoon Monsoon Post-Monsoon
Fig.3. Metal concentration (mean ± SD) in the surface water of the Chilika lagoon within three sectors and seasons in pre- and post-COVID
scenarios. Common elements with statistical significance between the COVID scenarios and not within seasons or sectors derived from three-way
ANOVA analysis are presented. Significance level (pPreprints (www.preprints.org) | NOT PEER-REVIEWED | Posted: 14 June 2021 doi:10.20944/preprints202106.0378.v1
Fig.4 Mean metal concentration ± standard deviation of statistically significant elements (Al, As, Cr, Fe, Mn, Th, U and V) in post-COVID
scenarios between sectors and seasons are plotted against pre-COVID scenarios. Elements such as Al and Fe are separated due to their high
concentration than other elements for better representation. Pre-monsoon (a and b), monsoon (c and d) and post-monsoon (e and f).
11Preprints (www.preprints.org) | NOT PEER-REVIEWED | Posted: 14 June 2021 doi:10.20944/preprints202106.0378.v1
Table 1. Physical parameters of the water samples of the Chilika lagoon. pH (Total Scale units, TS), alkalinity (AT, mg/l), Dissolved oxygen (DO,
ppm), Total dissolved solids (TDS, mg/l), Electrical conductivity (EC, milli Siemens/cm).
Pre-COVID Post-COVID
Sectors Sectors
Seasons Northern Central Southern Northern Central Southern
Pre-Monsoon pH (TS) 7.71±0.38 8.11±0.27 8.13± 0.38 8.47±0.57 8.48 ± 0.56 8.78± 0.24
AT (mg/l) 109.25± 17.4 128.64 ±18.87 141.71± 16.58 116±21.6 163 ± 30.25 182.85± 22.9
Salinity 4.76±4.14 16.49 ±5.20 11.85 ± 0.51 4.28±4.01 11.07± 9.54 8.32± 0.97
DO (ppm) 7.56±1.22 7.38 ±1.28 6.38± 1.67 7.74±1.57 6.64± 1.93 7.60± 1.42
TDS (mg/l) 6.55±5.58 20.76 ± 6.65 15.78 ± 0.54 123.45±21.5 10.95±6.88 6.98± 0.75
EC (mS/cm) 9.63±8.20 30.56 ± 9.80 23.20± 0.77 141±39.4 22.35± 14.05 14.24±1.53
Monsoon pH (TS) 7.82±0.39 8.10±0.17 8.22 ± 0.15 7.81±0.31 7.90±0.27 8.03±0.45
AT (mg/l) 1.49±1.55 6.89±2.71 11.47±1.28 0.66±0.78 6.51±3.66 9.37±0.34
Salinity 123±14.68 133±19.73 156 ± 13.24 110±27.38 130.3±19.5 141.42±.9.3
DO (ppm) 8.51±1.31 7.81±1.40 6.59±0.66 8.11±1.09 8.09±0.77 7.94±1.15
TDS (mg/l) 0.11±0.04 1.86±2.08 7.69±1.61 137±125.8 120.3±16.6 7.81 ± 0.26
EC (mS/cm) 0.24±0.10 3.72±4.02 15.67±3.36 434±44.4 361±52.1 15.94±0.54
Post-Monsoon pH (TS) 8.05±0.31 8.49±0.32 8.37±0.17 7.59±0.20 8.18±0.31 8.36±0.21
AT (mg/l) 124±15.31 150±15.56 166 ± 7.07 142±5.87 182±18.42 201±19.64
Salinity 0.41±0.18 3.99±1.80 6.73±0.46 0.54±0.43 3.80±1.44 6.49±0.70
DO (ppm) 9.70±0.95 9.24±0.74 8.52±0.48 8.72±1.25 7.82±0.93 7.79±1.11
TDS (mg/l) 0.35±0.16 3.37±1.41 5.75±0.36 232±104 70.48±138 5.51±0.50
EC (mS/cm) 0.73±0.35 6.41±3.13 11.77±0.69 162±53 135±265 11.25±1.02
12Preprints (www.preprints.org) | NOT PEER-REVIEWED | Posted: 14 June 2021 doi:10.20944/preprints202106.0378.v1
Table 2. Significant difference of various physical parameters of the water samples between pre- and post-COVID scenarios, seasons and within
the three sectors of the Chilika lagoon derived from three-way ANOVA analysis at significance level (pPreprints (www.preprints.org) | NOT PEER-REVIEWED | Posted: 14 June 2021 doi:10.20944/preprints202106.0378.v1
Table 3. Significant difference between element concentration in the water samples between pre- and post-COVID scenarios, seasons and within
the three sectors of the Chilika lagoon derived from three-way ANOVA analysis at significance level (pPreprints (www.preprints.org) | NOT PEER-REVIEWED | Posted: 14 June 2021 doi:10.20944/preprints202106.0378.v1
The mean concentration of Mn (10.81 ± 1.8 µg/l) in the post-COVID-19 scenario was 2-fold
higher than pre-COVID-19 (Fig.4). The concentration of Al and As in the pre-monsoon season
of pre-COVID-19 was highest among seasons and sectors (Fig.4a and b). In the pre-monsoon
season, between sectors and COVID-19 scenarios, the concentration of various metals did not
follow a similar pattern of increase or decrease (Table 4). The concentration of Al and Th
between sectors followed a similar pattern of increase in both COVID-19 scenarios. Whereas
metals like As, U, and V followed a similar pattern in the pre-COVID-19 and a different pattern
in the post-COVID-19 scenarios (Table 4).
Table 4. Mean concentration ± standard deviation of statistically significant elements in pre-
and post-COVID scenarios between sectors and seasons. The pattern of increase or decrease
of element concentration is presented. Bold letters indicate the pattern is same in pre-and
post-COVID scenarios. Southern (S) Central (C) and Northern (N)
Season Elements Pre-COVID Post-COVID
Pre-Monsoon Al S>C>N S>C>N
As S>C>N* C>S>N*
Cr N>S=C N>C>S#
Fe C=N>S# C>N>S#
Mn N>C>S C>N>S#
Th S>C>N S>C>N
U S>C>N CN*
V S>C>N CN*
Monsoon Al C>S>N N>S>C
As S=N>C# C=S>N
Cr C>N>S S>C>N#
Fe C=S>N C=S>N
Mn C>S>N C>S>N
Th S=N>C# C>S=N
U C=S>N C=S>N
V S>N>C C=S>N#
Post-Monsoon Al C>S>N C>S>N
As C>S>N S>C>N#
Cr N>C>S N>C>S#
Fe C=N>S# S>C>N#
Mn C>S>N S>C>N#
Th C>S>N C>S>N
U S>C>N S>C>N
V C>S>N C>S>N
(*) indicate the patterns are different between pre-and post-COVID, but similar patterns are
observed for different elements.
(#) indicates similar pattern for an element between seasons or COVID scenarios.
15Preprints (www.preprints.org) | NOT PEER-REVIEWED | Posted: 14 June 2021 doi:10.20944/preprints202106.0378.v1
Monsoon season
The mean concentration of metals like Al (63.31 ± 46.84 µg/l), Cr (1.42 ± 1.89 µg/l), Fe
(52.21±12.71), and U (1.57 ± 0.30 µg/l) were 2-fold, 2.1-fold and 1-fold and 1.2-fold higher in
the monsoon season for post-COVID-19 than pre-COVID-19 scenarios respectively (Fig.2, 3
and 4c and d). Whereas the concentration of metals like As (8.13± 2.56 µg/l), Mn (9.61
±1.3µg/l), Th (4.33±1.28 µg/l), and V (2.89± 1.29 µg/l) was 1.5-fold, 1-fold, 1.6-fold, and 1.2-
fold higher in pre-COVID-19 scenarios respectively (Fig.2, 3 and 4). For the monsoon season,
the concentration of Cr and U in the post-COVID-19 scenarios were the highest among seasons
and sectors (Fig.4c and d). The concentration of metals like Fe, Mn, and U in the monsoon
season between COVID-19 scenarios followed a similar pattern of increase, whereas As and
Th followed a similar pattern of increase in pre-COVID-19 scenarios, and Cr and V followed
a similar pattern in post-COVID-19 scenarios (Table 4).
Post-monsoon season
In the post-monsoon season, the mean concentration of As (7.31 ± 2.60 µg/l) and U (1.07 ±
0.31µg/l) were 1.2-fold higher in post-COVID-19 than in the pre-COVID-19 scenarios (Fig.2
and 4). However, the concentration of Al (18.14 ± 11.17 µg/l), Cr (0.64 ± 0.32 µg/l), Fe (63.25
± 3.12 µg/l), Mn (5.44 ± 6.26µg/l), Th (5.78 ± 1.10 µg/l), and V (3.78 ± 1.34 µg/l) were 1.6-
fold, 1.1-fold, 1.2-fold, 1-fold, 1-fold and 1.3-fold higher than post-COVID-19 scenario
respectively (Fig.2 and 4e and f). Most of the metals (Al, Cr, Th, U, and V) followed the same
pattern on increase between both COVID-19 scenarios, exception was As, Fe, and Mn (Table
4). The highest concentration of As, Fe, and Mn followed a similar pattern of distribution in
post-COVID-19 than pre-COVID-19 scenarios (Table 4).
Correlation
The correlation between physical parameters and metals concentration in the water column was
significant only for a few metals and parameters for the COVID-19 scenarios (Table 5). In the
pre-monsoon season, a higher number of correlations between physical parameters and metals
were observed in pre-COVID-19 than post-COVID-19 scenarios (Table 5). In the pre-COVID-
19 scenario pH was observed with a negative correlation with Ba, Mo, and U, and in post-
COVID-19 with Ba (Table 5). For AT, there were positive correlations with Th and V in pre-
COVID-19 scenarios and no correlation in the post-COVID-19. Salinity was positively
correlated with Mo and U in pre-COVID-19, Al, and Mn in the post-COVID-19. Though there
were positive and negative correlations between TDS and EC with Mn and Mo in pre-COVID-
19, no such interactions were observed for the post-COVID-19 (Table 5).
For the monsoon season, only U and V were observed with a positive correlation with most
physical parameters in pre-and post-COVID-19 scenarios (Table 5). There were no correlations
in the pre-COVID-19 scenario with pH, except for U, whereas in post-COVID-19 only Cr was
positively correlated with pH. The metals As and Mo were positively correlated with salinity
only in the post-COVID-19 scenario, whereas U is positively correlated with salinity in both
COVID-19 scenarios. DO was only positively correlated with Tl in the pre-COVID-19,
whereas there were no correlations with DO and EC in the post-COVID-19 scenario. A T was
positively correlated with Th and U in pre-COVID-19 and with only U in post-COVID-19.
With TDS, U was positively correlated in pre-COVID-19 and negatively correlated in post-
COVID-19 (Table 5).
16Preprints (www.preprints.org) | NOT PEER-REVIEWED | Posted: 14 June 2021 doi:10.20944/preprints202106.0378.v1
Table 5. Correlation between physical parameters and element concentration in the water samples among seasons and COVID scenarios of the
Chilika lagoon. Pearson correlation co-efficient and p values are presented (in bold) which showed a significant positive or negative correlation.
Alkalinity (AT), Dissolved oxygen (DO), Total dissolved solids (TDS), Electrical conductivity (EC), Salinity (S)
Season Elements Pre-COVID Post-COVID
pH AT S DO TDS EC pH AT S TDS EC
Pre-Monsoon Al - - - - - - - - 0.469, - -
0.01
Ba -0.622, - - - - - -0.534, - - - -
0.003 0.002
Mn - - - - 0.801, - - - 0.451, - -
0.003 0.01
Mo -0.414, 0.432, -0.403, -0.391, - - - - -
0.02 0.02 0.03 0.003
Th - 0.394, - - - - - - - - -
0.03
U -0.497, - 0.444, - - - - - - - -
0.006 0.01
V - 0.544, - -0.407, - - - - - - -
0.002 0.02
Monsoon As - - - - - - - - 0.402,
0.02
Ba - - - - 0.426, 0.421, - - - - -
0.02 0.01
Cr - - - - - - 0.437, - - - -
0.01
Cu - - - - 0.362, 0.384, - - - -
0.04 0.03
Fe - - 0.386, - - - - - - - -
0.03
Mo - - - - - - - - 0.408, - -
0.002
Th - 0.459, - - - - - - - - -
0.01
17Preprints (www.preprints.org) | NOT PEER-REVIEWED | Posted: 14 June 2021 doi:10.20944/preprints202106.0378.v1
Tl - - - 0.426, - - - - - 0.396, -
0.01 0.03
U 0.496, 0.461, 0.714, - 0.551, 0.534, - 0.404, 0.681, -0.407, -
0.005 0.001 0.0009 0.001 0.002 0.02 0.005 0.02
V - - - - - 0.414, - 0.521, - - -
0.02 0.02
Post-Monsoon Al - - - - - - - - - - 0.457,
0.01
As - - 0.412, - - - - - - - -
0.02
Ba 0.451, 0.532, 0.604, -0.495, 0.669, 0.624, 0.571, 0.794, 0.798, -0.618, -
0.01 0.002 0.005 0.006 0.007 0.003 0.001 0.002 0.002 0.003
Cr - - -0.577, - -0.480, -0.503, -0.697, -0.730, -0.769, 0.630, -
0.001 0.008 0.005 0.002 0.006 0.001 0.002
Cu - - - - - - 0.508, - - - -
0.004
Fe - - - - - - 0.555, 0.663, 0.800, -0.726, -
0.001 0.009 0.001 0.008
Mn - - - - - - -0.638, -0.657, -0.651, 0.525, -
0.001 0.001 0.001 0.003
Mo 0.595, 0.744, 0.736, 0.732, - - 0.402, - -
0.006 0.003 0.007 0.006 0.02
Th - - - - - - -0.525, -0.594, -0.616, 0.511, -
0.003 0.006 0.003 0.004
Tl - - - - - - - -0.491, -0.381, 0.489, -
0.006 0.04 0.006
U 0.507, 0.645, 0.825, -0.533, 0.811, 0.828, -0.458, -0.398, -0.433, - -
0.005 0.001 0.003 0.001 0.009 0.002 0.01 0.03 0.01
V 0.512, 0.375, 0.522, 0.434, -0.555,
0.02 0.04 0.003 0.01 0.001
18Preprints (www.preprints.org) | NOT PEER-REVIEWED | Posted: 14 June 2021 doi:10.20944/preprints202106.0378.v1
Most of the metals of post-COVID-19 were correlated with physical parameters in the post-
monsoon season (Table 5). However, an increased number of correlations between metals and
physical parameters were observed in post-COVID-19 than in the pre-COVID-19 scenarios.
The metals like Ba and U were positively correlated with physical parameters except DO in
the pre-COVID-19 scenario. Consequently, Ba was positively correlated with pH, A T, salinity
and negatively correlated with TDS. Whereas U was negatively correlated with pH, A T and
salinity in post-COVID-19. Similarly, Mn was negatively correlated with pH, AT and salinity
and positively correlated with TDS. On the other hand, Fe was positively correlated with pH,
AT and salinity and negatively correlated with TDS in the post-COVID-19 scenarios (Table 5)
DISCUSSION
Coastal ecosystems receive a large influx of anthropogenic contaminants through
riverine input and these contaminants are reflected in the water, sediment, and associated
biodiversity of these ecosystems (Nazneen et al., 2019; Vijay Prakash et al., 2021; Lotliker et
al., 2021). Our results suggest a similar phenomenon, where the COVID-19 induced lockdown
has halted various industries and human activities and resulted in the reduction of various
metals in the water samples of the Chilika lagoon. The Chilika lagoon has a high influence of
the seasonal influx of freshwater during the monsoon season, which also brings a large quantity
of dissolved organic materials, which can also influence the metal content in the water column
(Panda et al., 2010; Sahu et al., 2014; Barik et al., 2018). This seasonal influx of materials and
mixing with saline water also influences the physical parameters of the lagoon between the
three sectors, which are evident in the results irrespective of the COVID-19 scenarios.
The lockdown induced due to COVID-19 was a blessing in disguise, where human-
derived impacts were reduced through the shutdown of industrial activities (Muhammad et al.,
2020). One of the major rivers that supply water to the Chilika lagoon is the river Mahanadi
(61% inflow), which passes through Indian states of Chhattisgarh and Odisha ( Mishra and
Dwibedy, 2015; Hussain et al., 2020). In general, this river along with 53 more small river
tributaries brings the majority of the influx of various contaminants from the small scales
industries, agricultural and mining fields into the Chilika lagoon ecosystem (Sundaray et al.,
2012; Mohanty and Samanta, 2016; Hussain et al., 2020). As a result, most of the metals like
Al, As, Fe, Th, U, and V were higher in the pre-COVID-19 scenarios (Fig.4). Even though the
metals like Ba, Mo, Sr, and Tl that were not statistically significant were also higher in pre-
COVID-19 scenarios along with metals Be, Cd, and Ni which were observed in below detection
limit in more than one sector (See Supplementary Table 1 and Fig.1). However, certain metals
like Cr, Cu, Mn, and Pb were only 1-fold higher in the post-COVID-19 scenario than the pre-
COVID-19, which suggests that these metals were incorporated into the water column through
the natural, seasonal and biogeochemical processes of the system which remained the same,
even during shutdown of industrial inputs (Barik et al., 2018; Nazneen et al., 2019).
Seasonal and sectoral influence is predominant in this lagoon ecosystem, where the
northern sectors receive the highest influx of freshwater and the southern sector the lowest,
whereas the central sector of the lagoon acts as a permeable sector between fresh and saline
water (Panigrahi et al., 2007; Rajawat et al., 2007; Sahu et al., 2014; Barik et al., 2018). The
Indian monsoon arrived in the state of Odisha on June 11 and 12 for the years 2019 and 2020
respectively (IMD, 2019, 2020) suggesting that the influence of the onset of monsoon season
on the variation of metal content was minimum. Further, the water influx during both monsoon
periods was not different and had very low variability between both years (IMD, 2020),
probably diminishing the effect of monsoon on metal concentration. However, it has been
19Preprints (www.preprints.org) | NOT PEER-REVIEWED | Posted: 14 June 2021 doi:10.20944/preprints202106.0378.v1
observed that most of the metal concentrations remains higher either in pre-monsoon or post-
monsoon seasons, except for few metals like Mn and U in pre-COVID-19 scenarios and Cr,
Fe, and U in post-COVID-19 scenarios (Fig.4). Mostly in the monsoon season, the standard
deviation of metals concentration was significantly higher compared to the pre-monsoon and
post-monsoon seasons. This was particularly due to the dilution effect as the freshwater in high
quantities enters into the lagoon during the monsoon period. Secondly, higher standard
deviation between the sampling stations of individual sector reflects the internal dynamics of
the lagoon, i.e., distance from the landward or seaward influence, local macrophytes, and
fishing activities (Amir et al., 2019; Nazneen et al., 2019a).
Consequently, there is a significant variation in salinity, AT, TDS, and EC along with
the three sectors of the lagoon, which was also evident in our results (Table 1 and 2). Even
though the variation in pH and DO were not statistically different between COVID-19
scenarios, there were significant variations between seasons and sectors. The positive
correlation between these physical parameters and metals indicates the effect of change in
physical parameters in controlling the metal concentration (Nazneen et al., 2019). These results
also indicates that, the seasonal influence was more relevant in the post-monsoon seasons in
both COVID-19 scenarios, with an increasingly higher number of correlations of physical
parameters with metal concentrations (Table 5). The high values of TDS in the water samples
of the lagoon in the post-COVID-19 scenario could be the reason for the high concentration of
Cr and Mn. Consequently, these two metals also had a positive correlation with TDS in the
post-COVID-19 scenarios (Table 5).
Other than the seasons and sectoral differences during COVID-19 scenarios, the three
sectors of the lagoon were dominant by different macrophytes and macroalgae, such as seagrass
are dominant in the southern sector, the central sector is dominant by macroalgae, and the
northern sector by freshwater macroalgae and saltmarsh plants, which also play an important
role in bioaccumulation of these metals and metal cycling (Sanz-Lázaro et al., 2012; Bonanno
et al., 2017). The role of these macrophytes in sector-wise productivity that leads to variation
in metal accumulation, cycling, and release of sediment-bound metals has also been observed
in the Chilika lagoon (Amir et al., 2019).
Conclusion
COVID-19 is declared as a pandemic across the globe during which most of the industrial and
human-derived activities were restricted under the lockdown period. This provided an
opportunity to assess the effects of this lockdown on various natural ecosystems, which
otherwise would have been impossible to replicate. In the present study, the metal
concentration in the water column of the Chilika lagoon in pre-and post-COVID-19 scenarios
were compared. Lower concentrations of various metals have been observed in the post-
COVID-19 scenarios than in pre-COVID-19 conditions. This led to conclude that halt of
industrial and mining activities in the catchment area has resulted in lowering the concentration
of these metals in the lagoon ecosystem. Consequently, certain metals like Cr and Mn
concentration have shown 1-fold higher concentrations in the post-COVID-19 scenario,
suggesting the complex internal dynamics of the lagoon, which is mainly driven by salinity and
macrophytes. The results of this study can be used as a baseline for metal concentrations in the
surface water of this lagoon system. This study also suggests that, the lockdown induced due
to COVID-19 reduced the metal concentrations to some extent, but the natural biogeochemical
process and seasonal influence of monsoon on the lagoon are more evident in the variation of
metals in the three sectors than COVID-19 scenarios.
20Preprints (www.preprints.org) | NOT PEER-REVIEWED | Posted: 14 June 2021 doi:10.20944/preprints202106.0378.v1
Acknowledgments
We are thankful to World Bank for their help in establishing laboratory facilities used for
analysis of the water samples of this project through their grant no. (Credit No. 4765-IN) given
to CDA under the Integrated Coastal Zone Management Project (ICZMP) of Odisha. We are
also thankful to the research staffs of CDA for their generous help during field and laboratory
analysis.
References
Amir, M., Paul, D., Samal, R.N., 2019. Sources of organic matter in Chilika lagoon, India
inferred from stable C and N isotopic compositions of particulates and sediments.
Journal of Marine Systems 194, 81–90. https://doi.org/10.1016/j.jmarsys.2019.03.001
Avelar, M., Bonilla-Heredia, B., Merino-Ibarra, M., Herrera-Silveira, J.A., Ramirez, J.,
Rosas, H., Valdespino, J., Carricart-Ganivet, J.P., Martínez, A., 2013. Iron, cadmium,
and chromium in seagrass (Thalassia testudinum) from a coastal nature reserve in karstic
Yucatán. Environmental Monitoring and Assessment 185, 7591–7603.
https://doi.org/10.1007/s10661-013-3121-7
Banerjee, S., Pramanik, A., Sengupta, S., Chattopadhyay, D., Bhattacharyya, M., 2017.
Distribution and source identification of heavy metal concentration in Chilika Lake,
Odisha India: An assessment over salinity gradient. Current Science 112, 87–94.
https://doi.org/10.18520/cs/v112/i01/87-94
Barik, S.K., Bramha, S., Bastia, T.K., Behera, D., Mohanty, P.K., Rath, P., 2019. Distribution
of geochemical fractions of phosphorus and its ecological risk in sediment cores of a
largest brackish water lake, South Asia. International Journal of Sediment Research 34,
251–261. https://doi.org/10.1016/j.ijsrc.2018.11.004
Barik, S.K., Muduli, P.R., Mohanty, B., Rath, P., Samanta, S., 2018. Spatial distribution and
potential biological risk of some metals in relation to granulometric content in core
sediments from Chilika Lake, India. Environmental Science and Pollution Research 25,
572–587. https://doi.org/10.1007/s11356-017-0421-4
Barik, S.S., Prusty, P., Singh, R.K., Tripathy, S., Farooq, S.H., Sharma, K., 2020. Seasonal
and spatial variations in elemental distributions in surface sediments of Chilika Lake in
response to change in salinity and grain size distribution. Environmental Earth Sciences
79, 1–18. https://doi.org/10.1007/s12665-020-09009-z
Bonanno, G., Borg, J.A., di Martino, V., 2017. Levels of heavy metals in wetland and marine
vascular plants and their biomonitoring potential: A comparative assessment. Science of
the Total Environment 576, 796–806. https://doi.org/10.1016/j.scitotenv.2016.10.171
Cascella, M., Rajnik, M., Cuomo, A., Dulebohn, S. C., Di Napoli, R., 2020. Features,
Evaluation and Treatment Coronavirus (COVID-19). In Stat Pearls [internet]. Treasure
Island, FL: Stat Pearls Publishing.
CDA (Chilika Development Authority), 2021. Press release on monitoring of Chilika lake on
15th January, 2021. https://www.chilika.com/documents/newsevents_1610975333.pdf
Ganguly, D., Patra, S., Muduli, P.R., Vishnu Vardhan, K., R, A.K., Robin, R.S.,
Subramanian, B.R., n.d. Influence of nutrient input on the trophic state of a tropical
brackish water lagoon.
21Preprints (www.preprints.org) | NOT PEER-REVIEWED | Posted: 14 June 2021 doi:10.20944/preprints202106.0378.v1
Garg, V., Aggarwal, S.P., Chauhan, P., 2020. Changes in turbidity along Ganga River using
Sentinel-2 satellite data during lockdown associated with COVID-19. Geomatics,
Natural Hazards and Risk 11, 1175–1195.
https://doi.org/10.1080/19475705.2020.1782482
Gopal, V., Shanmugasundaram, A., Nithya, B., Magesh, N.S., Jayaprakash, M., 2018. Water
quality of the Uppanar estuary, Southern India: Implications on the level of dissolved
nutrients and trace elements. Marine Pollution Bulletin 130, 279–286.
https://doi.org/10.1016/j.marpolbul.2018.03.046
Häder, D.P., Banaszak, A.T., Villafañe, V.E., Narvarte, M.A., González, R.A., Helbling,
E.W., 2020. Anthropogenic pollution of aquatic ecosystems: Emerging problems with
global implications. Science of the Total Environment.
https://doi.org/10.1016/j.scitotenv.2020.136586
Hussain, J., Dubey, A., Hussain, I., Arif, Mohd., Shankar, A., 2020. Surface water quality
assessment with reference to trace metals in River Mahanadi and its tributaries, India.
Applied Water Science 10, 1–12. https://doi.org/10.1007/s13201-020-01277-1
Lakshman, N., Priyadarsini, P.M., Das, S.S., 2015. Bioaccumulation of Trace Metals in Two
Species of Crabs from Chilika Lagoon, East Coast of India. Journal of Atmosphere 1, 1–
7. https://doi.org/10.18488/journal.94/2015.1.1/94.1.1.7
Lewis, M.A., Richard, D., 2009. Non-nutrient anthropogenic chemicals in seagrass
ecosystems: Fate and effects. Environmental Toxicology and Chemistry 28, 644–661.
https://doi.org/10.1897/08-201.1
Lokhandwala, S., Gautam, P., 2020. Indirect impact of COVID-19 on environment: A brief
study in Indian context. Environmental Research 188.
https://doi.org/10.1016/j.envres.2020.109807
Lotliker, A.A., Baliarsingh, S.K., Shesu, R.V., Samanta, A., Naik, R.C., Balakrishnan Nair,
T.M., 2021. Did the Coronavirus Disease 2019 Lockdown Phase Influence Coastal
Water Quality Parameters off Major Indian Cities and River Basins? Frontiers in Marine
Science 8, 1–11. https://doi.org/10.3389/fmars.2021.648166
Madhusmita, T., 2012. Biodiversity of Chilika and Its Conservation, Odisha, India. Int. Res.
J. Environment Sci. International Science Congress Association 1, 54–57.
Millero, F., Woosley, R., DiTrolio, B., Waters, J., 2009. Effect of Ocean Acidification on the
Speciation of Metals in Seawater. Oceanography.
https://doi.org/10.5670/oceanog.2009.98
Mishra, A.K., Santos, R., Hall -Spencer, J.M., 2019. Elevated trace elements in sediments
and seagrasses at CO2 seeps. Marine Environmental Research 104810.
https://doi.org/10.1016/j.marenvres.2019.104810
Mishra, D.R., Kumar, A., Muduli, P.R., Equeenuddin, S.M., Rastogi, G., Acharyya, T.,
Swain, D., 2020. Decline in phytoplankton biomass along Indian coastalwaters due to
COVID-19 lockdown. Remote Sensing 12. https://doi.org/10.3390/RS12162584
Mishra, P., Panda, U.S., Pradhan, U., Kumar, C.S., Naik, S., Begum, M., Ishwarya, J., 2015.
Coastal water quality monitoring and modelling off Chennai city, in: Procedia
Engineering. Elsevier Ltd, pp. 955–962. https://doi.org/10.1016/j.proeng.2015.08.386
22Preprints (www.preprints.org) | NOT PEER-REVIEWED | Posted: 14 June 2021 doi:10.20944/preprints202106.0378.v1
Mishra, S.P., Dwibedy, S., 2015. Geohydrology of South Mahanadi Delta and Chilika Lake,
Odisha. International Journal of Advanced Research 3, 430–444.
Mohanty, B., Muduli, P.R., Behera, A.T., Mahapatro, D., Barik, S.K., Nag, S.K., Samal,
R.N., Pattnaik, A.K., 2016. Assessment of petroleum hydrocarbon in a tropical brackish
water lagoon: Chilika, India. Chemistry and Ecology 32, 653–668.
https://doi.org/10.1080/02757540.2016.1177521
Mohanty, D., Samanta, L., 2016. Multivariate analysis of potential biomarkers of oxidative
stress in Notopterus notopterus tissues from Mahanadi River as a function of
concentration of heavy metals. Chemosphere 155, 28–38.
https://doi.org/10.1016/j.chemosphere.2016.04.035
Morsy, K.M., Mishra, A.K., 2020. Water Quality Assessment of the Nile Delta Lagoons.
https://doi.org/10.1177/1178622120963072
Muhammad, S., Long, X., Salman, M., 2020. COVID-19 pandemic and environmental
pollution: A blessing in disguise? Science of the Total Environment 728, 138820.
https://doi.org/10.1016/j.scitotenv.2020.138820
Nayak, B.K., Acharya, B.C., Panda, U.C., Nayak, B.B., Acharya, S.K., 2004. Variation of
water quality in Chilika lake, Orissa. Indian Journal of Marine Sciences 33, 164–169.
Nazneen, S., Raju, N.J., Madhav, S., Ahamad, A., 2019a. Spatial and temporal dynamics of
dissolved nutrients and factors affecting water quality of Chilika lagoon. Arabian
Journal of Geosciences 12. https://doi.org/10.1007/s12517-019-4417-x
Nazneen, S., Singh, S., Raju, N.J., 2019b. Heavy metal fractionation in core sediments and
potential biological risk assessment from Chilika lagoon, Odisha state, India. Quaternary
International 507, 370–388. https://doi.org/10.1016/j.quaint.2018.05.011
Panda, B.P., Panda, B., Parida, S.P., Mahapatra, B., Dash, A.K., Pradhan, A., 2019. Heavy
metal accumulation in some fishes preferred for consumption by egrets in Odisha, India.
Nature Environment and Pollution Technology 18, 975–979.
Panda, U.C., Rath, P., Bramha, S., Sahu, K.C., 2010. Application of Factor Analysis in
Geochemical Speciation of Heavy Metals in the Sediments of a Lake System—Chilika
(India): A Case Study. Journal of Coastal Research 265, 860–868.
https://doi.org/10.2112/08-1077.1
Panda, U.S., Mahanty, M.M., Ranga Rao, V., Patra, S., Mishra, P., 2015. Hydrodynamics and
water quality in Chilika Lagoon-A modelling approach, in: Procedia Engineering.
Elsevier Ltd, pp. 639–646. https://doi.org/10.1016/j.proeng.2015.08.337
Parida, S., Barik, S.K., Mohanty, B., Muduli, P.R., Mohanty, S.K., Samanta, S., Pattanaik,
A.K., 2017. Trace metal concentrations in euryhaline fish species from Chilika lagoon:
human health risk assessment. International Journal of Environmental Science and
Technology 14, 2649–2660. https://doi.org/10.1007/s13762-017-1334-y
Patel, P.P., Mondal, S., Ghosh, K.G., 2020. Some respite for India’s dirtiest river? Examining
the Yamuna’s water quality at Delhi during the COVID-19 lockdown period. Science of
the Total Environment 744, 140851. https://doi.org/10.1016/j.scitotenv.2020.140851
Richir, J., Gobert, S., 2014. A reassessment of the use of Posidonia oceanica and Mytilus
galloprovincialis to biomonitor the coastal pollution of trace elements: New tools and
23Preprints (www.preprints.org) | NOT PEER-REVIEWED | Posted: 14 June 2021 doi:10.20944/preprints202106.0378.v1
tips. Marine Pollution Bulletin 89, 390–406.
https://doi.org/10.1016/j.marpolbul.2014.08.030
Sahoo, R.K., Mohanty, P.K., Pradhan, S., Pradhan, U.K., Samal, R.N., 2018. Bed sediment
characteristics and transport processes along the inlet channel of Chilika Lagoon (India).
Indian Journal of Geo-Marine Sciences 47, 301–307.
Sahu, B.K., Pati, P., Panigrahy, R.C., 2014. Environmental conditions of Chilika Lake during
pre and post hydrological intervention: An overview. Journal of Coastal Conservation
18, 285–297. https://doi.org/10.1007/s11852-014-0318-z
Sanz-Lázaro, C., Malea, P., Apostolaki, E.T., Kalantzi, I., Marín, a., Karakassis, I., 2012. The
role of the seagrass Posidonia oceanica in the cycling of trace elements. Biogeosciences
9, 2497–2507. https://doi.org/10.5194/bg-9-2497-2012
Shukla, T., Sen, I.S., Boral, S., Sharma, S., 2021. A time-series record during COVID-19
lockdown shows the high resilience of dissolved heavy metals in the Ganga river.
Environmental Science and Technology Letters.
https://doi.org/10.1021/acs.estlett.0c00982
Stockdale, A., Tipping, E., Lofts, S., Mortimer, R.J.G., 2016. Effect of Ocean Acidification
on Organic and Inorganic Speciation of Trace Metals. Environmental Science and
Technology 50, 1906–1913. https://doi.org/10.1021/acs.est.5b05624
Sundaray, S.K., Nayak, B.B., Kanungo, T.K., Bhatta, D., 2012. Dynamics and quantification
of dissolved heavy metals in the Mahanadi River estuarine system, India. Environmental
Monitoring and Assessment 184, 1157–1179. https://doi.org/10.1007/s10661-011-2030-
x
Tripathy, G.R., Singh, S.K., Ramaswamy, V., 2014. Major and trace element geochemistry of
Bay of Bengal sediments: Implications to provenances and their controlling factors.
Palaeogeography, Palaeoclimatology, Palaeoecology 397, 20–30.
https://doi.org/10.1016/j.palaeo.2013.04.012
Vijay Prakash, K., Geetha Vimala, Ch.S., Preethi Latha, T., Jayaram, C., Nagamani, P. v.,
Laxmi, Ch.N. v., 2021. Assessment of Water Quality Along the Southeast Coast of India
During COVID-19 Lockdown. Frontiers in Marine Science 8, 1–13.
https://doi.org/10.3389/fmars.2021.659686
WHO, 2021. World Health Organization, Weekly Update on COVID-19.
https://www.who.int/publications/m/item/weekly-epidemiological-update-on-covid-19--
-11-may-2021
24You can also read