Electric Scooters' Trip Data Collection and Analysis - RISE
←
→
Page content transcription
If your browser does not render page correctly, please read the page content below
33rd Electric Vehicle Symposium (EVS33)
Portland, Oregon, June 14 - 17, 2020
Electric Scooters’ Trip Data Collection and Analysis
Henrik Engdahl3, Cristofer Englund1, Anne Faxér1, Shiva Habibi1, Stefan Pettersson1,2,
Frances Sprei2, Alexey Voronov1, Johan Wedlin4
1
RISE Research Institutes of Sweden, Lindholmspiren 3A, SE-417 56 Gothenburg, Sweden, stefan.pettersson@ri.se
2
Chalmers University of Technology, SE-412 96 Gothenburg, Sweden
3
Nimling AB, Askims stationsväg 4, SE-436 40 Askim, Sweden
4
Tångudden Konsult AB, Fiskebåtsgatan 10, SE-426 71 Västra Frölunda
Summary
Electric scooters or e-scooters are a transport mode that has increased rapidly but with mixed reactions. In
this paper, we present aggregated usage data and some basic analysis from four European cities: Berlin
Madrid, Paris and Stockholm. We have analyzed the utilization rate, trip duration and straight-line distance,
and where and when they are used in the observed cities. The maximum utilization rate is between 2 and 4%
with a declining trend towards winter. Not surprisingly, the scooters are used for short trips mainly in the
afternoon and evenings, and mostly on Fridays and Saturdays. However, we do observe variations between
the cities. Stockholm, e.g., has a morning peak absent in the other three cities.
Keywords: micro-mobility, electric scooter, data acquisition, shared, mobility system
1 Background
Electric scooters or e-scooters are a new transport mode that has increased rapidly in several cities around
the world. This rapid spread has led to mixed reactions.
The positive perspective is their potential to contribute to a more sustainable transport system by serving as
a complement to public transport, walking and cycling and thus being an attractive alternative to privately
owned cars.
The negative aspects are that they on the contrary might compete with public transport, walking and cycling
and may also contribute to increased congestion and traffic accidents as well as their, at least so far, short life
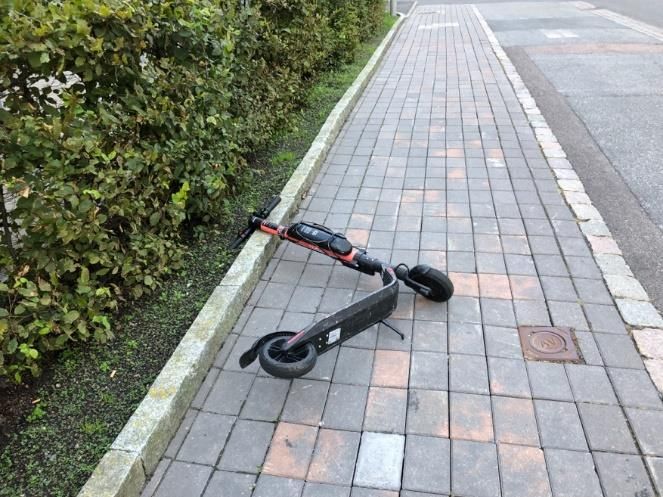
expectancy which has a negative climate impact. Figure 1 shows one problem with electric scooters namely
that they sometimes are dropped or end up at unsuitable places. Although some cities and operators have
started designating specific spots for scooter parking, most still allow the scooters to be left at any place.
To understand the role electric scooters play in the transport system we need to understand how they are used.
A study from Portland, USA [1] states that a third of the trips made with e-scooters replaced car travels.
Similar results are found in a survey from New Zealand [2], where 28% of the e-scooter trips replaced car
travels. A study of the usage patterns in Indianapolis, USA [3], shows that the e-scooter trips in average took
EVS33 International Electric Vehicle Symposium 1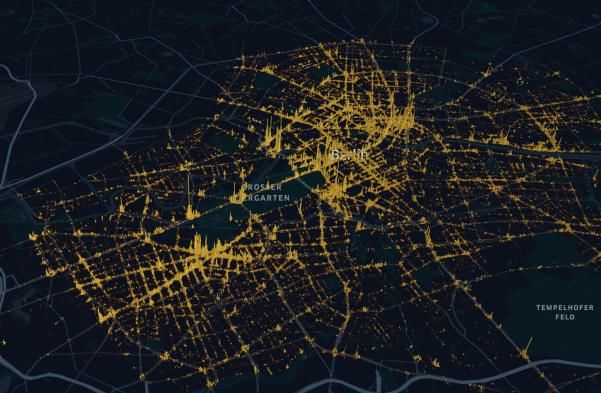
8 minutes and covered 1.13 km. But to our knowledge, there are no studies of e-scooters usage in European
cities that have a different urban structure and public transport network. This is a first descriptive approach
to bring some clarity on utilization, trip duration and length and when and where the scooters are used.

                       Figure 1: A scooter left on the sidewalk. Photo taken by Johan Wedlin.

2    Method
In earlier studies, the authors have analyzed usage patterns of free-floating car sharing services (FFCS) [4,
5], using data collected from millions of trips. A similar approach is taken here.
To enable free-floating rental of electric scooters, users must be made aware of the position of available
vehicles. The positions and status information of available scooters are collected and shown to the user
through the operators’ mobile apps. Sampling this publicly available information, using a sampling time of
1 minute, provides the data used for the analysis of e-scooters in this paper. So far, we have collected data
for roughly four months, from August 2019 to February 2020. Unfortunately, there is a lack of data during
some time intervals (see Figure 2). We have sampled one or two operators in four cities. More specifically,
two operators in Stockholm with 251768 respectively 781871 trips; one operator in Berlin with 322070 trips,
one operator in Madrid with 31481 trips and two operators in Paris with 42044 respectively 10039 trips,
adding up to a total of 1.44 million trips analyzed in this paper.

The data shows the parking positions and status of the scooters but says nothing about the users, which means
that the data collection does not handle any personal data. Examples of data that are collected are location
information, time stamp and state-of-charge (SOC) of the battery at the beginning and end of a trip. It should
be noted that we do not have access to data of the actual distance of each trip but only the origin and destination
of each trip and therefore, the geo (straight line) distance between them.

To prepare the data for analysis, we needed to clean the data from outliers. We identify charging trips as those
in which the state of charge is higher at the end of the trip than at the beginning. These trips are removed
from the study. Trips with a distance longer than 50 km or with a duration longer than 60 minutes were
removed in most of the analysis except in the left figures in Figure 3 in which data longer than 60 minutes
also are included for visualization purposes.
On the cleaned data, we performed a statistical analysis to identify the utilization rate, trip duration and length
and when and where the e-scooters are used. The results are presented in the following section.
EVS33 International Electric Vehicle Symposium                                                               2
3 Results
3.1 Utilization rate
The utilization rate is defined as the total time all e-scooters in the fleet are used each day divided by total
time they could potentially be used, i.e., 24 hours * 60 minutes. To estimate the number of scooters in the
fleet, we use a window of 6 days to cancel out the noise caused by non-used scooters. It should be noted that
we only observe e-scooters that are rented. Daily utilization rates of e-scooters are shown in Figure 2.
Figure 2: Variation of daily fleet utilization rate for Stockholm (upper left), Berlin (upper right), Madrid (lower left)
and Paris (lower right). The dashed red line is monthly averages. Note that the Madrid data are only collected until
October; data for the other cities are until February.
The maximum observed utilization rate is in Berlin, almost 4%, and in Madrid the maximum is almost 1.8%.
In Stockholm and Berlin, the utilization rate has a declining trend from summer to fall 2019, while in Paris
and Madrid it is less varying. However, for Madrid we only have data until October. From our data, we can
see that the number of e-scooters is reduced by the operators during autumn/winter, especially in Stockholm
and Berlin, so the decrease of utilization rate most likely depends on less usage during autumn/winter.
The figures in general show that the e-scooters are parked, and thus not used, most of the time. However,
there is a trade-off between utilization rate of these services and their availability. Service availability is
linked to the reliability of services and influences long-term demand.
EVS33 International Electric Vehicle Symposium 33.2 Statistical data on trip duration and lengths of the trips
In Figure 2, the histogram of the trip duration is given where the left figure indicates all trips and the right
figure zooms in on trips shorter than 1 hour which are the majority of the trips and the most reasonable rental
time. Longer trips are most probably charging, maintenance, and redistribution trips.
S
t
o
c
k
h
o
l
m
B
e
r
l
i
n
M
a
d
r
i
d
P
a
r
i
s
Figure 3: Trip duration: Left: all trips; Right: only trips shorter than 1 hour. Note that the number of trips differ
between cities.
EVS33 International Electric Vehicle Symposium 4The mean and median value of the trip duration for the right hand figures in Figure 2 are around 10 minutes
and 8 minutes respectively for Stockholm, 12 minutes respectively 9 minutes for Berlin, 16 minutes
respectively 12 minutes for Madrid, and finally 19 minutes respectively 16 minutes for Paris. Concludingly,
for all cities, the mean value is higher than the median value. The distribution of trip length is slightly different
for Paris where the peak is around 10 minutes, while being approximately 5 minutes in the rest of the cities.
Figure 4 shows the histogram of the length of the trips in kilometers. Note that this is the straight-line distance
and not the actual trips distance, which we cannot observe from the collected data.
Stockholm Berlin
Madrid Paris
Figure 4: Trip straight-line distance. Note that the number of trips differ between cities.
As can be seen in the histograms, there is a peak at zero distance, which is the highest for Paris, followed by
Berlin and Madrid, and Stockholm has the smallest one. The peak at zero distance means that there are many
trips that start and ends in almost the same location. These trips are for sure not part of a potential transport
chain where the electric scooter trip is just one part of the total trip. They can either be trips that are not
followed through or round trips where the scooter is used and then returned to the same place.
The mean and median trip distance for Stockholm are 2.55 km and 1.75 km respectively. For Berlin they are
about the same: 2.60 km and 1.64 km respectively, while they are shorter in Paris with 2.64 km and 1.99 km
respectively. Madrid has the shortest distance with 2.11 km and 1.37 km respectively. Concludingly, for all
cities, the mean value is higher than the median value. Similar to the trip duration histograms, Paris has a
distribution that is more spread out toward longer trip distances.
EVS33 International Electric Vehicle Symposium 5Figure 5 shows two-dimensional histograms of trip duration versus trip straight-line distance for the four
cities. These plots indicate how fast the trips are in a city and the colors show the frequency of the trips;
darker color means more trips.
Stockholm
Berlin
Madrid
Paris
Figure 5: Two-dimensional histogram showing trip duration versus trip straight-line distance.
Left: all trips, Right: trips shorter than 1 hour.
EVS33 International Electric Vehicle Symposium 6Since the figures give trips with distances versus time, all lines going from the origin have an inclination
equal to a velocity; all trips lying above the line have a higher speed and all trips under the line have a lower
speed. Drawing speed lines through the darkest areas means that we can estimate the speed for the most
frequent trips. For Stockholm the peak trips have a speed of around 1 km/5 minutes which equals to 12 km/h.
For Berlin, the peak trips are around 0.8 km in 6 minutes which equals around 10 km/h, i.e. slightly less than
Stockholm. For Madrid and Paris, there are less data, so it is harder to calculate but the speed seems to be
around 0.75 km / 7.5 min which equals 6 km/h, i.e., slower compared to Berlin and around half the speed
compared to Stockholm.
3.3 When and where are the scooters used?
To understand where the e-scooters are used, we have analysed the accumulated positions of parked e-
scooters during the sampled time, see Figure 6.
Stockholm Berlin
Madrid Paris
Figure 6: Location of the electric scooters parking positions over the sampled time in Stockholm, Berlin, Madrid,
Paris. Visualized using Kepler.gl. Map data: Mapbox and OpenStreetMap.
As can be seen, most of the scooters are found along the main streets in city centers. This is natural, since the
operators restrict the pick-up and return of scooters to specific areas, typically in the city centers. However,
Berlin and Paris seem to have more spread towards suburban areas than Madrid and Stockholm. One possible
explanation could be that these cities have more suburbs within the allowed parking area, while for instance
Stockholm’s suburbs are outside the allowed parking area. Of course, the scooters could be used outside the
allowed parking areas, but since most of the trips are only about 10-15 min and 1-2 km according to above,
EVS33 International Electric Vehicle Symposium 7most scooters are probably used within these areas. Since the operators seem to continually evaluate and
adapt the parking areas according to the users’ and the cities’ needs, there are indications that the scooters in
Paris and Berlin might be used slightly differently than in Stockholm and Madrid. In this analysis, we have
investigated origins and destinations of the trips but found no patterns; it seems the scooters are used for all
types of (short) trips.
The diagrams in Figure 7: Number of trips every hour per day in week for Stockholm (upper left), Berlin (upper right),
Madrid (lower left) and Paris (lower right). Note that the number of trips differ between cities. shows the distribution
of trips over 24 hours and day of week of the sampled weeks. There are some interesting differences: while
all four cities show a clear peak in the evenings, only Stockholm has a morning peak as well. Also, Stockholm
has a more pronounced afternoon peak. Comparing with our earlier analyses of free-floating car sharing
(FFCS) [5], we can assume that the e-scooters could be used for the morning commute in Stockholm, while
mainly used for errands and evening activities (the most prominent peak in all cities is after 18-19 hours) in
all cities. The high evening peak remains to be explained; one possibility is that users take e-scooters after
restaurant and pub visits.
Figure 7: Number of trips every hour per day in week for Stockholm (upper left), Berlin (upper right), Madrid (lower
left) and Paris (lower right). Note that the number of trips differ between cities.
EVS33 International Electric Vehicle Symposium 8Comparing the usage per weekday, see Figure 8, Stockholm and Madrid have the highest usage on Fridays
while in Berlin and Paris the e-scooters are used most on Saturdays. However, the usage patterns in
Stockholm and Berlin are more even. This indicates that although the e-scooters may be used during the
morning commute in Stockholm, the main usage seems to be during the weekends and evenings.
Figure 8: Number of trips per weekday for Stockholm (upper left), Berlin (upper right), Madrid (lower left) and
Paris (lower right). Note that the number of trips differ between cities.
4 Summary and discussion
We have analyzed data on the usage of e-scooters in four different European cities. We find that the maximum
utilization rate is the largest in Berlin with 4% and while it in Madrid is 1.8%. We also find a declining trend
toward winter, especially in Stockholm and Berlin. As expected, the average e-scooter trip is fairly short,
around 10-15 minutes. Of the observed cities Paris has the longest trips. The scooters are mainly used in the
afternoon with a prominent evening peak in all cities. Stockholm also has a morning peak, implying that the
e-scooters might be used as part of the commute there. In all cities Fridays and Saturdays show the highest
number of rentals.
Our analysis only builds on data on the start and end point of the e-scooter rental. We thus don’t have any
information about the actual route taken, the users, their underlying motive and what type of modes would
have been used otherwise. We also cannot explain the observed differences between the cities. More data and
in-depth analysis are needed to answer those type of questions. Still this study provides a first step of
understanding when, where and how much these services are being used. This can be valuable information
for further studies of users, but also for operators, city planners and officials.
EVS33 International Electric Vehicle Symposium 9References
[1] Portland Bureau of Transportation, 2018. E-scooter Findings Report. Accessible at:
https://www.portlandoregon.gov/transportation/article/709719 (accessed date: 2019-08-22).
[2] Fitt, H., & Curl, A. (2019). E-scooter use in New Zealand: Insights around some frequently asked questions.
Available from: https://ir.canterbury.ac.nz/handle/10092/16336
[3] Liu, M., Seeder, S., & Li, H. (2019). Analysis of E-Scooter Trips and Their Temporal Usage Patterns. Institute
of Transportation Engineers. ITE Journal, 89(6), 44-49.
[4] Englund, C., Engdahl, H., Habibi, S., Pettersson, S., Sprei, F., Voronov, A., & Wedlin, J. (2018). Method for
prediction of Utilization Rate of Electric Vehicle Free-Floating Car Sharing Services using Data Mining. In
31st International Electric Vehicles Symposium & Exhibition (EVS 31) & International Electric Vehicle
Technology Conference 2018 (EVTeC 2018), 2018.
[5] Habibi, S., Englund, C., Voronov, A., Engdahl, H., Sprei, F., Pettersson, S., Wedlin, J. Comparison of free-
floating car sharing services in cities. ECEEE Summer Study 2017.
https://www.eceee.org/library/conference_proceedings/eceee_Summer_Studies/2017/4-mobility-transport-
and-smart-and-sustainable-cities/comparison-of-free-floating-car-sharing-services-in-cities/
EVS33 International Electric Vehicle Symposium 10Authors
Henrik Engdahl received a M.Sc. in Electrical and Electronics Engineering from Linköping University
in 2006. After that, Henrik has been a system engineering for Volvo Group, worked as researcher at
RISE Viktoria, a project management at Kasi Technologies AB and product manager for the eHighway
system with cross functional experience of electric powertrains and the energy supply infrastructure at
Siemens. Currently, he is again working at the Volvo Group with electromobility charging solutions.
Henrik also runs a private company Nimling AB, which delivers data to this project.
Cristofer Englund received a M.Sc. in Computer Science from Halmstad University in 2003 and a Ph.D.
in Electrical Engineering from Chalmers University in 2007 and became Associate Professor in Data
mining at Halmstad University in 2018. During 2008-2010 Cristofer worked with 3D image analysis
within the paper machine clothing industry and since 2010 he is the Research Manager at RISE. Since
2015 Cristofer also holds an adjunct senior lecturer position at Halmstad University within Intelligent
Transport Systems. His research interests include, vehicle automation and coordination, behavior
modeling and machine learning.
1
Anne Yu Faxér has a M.Sc. in Industrial Ecology and Bio-environmental System Engineering. She is
working as a researcher at RISE since 2013. Anne has experiences working with research projects about
light electric vehicles, shared mobility and Mobility as a Service, the emerging micro-mobility.
Shiva Habibi is a senior researcher at RISE. Her research fields of interest are econometrics, transport
modeling and understanding behavior and valuations of decision makers. She received her Ph.D. in 2016
from Royal Institute of Technology (KTH). Her research interests lie in transport demand modeling,
transport planning, transport policies and innovative mobility solutions. Her recent interest is innovative
mobility solutions.
Stefan Pettersson has a M.Sc. in Automation Engineering and a Ph.D. in Control Engineering and
2 became an Associate Professor in Control Engineering at Chalmers University in 2004. During 2006-
2009 Stefan worked in the automotive industry at Volvo Technology. Currently, he is the Director of
Electromobility at RISE, where he is the boss of many researchers and a responsibility of a large portfolio
of electromobility projects. In 2017, Stefan became an adjunct Professor at Chalmers University of
Technology.
3
Frances Sprei is an Associate Professor in Sustainable Mobility at the Department of Space, Earth and
Environment, Chalmers University of Technology, Sweden. Her research assesses different innovative
personal mobility choices. She received her Ph.D. in 2010 and has been a visiting scholar/post-doc at
Stanford University.
4
Alexey Voronov received his Ph.D. and M.Sc. degrees from Chalmers University of Technology in 2013
and 2007 respectively. His research interests include applied computer science, complex systems, and
intelligent transportation solutions. Alex has been a researcher at RISE until 2020 but is currently
working with AI at Astra Zeneca.
Johan Wedlin has a M.Sc. in Mechanical Engineering from Chalmers University of Technology. He has
5 over 30 years of experience from the automotive industry, where he mainly focused on concept
development, advanced engineering and research. Johan then worked close to a decade at the Swedish
research institute RISE Viktoria as Senior Project Manager, with projects within electromobility, vehicle
automation, mobility sharing and open innovation processes. After retiring, Johan Wedlin splits his time
between nonprofit activities and consultancy work at Tångudden Konsult AB.
•
EVS33 International Electric Vehicle Symposium 11You can also read