Emerging imaging methods to study whole-brain function in rodent models
←
→
Page content transcription
If your browser does not render page correctly, please read the page content below
Translational Psychiatry                                                                                                                           www.nature.com/tp

REVIEW ARTICLE                          OPEN

Emerging imaging methods to study whole-brain function in
rodent models
                                                                                                      1,2 ✉
Marija Markicevic1,2, Iurii Savvateev1,2,3, Christina Grimm1,2 and Valerio Zerbi

© The Author(s) 2021

   In the past decade, the idea that single populations of neurons support cognition and behavior has gradually given way to the
   realization that connectivity matters and that complex behavior results from interactions between remote yet anatomically
   connected areas that form specialized networks. In parallel, innovation in brain imaging techniques has led to the availability of a
   broad set of imaging tools to characterize the functional organization of complex networks. However, each of these tools poses
   significant technical challenges and faces limitations, which require careful consideration of their underlying anatomical,
   physiological, and physical specificity. In this review, we focus on emerging methods for measuring spontaneous or evoked activity
   in the brain. We discuss methods that can measure large-scale brain activity (directly or indirectly) with a relatively high temporal
   resolution, from milliseconds to seconds. We further focus on methods designed for studying the mammalian brain in preclinical
   models, specifically in mice and rats. This field has seen a great deal of innovation in recent years, facilitated by concomitant
   innovation in gene-editing techniques and the possibility of more invasive recordings. This review aims to give an overview of
   currently available preclinical imaging methods and an outlook on future developments. This information is suitable for educational
   purposes and for assisting scientists in choosing the appropriate method for their own research question.

   Translational Psychiatry (2021)11:457 ; https://doi.org/10.1038/s41398-021-01575-5

INTRODUCTION                                                                            for life. According to this view, correlates between the activity of a
Galaxies of thought, cognition, and movement                                            single neuron and a specific cognitive process provide a limited
The observation of natural phenomena is the basis of modern                             description of the causal relationship between brain activity and
scientific thought, and a common approach to all scientific                               behavior [3]. Thus, it seems increasingly likely that the brain does
disciplines, from astronomy to neuroscience. Through observa-                           not use actual spike coding but population—or neural ensembles
tions, we can generate, confirm, extend or challenge theories and                        —coding that unfolds on a limited, low-dimensional portion of the
models of how nature works. And just as telescopes are the means                        full neural space [4, 5]. As information flows through the brain,
of unlocking the secrets of outer space, our understanding of the                       population activity is further integrated into large-scale networks
brain depends on the methods we use to observe its constituent                          via the connectome [6]. The result is that large numbers of brain
elements and study how they interact with each other, creating                          regions are active during every aspect of cognition and behavior.
galaxies of thought, cognition and movement. While there is no                             Since one of the more tractable goals of quantitative
single technique (yet) capable of observing all these phenomena,                        neuroscience is to develop predictive models that relate brain
there are many technologies at our disposal to study brain activity                     activity to behavior, observing activity, and dynamics in neural
across multiple temporal and spatial dimensions (Fig. 1).                               networks—possibly in multiple brain areas—can get us closer to
   The basic substrate used by the brain to transmit information is                     this goal. To do that, scientists and engineers have developed an
represented by electrical events called neuronal spikes and the                         array of methods capable of looking at whole-brain activity from a
release of chemical neurotransmitters in the synaptic terminals.                        zoomed-out perspective. In this review, we aim to provide the
Decades of (electro)physiological research facilitated by in vitro                      reader with an overview of the emerging methods for observing
preparations, neuronal cell cultures or organoids, and in vivo                          system and network-level brain function in rodents. Although this
recordings have advanced our understanding of the mechanisms                            article is not designed to provide a full review of the literature,
that drive neurons to fire and transmit their signals through the                        history, and physics behind each method, we distill the nature and
network. Although neuronal rhythmicity has an essential role in                         the unique features of each technique and comment on their use
facilitating information processing across spatial and temporal                         and potential for future expansion and of course, their limitations.
hierarchies in the brain [1], individual neural spikes per se are too                   We wrote this article for scientists who want to expand their view
weak to influence complex behavior (with notable exceptions) [2].                        on preclinical imaging methods, are looking for the appropriate
If our cognition really depended on individual spikes, we would                         method to address their research question, and for didactical
deal with a poorly defined, high-dimensional system, not suitable                        purposes.

1
 Neural Control of Movement Lab, HEST, ETH Zürich, Zürich, Switzerland. 2Neuroscience Center Zurich, University and ETH Zürich, Zürich, Switzerland. 3Decision Neuroscience
Lab, HEST, ETH Zürich, Zürich, Switzerland. ✉email: valerio.zerbi@hest.ethz.ch

Received: 16 February 2021 Revised: 5 August 2021 Accepted: 23 August 2021
M. Markicevic et al.
2
that few technical caveats of the T2* contrast remain [22]. In fact,
GRE sequences are more frequently troubled by susceptibility and
chemical shift artifacts given their high sensitivity to large vessels,
potentially leading to overestimations of activated regions [22, 23].
However, there are other types of MRI sequences that can work
around these problems. The most common are T2-weighted
techniques such as EPI spin-echo sequences, which filter signals
associated with larger veins and enhance contrast from small
capillaries that are more likely to be closer to the site of neuronal
activity [24]. This advantage comes at the expense of lower BOLD
sensitivity and longer acquisition times [25, 26]. Given that
different techniques of contrast, weighting are likely to involve
different trade-offs between sensitivity and spatial specificity of
the observed fMRI responses, making an informed decision
regarding the choice of MRI pulse sequence to best fit one’s
research question and study design is advisable.
Rodent functional MRI: Although the evidence provided by fMRI
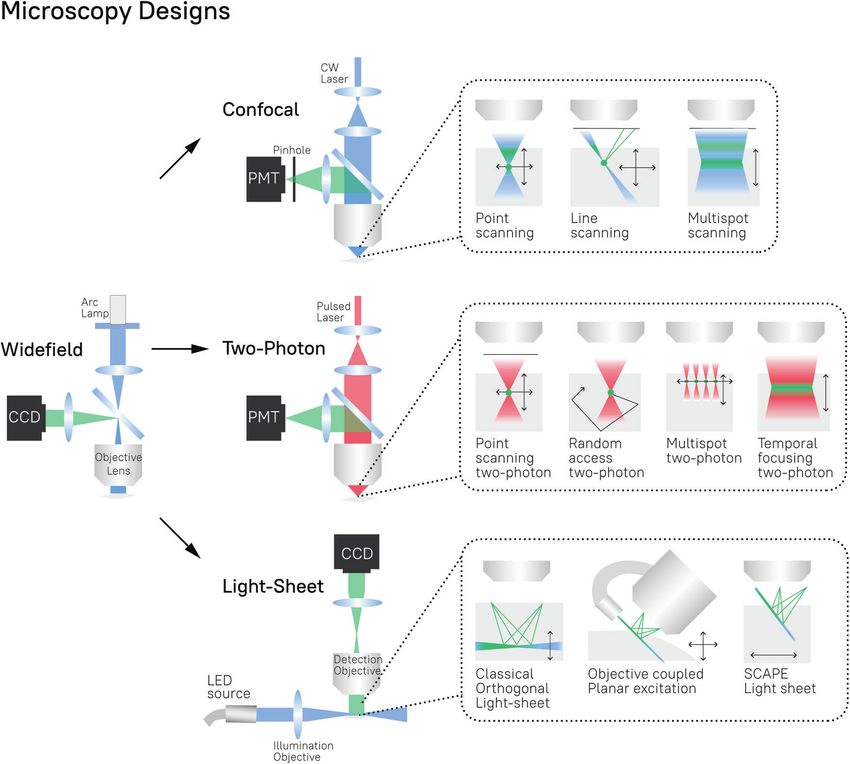
Fig. 1 The spatiotemporal overview of imaging techniques used imaging in humans continues to teach us a lot about
for studying rodent whole-brain function. Each colored box brain–behavior relationships, studying the biological underpin-
represents the approximate spatiotemporal scope of the labeled nings, which underlie large-scale networks and dynamics requires
technique. Light blue colored boxes represent techniques covered interventional and controlled experimental conditions only
in this review, while gray boxes techniques are not covered. EEG achievable in animal models. The past 10 years have seen a rapid
electroencephalography, MEG magnetoencephalography, PET posi-
tron emission tomography, 2-DG 2-deoxyglucose, fUS functional increase in studies applying rsfMRI in rodent models. Early work
ultrasound, fMRI functional magnetic resonance imaging. mapped the spatial extent of resting-state networks in rats [27–30]
1234567890();,:
and mice [31]. These findings have led to the realization that the
rodent brain is organized in large-scale networks, the properties of
Functional MRI. Functional magnetic resonance imaging (fMRI) is which are similar to those reported in humans. This laid the
one of the leading techniques to study whole-brain function in foundation for studying the rodent brain using multiple
humans. Its first description dates back to the early 1990s, when approaches adapted from the human literature, such as indepen-
Ogawa and colleagues [7] described the principles of blood dent component analysis [32–35], seed-based correlation [33, 36–
oxygen level-dependent (BOLD) magnetic resonance imaging 39], dynamic functional connectivity analysis [40–42], and tools
(MRI): local changes in the neuronal activity require a dynamic from graph theory [43, 44]. Other work focused on the relationship
supply of oxygen and glucose, provided by a highly dense between network function and neuronal axonal connectivity, for
vascular system. More specifically, the process of neurovascular example, by comparing rsfMRI data with the underlying anatomi-
coupling, which entails the acute regulation of cerebral blood flow cal connectivity from tracer injection experiments by the Allen
(CBF) via vasoactive molecules and neural messengers, ensures Institute [45]. Thanks to this work, we have learned that high
that this change in energetic demand is met (extensively reviewed functional connectivity emerges predominantly between mono-
in refs. [8–11]). To this day, much research effort is directed to the synaptically connected regions in the cortex, albeit this relation is
identification of cellular and molecular messengers that commu- not always present in subcortical regions like the thalamus [46]. In
nicate neuronal activity to the vasculature, helping us understand another study, Mills et al. [47] showed that, in addition to neuro-
cerebrovascular regulation and more accurately interpret anatomical wiring, the genetic profiles of individual brain regions
observed fMRI signals [12–17]. Ultimately, regional alterations in strongly contribute to functional connectivity, and that the
CBF influence the ratio of oxygenated vs deoxygenated hemo- variance of fMRI signals is best explained by a linear combination
globin, whose distinct magnetic properties give rise to the BOLD of axonal and gene expression data.
signal. It is the paramagnetic properties of the deoxyhemoglobin Rodent fMRI has also been used to better elucidate the
that cause magnetic susceptibility inside blood vessels and mechanism of BOLD, for example, by combining it with direct
surrounding tissue, thus affecting the magnetic field and the measurement of neural and astrocytic activity [48–52]. Schlegel
spin-spin relaxation time (T2/T2*). et al. [48] performed sensory-evoked (hind-paw stimulation)
MRI sequences that are sensitive to the T2*, such as gradient astrocytic and neuron-specific calcium recordings with simulta-
echo (GRE) echo-planar imaging (EPI), are often used for studying neous BOLD fMRI, and showed strong correlations between BOLD
the fast dynamics of hemodynamic responses with a spatial and calcium signals (both neuronal and astrocytic). Similarly, Tong
resolution of ~1–3 mm and with a temporal resolution of ~1–3 s and colleagues [50] revealed a strong coupling between the
[18, 19]. In 1995, Biswal et al. [20] showed that also slow (M. Markicevic et al.
3
allegedly homologous brain networks [44]. In this context, fMRI processes between cortico-cortical and cortico-thalamic regions
represents a valuable tool for addressing the growing need to and to assess the direction of information flow.
formally identify common brain circuits between rodents and Images generated by conventional fMRI sequences in rodents
humans to determine the scope and limits of rodent translational suffer from high sensitivity to magnetic susceptibility artifacts due
models [62, 63]. One caveat is that rodent fMRI is usually carried to the high field of scanners and the relatively long echo time
out in the anesthetized state to minimize head-motion during required to generate the BOLD contrast. To solve this problem,
scanning, and only a handful of labs are acquiring fMRI data in MacKinnon and colleagues combined a zero-time echo (ZTE) pulse
awake animals [15, 64, 65]. The choice of anesthetic introduces sequence with iron oxide nanoparticles to acquire CBV. The ZTE
confounds in fMRI measurements and is certainly a limitation for sequence is characterized by a very short echo time, which means
translating findings to humans [38, 39]. that signal acquisition occurs immediately after the radiofre-
quency pulse, preventing signal decay. At the same time, iron
New avenues: New acquisition sequences to assess brain oxide nanoparticles shorten the T1 relaxation time, resulting in the
function with MRI are emerging at an ever-increasing rate. A detection of CBV-weighted functional activations in the brain even
family of MRI methods assesses brain activity in rodents (other with a low echo time. This allows for a threefold increase in the
than BOLD) by measuring cerebral blood volume (CBV) and CBF, magnitude of the SNR, along with a reduction in susceptibility
usually referred to as perfusion MRI. CBV and/or CBF are often artifacts and acoustic noise [73].
measured by injecting a paramagnetic contrast agent (CA) into New MRI sequences have also been developed to measure
the bloodstream [66]. The CA’s passage causes transient magnetic brain activity differently from the hemodynamic response. One
field inhomogeneities and introduces phase distortion of the example is given by diffusion functional imaging (dfMRI). In dfMRI,
water proton spins resulting in changes in T1, T2, or T2* relaxation a spin-echo echo-planar (SE-EPI) sequence is combined with an
times, which can be captured with different MRI sequences. isotropic diffusion encoding (IDE) gradient, to impart isotropic
Commonly used CAs are paramagnetic gadolinium chelates, diffusion-weighting contrast in the acquired signal. This makes
which increase T1, and superparamagnetic iron oxide nanoparti- dfMRI sensitive to rapid changes in three-dimensional tissue
cles, which decrease T2/T2* (for a thorough review of techniques boundaries induced by neuronal activation [74, 75]. Evidence from
of perfusion MRI and comparison of CA see [66–68]). CBV- intrinsic optical signals (IOS) studies suggests a strong coupling
weighted fMRI in small animals has some advantages over BOLD between neural activity and microscopic (sub)cellular morpholo-
measurements, including higher signal-to-noise ratio (SNR) and gical changes [76]. Therefore, dfMRI was developed to detect
reduced susceptibility artifact. Furthermore, CBV represents a changes in water diffusion properties related to “cell swelling” and
direct and easily interpretable component of the neurovascular coupled to neuronal activity rather than hemodynamic responses
cascade compared with the BOLD signal [66]. CBV-fMRI in [74, 77]. Nunes et al. [78] were the first to investigate in greater
combination with chemogenetic or optogenetic neuromodulation depth the mechanism underlying neuromorphological coupling
has been used to study the influence of serotonergic transmission by developing an ultrafast line-scanning dfMRI SE-EPI sequence
on brain function. Giorgi et al. [69] measured the effects of with a time resolution of 100 ms, which enabled the detection of
pharmacological and chemogenetic serotonin modulation on rapid diffusion dynamics. Upon forepaw stimulation, they
whole-brain CBV. Their results indicate that serotonin modulation detected in the rat somatosensory cortex that the dfMRI signal
changes the CBV in multiple primary target regions of serotonin contains two different components: a fast-onset component that
encompassing corticohippocampal and ventrostriatal areas. A is insensitive to vascular change, followed by a slower component
similar study from Grandjean et al. [70] showed that optogenetic sensitive to vascular change. Independent IOS of optogenetically
activation of the dorsal raphe nucleus resulted in a CBV decrease stimulated brain slices confirmed the close similarity between fast
in primary target regions of serotonin. In addition, inducing acute IOS and the fast-onset dfMRI component, thus suggesting further
stress by forced immobilization prior to the MRI also decreased evidence of neuromorphological coupling. Moreover, in human
the CBV in the same dorsal raphe’s primary target regions. studies, dfMRI showed higher spatial accuracy at activation
Other MRI sequences have been developed to achieve faster mapping compared with classic functional MRI approaches [79]
recordings, artifact-free images, or increase the specificity of MRI [80]. Nunes and colleagues [81] applied dfMRI in rodent fMRI, and
responses in relation to the underlying neural signals. Compared tested the specificity of dfMRI by mapping whole-brain responses
with conventional fMRI sequences, ultrafast fMRI sequences aim to upon hind-paw stimulation with voxel resolution. Their results
shorten the repetition time (TR), which is the time from the indicated that the dfMRI signal exhibits layer specificity and is
application of a radiofrequency excitation pulse to the application spatially overlapping with the underlying neural activity within the
of the next pulse. This can be achieved in a number of ways. One thalamocortical pathway.
approach is to use simultaneous multi-slice imaging. Recently, Lee Another family of methods that have recently been developed
et al. [71] developed a sequence for rodent fMRI that can encode to evaluate neural activity is called molecular fMRI. Molecular fMRI
multiple slices simultaneously by using slice-select gradient blips. monitors brain activity through the use of chemical or genetically
Blips impose different amounts of linear phase for different slices; encoded probes, i.e., MRI molecular imaging agents, which are
thanks to an extended field of view (FOV), each slice is shifted designed to bind to specific molecular and cellular targets in the
towards a different and non-overlapping portion of the FOV, thus brain, analogous to fluorescent dyes for optical imaging [82–84].
speeding up the acquisition by a factor of 4, while keeping a These MRI molecular imaging agents work by interacting with
similar SNR to conventional EPI sequences. water molecules to alter T1 and T2 relaxation times, or in some
Being able to use high spatiotemporal resolution is also critical cases by incorporating nuclei that can be probed using radio
to discern the direction of information flow using the onset times frequencies distinct from those used to measure water protons
of fMRI responses. For example, Jung and colleagues [72] applied [83, 85]. Thus, molecular fMRI readout reflects the distinct
a GRE-EPI sequence at an ultra-high magnetic field (15.2 T) with a molecular hallmarks of neural activity, rather than hemodynamic
temporal resolution of 250 ms and spatial resolution of 156 × coupling that underlies BOLD fMRI. The first molecular fMRI study
156 × 500 μm3 during either electrical paw stimulation or opto- to combine molecular specificity and spatial coverage using a
genetics stimulation of the motor cortex. Their results showed that neurotransmitter sensor detectable by MRI assessed dopamine
the order of onset times varies between regions and active layers signaling. They injected MRI CA sensitive to dopamine into the rat
and coincides with their known sequence of neural activation. This nucleus accumbens (NAc) and measured changes in dopamine
work provided further evidence that ultra-high resolution BOLD concentration in NAc and caudate-putamen (CPu) upon electrical
fMRI can be useful to identify bottom–up and top–down stimulation of the medial forebrain bundle in the lateral
Translational Psychiatry (2021)11:457M. Markicevic et al.
4
hypothalamus [86]. Recently, this approach was combined with cranial windows or skull thinning procedures were used for stable
BOLD fMRI [87], where simultaneous functional BOLD and chronic imaging of deep brain structures. However, in 2017 Tiran
molecular imaging responses were recorded throughout the rat et al. [98] showed that the whole-brain vasculature could be
brain using multi-gradient echo MRI pulse sequence, during imaged through the skull and skin in awake and freely moving
electrical stimulation of the hypothalamus. Results indicated that mice, whereas young rats can be imaged up to 35 days of age
phasic dopamine release in the NAc and medial CPu alters the without prominent reductions in image quality. A year later, Macé
duration, but not the magnitude, of the stimulus responses across et al. [99] used fUS to map the brain areas activated during
the striatum via postsynaptic effects that vary across subregions, optokinetic reflex in awake mice and functionally dissect the
and that dopamine causally modulates BOLD fMRI responses in regions whose activity depended on the reflex’s motor output. To
the distal cortical regions. date, new strategies can further increase the resolution of
Another method that allows quantitative and non-invasive acquired images while maintaining rapid acquisition, for example,
assessment of cerebral metabolism during brain activity is using microbubble CAs and time tracking of microbubble
functional magnetic resonance spectroscopy (fMRS). The goal of positions [100].
fMRS is to obtain precise quantitative in vivo measurements of In general, brain imaging in awake and behaving animals
various metabolic concentration changes during brain activity. confers an advantage to fUS over fMRI. Furthermore, fUS
Although broadly used in human brain studies, its application in combines whole-brain reading with a relatively high spatial
rodents is still limited mainly due to low SNR, low (~4 sec) resolution (100 × 100 × 300 µm) but with higher temporal resolu-
temporal resolution, and anesthesia confounds [88, 89]. A recent tion and low operating and maintenance costs. Although the skull
review gives a detailed overview of the methodological aspects remains an obstacle in fUS imaging for ultrasound wave
and translational prospects of fMRS in rodents [88]. propagation, the use of CAs [101] or a surgical procedure to
produce a craniotomy or thinned skull window can solve this
Ultrasound imaging. Ultrasound imaging is a widely used problem. Thanks to recent developments in injectable ultrasound
diagnostic technique in medicine that is based on the principle contrast media or ultrafast high SNR sequences, an expansion of
of the emission of ultrasonic waves (from 20 KHz to ~15 MHz) and preclinical fUS applications in neuroscience is expected in the near
the transmission of echoes. Using the speed of sound and the future.
time of each echo’s return, an ultrasound system calculates the
distance from the transducer to the tissue boundary and then uses Fluorescence imaging. There are several optical imaging techni-
this information to generate images of tissues and organs [90]. ques that measure the activity of single neurons or neural groups,
Ultrasound systems can also be tuned to assess blood flow using based on voltage or calcium dyes or genetically encoded probes.
the Doppler effect. The principle of Doppler ultrasound consists of More recently, the field has seen strong development of methods
detecting the movement of red blood cells by repeating pulsed that increase the visual field and allow large-scale measurements
emissions and studying the temporal variations of subsequent of neural activity. The basic principle common to these techniques
backscattered signals [91]. In clinics, Doppler ultrasound is the lies in the light emission of specific chemical compounds named
most commonly used technique to study blood circulation in the fluorophores. The fluorophore absorbs light of a specific
heart, arteries, limbs, kidneys, and liver. However, for the brain, the wavelength that brings it from a ground state to an excited state.
application of transcranial Doppler (TCD) ultrasound is limited When the fluorophore relaxes back to the ground state, in a
owing to strong attenuation of the ultrasound beam by the skull, process named luminescence, it emits light at a specific
and its only clinical use is to diagnose cerebrovascular pathologies wavelength and energy. The light emitted during the lumines-
in newborns through the fontanel (for a review of TCD cence—the fluorescence signal—is then captured by the adjacent
applications see [92]). optical system. The two key factors defining a fluorescent imaging
technique are (i) the type of fluorophore used [102, 103] and (ii)
Functional ultrasound imaging in rodents: Until recently, little the design of the optical system [104]. In the following sections,
work has been done in preclinical rodent neuroscience using TCD. we will address both factors with respect to in vivo functional
Although partial skull removal could resolve scattering problems, brain imaging in rodents.
conventional ultrasound still suffers from low sensitivity, which
limits its application to image blood volume or flows in major Fluorophores: Fluorophores can change their fluorescent prop-
cerebral arteries. However, the development of new concepts and erties, such as the wavelength or the intensity of the fluorescent
technologies, such as ultrafast ultrasound and the use of plane- signal, when involved in a specific physiological process, e.g., the
wave illumination as opposed to focused beam scanning, have firing of an action potential. The two most popular families of
enabled the use of ultrasound in basic neuroscience research [93]. fluorophores used for in vivo brain imaging are (i) calcium and (ii)
Thanks to new scanners capable of acquiring images at a very voltage indicators. Calcium indicators measure changes in
high frame rate (~20 kHz), ultrafast ultrasound can boost the intracellular calcium ion concentration, whereas voltage indicators
power Doppler SNR over 50-fold, without the need for CAs [90]. assess alterations in the membrane potential.
This increased sensitivity allows mapping of blood flow changes in Both calcium and voltage indicators can be further divided
small arterioles (up to 1 mm/s) that are related to small and into two main groups: organic (e.g., chemical) [105–107] and
transient changes in neuronal activity, laying the foundation for genetically encoded [107, 108]. Organic calcium (e.g., fluo-4) or
functional ultrasound (fUS) imaging (for a review on the voltage (e.g., ANINNE-6) indicators are synthesized organic
techniques and physics of this technology see [90] and [93]). molecules that are delivered into a target cell via bulk loading
The first application of fUS imaging in translational neu- or cell microinjections [105, 107, 109, 110]. In contrast,
roscience appeared in 2011, when Macé and colleagues [94] genetically encoded calcium (e.g., GCaMPs) or voltage (e.g.,
showed the activation of the barrel cortex following whisker ASAPs) indicators are expressed directly by the target cell. The
stimulation in anesthetized rats with high spatiotemporal detail. incorporation of the indicator genes is achieved by using
Furthermore, the authors measured the spatiotemporal dynamics transgenic animals and/or virus vectors designed to express the
of epileptiform seizures, showing cortical spreading depression genetic material under the control of a tissue-specific promoter
propagating throughout the entire brain. Since then, more groups [107–109, 111]. The cell type-specific expression ensured by a
have started to use fUS as a tool to record whole-brain activity in tissue-specific promoter makes genetically encoded calcium
many behavioral and cognitive tasks, such as forepaw electrical indicators (e.g., GCaMPs) the most popular choice for in vivo
stimulation in rats [95], or at rest [96, 97]. In most cases, large brain fluorescent imaging in rodents.
Translational Psychiatry (2021)11:457M. Markicevic et al.
5
Voltage indicators are sensitive to subthreshold membrane combined with a procedure to replace the skull with a glass cranial
voltage dynamics and have a higher temporal resolution in window [113, 114]. For example, Kim et al. [114] measured GCaMP
comparison with the calcium indicators [107, 112] Nevertheless, fluorescent signals with single-neuron resolution throughout the
their use for widefield in vivo brain imaging in rodents is entire dorsal cortex in awake, head-fixed mice. However, WF can
hampered by the intrinsic low SNR [109] and by the technical also be conducted through the skull by removing only the scalp.
challenge of achieving a precise localization of the voltage This severely limits the precision and resolution of the images but
indicators in the cell membrane [107, 112]. Therefore, while also minimizes invasiveness. Using WF imaging of GCaMP through
recognizing recent developments [107, 112] and the potential of the intact skull, Peters and colleagues [115] functionally mapped
multiarea voltage imaging [112], we will focus our review on activity across the entire dorsal cortex in awake head-fixed mice,
calcium indicators. with a spatial resolution of 20 µm.
Animal experiments with head restraints impose a fundamental
Optical designs: There are several optical systems currently technical limit on the behavior that can be studied. To overcome
available for detecting the fluorescent signal emitted by a this limitation, WF micro-endoscopes and optical fibers have been
fluorophore. Each of these can be used to maximize certain designed to visualize cortical and subcortical activity in awake and
image parameters such as acquisition speed, spatial resolution, freely moving animals [116–120]. De Groot et al. [120] integrated
FOV, and dimensionality (e.g., 2D slice or 3D image) [104]. In the two micro-endoscopes for simultaneous recording from distant
next sections, we focus on the most common fluorescence brain regions, an inertial measurement unit for movement
imaging procedures used for in vivo brain imaging in rodents. For monitoring, and an LED driver for optogenetic stimulation in a
each method, we explain the basic principles of the optical design single device named the “NINscope”. In one of their demonstra-
and review work that demonstrates its application in studying tions, NINscopes were used to record the fluorescence of GCaMPs
brain function with a large FOV. from the cortex and cerebellum and study the generation of
movement upon cerebellar optogenetic stimulation in freely
Wide-field fluorescence imaging: Wide-field fluorescence ima- moving mice.
ging (WF) refers to a procedure in which a whole specimen (e.g., Despite the great potential of WF for in vivo brain imaging, its
the targeted brain regions or the entire cortex) is illuminated and optical design suffers from a strong susceptibility to background
the emitted fluorescence is recorded by a joined optical system fluorescence caused by the signal coming out of the focal plane.
(Fig. 2). In WF, it is essential to guarantee the passage of light with This places some fundamental constraints on WF applications.
minimal dispersion and absorption; for this reason, WF is often First, the background fluorescence decreases the SNR, which limits
Translational Psychiatry (2021)11:457M. Markicevic et al.
6
Fig. 2 Microscopy designs. The main engineering components and operational modes of widefield, confocal, two-photon, and light-sheet
microscopes. LED light-emitting diode, CCD charge-coupled device. Wide-field microscopes use arc lamps or LEDs (not shown) to produce a
beam of light at a specific wavelength. In the case of Arc lamps filters (horizontal blue bulk) are used to select a specific wavelength from a
continuous spectrum. The illumination light irradiates the entire specimen through the objective lens causing the excitation of fluorophores.
The fluorescent signal emitted during the luminescence process is collected by the same objective lens and reflected by the dichroic mirror
(deflected blue bulk) toward the CCD camera. Confocal microscopes use the same optical system as a wide-field microscope, with a few
differences: (i) lasers are used as a light source, (ii) a “pinhole” is used to cut off the light outside of the focal plane, and (iii) a photo-multiplier
tube (PMT) is used for image acquisition. Continuous-wave lasers (CW laser) are typically used in confocal designs ensuring the stable
amplitude and wavelength of the illumination light. Depending on the operational mode the illumination is focused on the specific point
(point-scanning), line (line-scanning), or multiple points (multisport scanning) inside a specimen. The black arrows feature possible scanning
directions. The emitted fluorescent light is passed through the pinhole and ultimately collected by the PMT, which enhances the amplitude of
the impingement light. Note that scanning mechanisms (XY) are not shown and that the confocal pinhole would need to be placed in the
descanned pathway. When featured, XY scanner (e.g., galvo mirror scanner) is located on the detection pathway between the objective and
dichroic mirror. Z-steppers or tunable acoustic gradient (TAG) lens for z-scanning is also not shown. When depicted, they are located at the
back focal aperture of the objective. Multiphoton microscopes are represented by the example of the two-photon design. It utilizes the same
components as the confocal, but with two principal differences: (i) a pulsed laser is used, (ii) a “pinhole” is not required. Two-photon
microscopy is based on the two-photon excitation process: a fluorophore simultaneously absorbs two photons that together bring sufficient
energy to cause the fluorophore excitation. Subsequent relaxation of the excited fluorophore back to the ground state is accompanied by the
fluorescence emission. For the practical realization of the simultaneous absorption of two photons, a pulsed laser produces a beam of
photons with the energy tuned for the two-photon excitation process of the targeted fluorophore: ½ of the excitation energy per photon.
Since only the fluorophores at the focal plane can simultaneously absorb two photons, a pinhole is not used. Two-photon microscopes can be
used in various scanning modes. Point-scanning mode refers to the illumination of a single point per scanning session. Random access is the
point-scanning mode that is used for a set of predefined locations in the sample. Therefore, the random access technique does not image the
whole specimen, but rather the part sufficient for the analysis. During a multispot session, multiple points are illuminated in parallel during
the same scanning session. Finally, during the temporal focusing, the laser beam impinges on the diffraction grid, producing several beams
that are further guided by the optical system to constructively interfere in the focal plane located at the specimen. Thus, the two-photon
temporal focusing mode leads to the activation of a single plane. Light-sheet microscopes typically use an LED (or several) to illuminate the
specimen from the side. Such an illumination process is called “Oblique Illumination”. The emitted fluorescent signal is captured by
the objective lens and further transmitted to the CCD camera. Classical orthogonal light-sheet microscopy uses two orthogonal objectives:
the first is for illumination and the second is for detection. This design requires a highly constrained sample geometry and either physical
sample translation for 3D imaging or complex synchronization of illumination and detection planes. Both constraints limit the acquisition
speed of classical orthogonal light-sheet microscopy. In the objective coupled planar excitation (OCPE) design the position of the illumination
and detection objectives are mechanically coupled. Despite the ensured alignment of the illumination and detection planes, OCPE still
requires mechanical movement of the coupled objectives to perform scanning. Finally, SCAPE microscopy acquires images using an angled,
swept light sheet in a single objective. SCAPE permits three-dimensional imaging of intact samples at rates exceeding 20 volumes per second.
[140, 200–204].
the spatial resolution and does not allow scanning subcellular
structures (e.g., synaptic boutons). Second, as the depth of focus is behaving mice compared with anesthetized animals [123].
determined by fixed parameters of the optics, there is a greater Nevertheless, in the confocal design, the photons out of the focal
blur in the image when targeting deeper structures owing to the plane still contribute to phototoxicity and photobleaching [124].
background signal from the regions above. This currently limits Another drawback is related to tissue scattering, which limits the
the depth of WF imaging to the superficial layers of the cortex. depth of focus to a maximum of 100–200 µm [122, 123].
Finally, the continuous excitation of fluorophores from outside the
focal plane can lead to an increase in phototoxicity and the Multiphoton fluorescence imaging: Multiphoton microscopes
production of reactive oxygen species (ROS), and photobleaching, use two or three photons to provide the energy needed to excite
which results in the inactivation of the fluorophore. a fluorophore. The use of multiple photons means that the
individual energy of each photon will be lower than that of a
single excitation photon. Therefore, the corresponding wave-
Confocal fluorescence imaging: Confocal microscopes use the lengths are shifted in the red/infrared part of the light spectrum,
same optical scheme as WF but with two additional features in which is less scattered by brain tissues than other wavelengths.
order to increase the SNR. First, confocal microscopes utilize a tiny This gives multiphoton fluorescence imaging a greater depth of
diaphragm, named a “pinhole”, to remove the signal coming out penetration than one-photon modes (e.g., WF, confocal). Also,
of the focal plane. Second, confocal microscopes use lasers as a owing to the greater focus of the laser beam, the fluorophores
light source instead of LEDs or arc lamps. This increases the focus outside the focal plane do not absorb two photons (or three by
of the illumination beam on the targeted region, whereas three photons) simultaneously and are not excited. Therefore, the
minimizing out-of-focus illumination. To achieve a large FOV, a use of multiple photons ensures that the fluorophores are
complete 2D or 3D image of a sample is usually acquired by activated only in the focal plane, thus reducing background
moving the illumination spot across the sample [104, 109, 121]. fluorescence and phototoxicity [124, 125].
Confocal fluorescence imaging was used by Yoshida et al. [122] to Sofroniew et al. [126] used the two-photon design to
measure GCaMP6 fluorescence from individual axonal boutons in simultaneously record GCaMPs signals from a circular FOV with
behaving head-restrained mice. By using a multispot confocal a 5 mm radius, reaching depths of up to 1 mm. This was used to
design, they could image for the first time a relatively large FOV of simultaneously monitor the activity from somatosensory, parietal,
1 mm2. This allowed the study of long-range projecting axons and motor cortical areas in head-fixed, behaving mice. At the
from the thalamus to the primary motor cortex (M1) in layer 1. In same time, the high spatial resolution permitted the visualization
order to circumvent the need for a head-fixation constraint, of calcium signals from individual spines. In order to further
Dussaux and colleagues developed a fibrescope adaptation of the increase the FOV, Yang et al. [127] introduced the “MATRIEX”
confocal design, which allows a FOV of 230 µm with single-cell design for multiarea two-photon imaging. MATRIEX uses multiple
spatial resolution. This design was used to study changes in the water-immersed miniature objectives, each having its own focal
velocity of red blood cells in cortical microvessels in freely plane. Importantly, the images from these objectives can be
Translational Psychiatry (2021)11:457M. Markicevic et al.
7
simultaneously observed through one low-magnification dry hemoglobin (HbO2) has lower absorption at 630 nm in comparison
objective. The use of several miniature objectives permitted not with deoxygenated hemoglobin (HbR). This decreased absorption
only simultaneous imaging from distant brain areas but also the leads to higher reflectance, which can be detected by an optical
ability to adjust the imaging depth of each region independently. system. The opposite effect occurs at 480 nm, where HbO2 has
This was used to simultaneously record GCaMP fluorescence from higher absorption in comparison to HbR. The absorption at
multiple brain regions distributed across an area up to 12 mm2 530 nm or 590 nm is insensitive to the oxygenated state of
and located at different depths: primary visual cortex (V1), the hemoglobin and is used to assess changes in hemoglobin
primary motor cortex (M1), and CA1 region of the hippocampus. concentration (HbT) [141]. State-of-the-art IOI uses standard
Wagner et al. [128] used two independent two-photon systems to charged coupled device (CCD) cameras to collect the reflected
image calcium activity from L5 of the premotor cortex and light, while the illumination source at a specific wavelength can be
cerebellum granule cells (GrCs) with single-cell spatial resolution. achieved with LEDs or filters applied to a white light source [141].
The experiment was conducted on awake head-restrained mice The first application of IOI in neuroscience was by Grinvald and
and allowed the researchers to examine the activity patterns in L5 colleagues [106] in 1986. In their work, IOI with light at a
and GrCs during a motor learning task. In order to use wavelength of 665 to 750 nm was used to map the activation of
multiphoton imaging in freely moving animals, miniature versions the exposed barrel cortex in anesthetized rats during mechanical
of two-photon microscopes were recently developed [129–131]. stimulation of whiskers. In the same study, IOI was used to map
Zong et al. [131] used mini two-photon microscopes for calcium orientational columns in the visual cortex of cats and monkeys,
imaging in V1 in freely moving mice while keeping the spatial highlighting a potential implementation of IOS in cross-species
resolution at the level of individual spines, which is comparable to research.
the conventional design. More recently, Klioutchnikov et al. [132] Over the years, IOI has been adapted for imaging in the entire
adopted a three-photon design for a head-mounted version and cortex in rodents [142, 143]. White et al. [143] used IOI to study
performed cortical imaging to a depth of 1.1 mm in freely moving resting-state functional connectivity in the dorsal cortex in
rats with a spatial resolution of a few micrometers, enabling anesthetized mice with a FOV of 1 cm2 across the exposed intact
imaging of calcium signals from single soma and dendrites. skull. Specifically, they used multiple LEDs (478 nm, 588 nm,
Despite these technical advances, both conventional multi- 610 nm, and 625 nm) to simultaneously acquire signals of both
photon and confocal methods are point-scanning techniques. HbO2 and HbR and used these patterns for functional parcellation
Therefore, they have a speed acquisition limit, which is set by the of the mouse cortex. Kura and colleagues [142] later compared the
fluorescence lifetime of the fluorophore and the pulse of the laser. resting-state cortical connectivity maps based on IOS from
In other words, one can proceed with the next scanning point of multiple wavelengths versus those obtained from a single
the specimen only after the signal from the previous point is fully wavelength. The results revealed that connectivity maps based
acquired. This limitation could be overcome by performing on IOS from HbO2 and HbR are quantitatively comparable with the
multiple scans in parallel, therefore, performing multispot multi- maps based on HbT changes.
photon imaging (see Fig. 2 for details) [133, 134]. However, the However, conventional IOI has some fundamental constraints.
parallel scanning of multiple spots requires spreading the laser Since IOI is based on the hemodynamic response, it lacks cell type
beam to excite multiple spots in parallel, which reduces the specificity and has limited temporal resolution compared with
excitation intensity at each individual spot, potentially compro- other optical methods. Furthermore, like all-optical imaging
mising the fluorophore excitation. This constraint cannot be methods, it suffers from limitations in spatial resolution owing
simply overcome by increasing the laser power owing to excessive to signal scattering by the skull. In experiments where non-
heating of the tissue. An increase in the excitation intensity in the invasiveness is not a necessary parameter, IOI can be combined
multispot two-photon design can be achieved by combining two- with other imaging techniques (e.g., calcium imaging), bypassing
photon imaging with light-sheet microscopy [135, 136]. The light- these limitations. For example, researchers from Hillman’s lab
sheet microscopy approach uses a side illumination that increases measured the IOS and GCaMP fluorescent signal from the
the chance of a photon being absorbed by the fluorophore in the bilaterally exposed dorsal cortex in awake, head-fixed mice
desired plane (e.g., increased photon yield) while reducing [141]. The simultaneous assessment of IOS and fluorescent signals,
photobleaching and phototoxicity, as it uses less laser power in named wide-field optical mapping (WFOM), allowed an increase in
comparison to confocal and multiphoton approaches. Photon the spatial resolution after correcting for the cross-talk between
light-sheet fluorescent calcium imaging has been used for in vivo the excitation and emission spectra of GCaMP and the absorption
functional imaging in awake head-restrained mice. However, it still of oxygenated and deoxygenated hemoglobin. Ultimately, it was
has limited FOV (340 × 650 µm) and depth (135 µm), which possible to achieve single-cell resolution, with cell type specificity
restricted the analysis to only the motor cortex [137]. In vivo ensured by the GCaMP expression.
two-photon light-sheet imaging [135, 136, 138, 139] has not yet
been applied for wide-field imaging in mice or rats. However, Light scattering imaging. In the fluorescence imaging section, we
taking into account the rapid technological advances in multi- have focused on practical approaches that rely on measurements
photon imaging, we anticipate that the combination of a two- of absorbed light. However, the interaction of light with the
photon setup and light-sheet microscopy will soon be imple- sample (i.e., the brain) is not limited to absorption and is also
mented to further increase the FOV of functional fluorescent affected by scattering. In the following section, we will briefly
imaging. discuss light scattered imaging. We limit our focus to two areas: (1)
light scattering mechanisms and their influence on IOS and (2)
Intrinsic optical imaging. Despite being one of the most widely laser speckle imaging.
used methods for in vivo wide-field fluorescent brain imaging, the
use of artificial fluorophores (e.g., GCaMPs) is inevitably linked with Mechanisms of light scattering and its influence on IOS.: As
either invasive interventions such as microinjections or with summarized by Villinger and Chance [144], there are two types of
genetically modified organisms [109]. This impedes the applica- light scattering associated with neural activity: fast and slow. In
tion of these methods to other experimental animals (e.g., non- 1980 Tasaki, Iwasa, and Gibbons [145] described the physiological
human primates) and humans. Intrinsic optical imaging (IOI) basis of fast scattering. They used a photon sensor located on the
[106, 140] relies on the difference in light absorption between surface of a claw nerve to detect motion of the nerve surface upon
oxygenated and deoxygenated hemoglobin and provides a non- traveling of an action potential in vitro. As shown later [144], this
invasive alternative to fluorescent imaging. In brief, oxygenated movement of the cell membrane leads to changes in the refractive
Translational Psychiatry (2021)11:457M. Markicevic et al.
8
index of the membrane, which ultimately affects the scattering of to a general acceptance of LSCI as the standard for CBF
light. In the early 1990s MacVircar and Hochman studied the monitoring in neurosurgery.
mechanism of slow scattering by measuring light transmission in
the dendritic area of the CA1 region in slices of rat brain. Synaptic Photoacoustic imaging. Despite recent methodological break-
activity has been found to result in increased light transmission. throughs, non-invasive in vivo optical microscopy still faces
This effect was related to the potential glial swelling triggered by inherent optical limitations that restrict it to mostly cortical
the increased extracellular concentration of K+, which occurred investigations [155]. To this end, photoacoustic (optoacoustic)
during the generation of an action potential. The swelling of the imaging (PAI) offers high resolution in tissue depths far beyond
cells causes less light scattering, therefore, increasing light current microscopy standards while maintaining rich optical
transmission [146]. This could not be explained by changes in contrast [156, 157]. In PAI, signal generation relies on the
HbO2 absorbance [146, 147], thus exposing a mainly different absorption of pulsed laser light at specific optical wavelengths
factor that affects IOS. by endogenous chromophores like oxy-/deoxy hemoglobin or
The “fast” and “slow” scatterings were further confirmed by exogenous CAs. Tissue heating owing to the process of photon
in vivo rodent experiments. Rector and colleagues [148] recorded absorption produces broadband acoustic waves at megahertz
IOS from the barrel cortex of anesthetized rats. Using a specifically frequencies (photoacoustic effect) which can be detected at the
designed fiber optic probe [149] that was placed on top of the tissue surface by ultrasound transducers and reconstructed based
dura matter, they measured fluctuations in scattered light on the distribution of absorbed optical energy [156]. Although
intensity on a millisecond time scale upon twitching of the PAI’s prevailing application is in cancer research [158, 159], its non-
whisker. The data from “fast scattered” light were further used to invasive nature and ability to directly monitor biological processes
map the individual columns in the barrel cortex. Subsequently, make it an appealing tool for in vivo neuroimaging. The following
Pan et al. [150] were able to simultaneously measure two effects part will review the most recent applications of PAI in wide-field
that drive IOS upon spontaneous neuronal activation: (1) the functional imaging in rodents.
increased absorption driven by increased HbO2 concentration (2)
the reduction of overall neural tissue scattering caused by neural Photoacoustic visualization of in vivo neural dynamics: Given
tissue swelling. In brief, Pan and colleagues used two implantable that PAI combines both optical excitation and acoustic detection,
optodes (i.e., a fiber pair): the light source and the detector, to a variety of imaging techniques are available, with photoacoustic
measure the light transmission through the neural tissue of microscopy (PAM) and tomography (PAT) being the most
anesthetized rats. The pair of fibers were used to measure from promising ones for preclinical in vivo functional neuroimaging
either the primary somatosensory area or caudate-putamen. (see [160] for a comprehensive overview of PAI methods).
Importantly, both effects: absorption by HbO2 and scattering by
swelled tissue, were on the same time scale—seconds, emphasiz- Photoacoustic microscopy: PAM operates by scanning a tightly
ing the interference between slow scattering and IOS. This focused laser beam point-by-point across the tissue surface and
interference can lead to a potential misinterpretation of the detecting the thermoelastically evoked acoustic waves [161]. It
imaging results. One of the possible solutions to circumvent this provides a comprehensive and quantitative characterization of
pitfall is the one suggested by Pan et al. simultaneous cerebral hemodynamics with an excellent spatial resolution of a
measurement of light absorption and scattering. Finally, the few microns [162]. An early application of PAM verified the “initial
underlying physiology of slow scattering and fast scattering is dip” of the BOLD fMRI hemodynamic response to an electric
independent of neurovascular coupling suggesting scattering as a stimulus as rapid changes in arteriolar oxy-/deoxy hemoglobin
separate imaging contrast [148, 150]. Despite the current ratios [163]. PAM systems have since been further developed and
limitation to a single area of the brain, the potential use of, for used for many applications in neuroscience [155, 164, 165]. Using
example, different pairs of fibers may allow for in vivo “imaging” acoustic-resolution PAM (AR-PAM), Stein et al. [166] non-invasively
from multiple brain areas. imaged blood-oxygenation dynamics of several cortical vessels in
rodents during controlled hypoxia and hyperoxia challenges.
Laser speckle imaging: In addition to the static scattering, in Follow-up systems, capable of three-dimensional high-speed
which particle motion is ignored, light scattering is also used for imaging, were introduced a few years after to non-invasively
CBF quantification in Laser Speckle Contrast Imaging (LSCI). In map cortical blood-oxygenation at the capillary level
short, if coherent light—such as from a laser—is scattered on [161, 167, 168]. Modern PAM systems now enable the investiga-
moving particles—such as red blood cells—the resulting inter- tion of spontaneous cerebral hemodynamic fluctuations and their
ference patterns, or speckles, will cause a dynamic change in the associated functional connections in rodent research [164, 169].
backscattered light. With contrast-enhancing agents like genetically encoded chro-
In 1981, Ferchner and Briers [151] suggested making a short mophores and voltage-sensitive dyes (VSD), the repertoire of PAI
exposure (in the 10 ms interval [152]) of the speckle temporal was extended to not only include the detection of hemodynamic
fluctuations, thus converting the unknown distribution of the processes but also direct detection and quantification of neuronal
velocities to the variations of the speckle contrast. These contrast activity [170, 171]. For example, Shemetov et al. [172] engineered
changes were then converted into intensity distributions, which a genetically encoded calcium indicator with an increase of up to
reflect the velocity distribution of the moving particles. This 600% in the fluorescence response to calcium. The probe was
approach established a basis for LSCI’s CBF visualization. In the validated in vivo using hybrid photoacoustic and light-sheet
early 2000s, Dunn and colleagues [152] were the first to use LSCI microscopy, where both neuronal and hemodynamic activity
to measure CBF in anesthetized rats. The researchers used a CCD could be captured with high resolution through the intact mouse
camera through the 6 × 6 mm FOV of the cortex of rats suffering skull. Despite constant technical advances, though, PAM’s high
from diffuse cortical depression or cerebral ischemia. The resolution and imaging speed are yet to be applicable to tissue
spatiotemporal resolution was 10 µm and 1 ms, respectively. In penetration depths beyond 1 mm. In such cases, photoacoustic
2020, Postnov and colleagues [153] monitored CBF after stroke tomographic systems based on ring-shaped transducer arrays can
induction in mice with an exposure time of ~30 µs and a provide deep brain volumetric visualization of hemodynamics and
spatiotemporal resolution of 10 µm and 10 µs. Importantly, LSCI is stimulus-evoked brain activity [155, 160, 173].
currently used for clinical research in several fields of medicine,
including neurology [154]. This increases the translational Photoacoustic tomography: PAT uses several wavelength lasers
potential of this technique, which could in the near future lead to evoke photoacoustic waves, making it possible to non-
Translational Psychiatry (2021)11:457M. Markicevic et al.
9
invasively and volumetrically measure varying concentrations of Wheeler and colleagues [191] studied brain-level maps of memory
endogenous chromophores and exogenous CAs in deep brain recall-induced expression of Fos, which was characterized through
tissue [174–176]. In fact, the first in vivo photoacoustic images of a fear conditioning task. Using graph theory analysis of regional
small animals were reconstructed based on PAT system scans Fos quantification to study changes in network connectivity as a
from a rat’s head: Wang et al. [177] accurately mapped brain function of memory recall, they found that memory recall involves
structures with and without lesions, as well as functional cerebral activation of distributed network sets, with hubs in the prefrontal
hemodynamic changes in cortical blood vessels around the barrel cortex and in the thalamus. Multiple comprehensive maps of Fos
cortex in response to whisker stimulation. PAT has also been expression were generated to study brain activity induced by a
successfully applied to study whole-brain hemodynamics [176] number of different behaviors such as fear [194], fear learning, and
and even resting-state functional connectivity in rodents [178]. In recall [190] as well as alcohol addiction and withdrawal [193].
2016, Tang et al. [179, 180] described a similar but wearable cap- Evaluation of Fos expression maps at the brain level helps in the
like PAT system for awake and behaving rats, with a high in-plane mapping of cellular networks involved in the expression of normal
spatial resolution of 200 µm at depths of up to 11 mm. In a mouse behaviors and in the in-depth investigation of circuit dysfunction
model of epilepsy, oxy-/deoxy hemoglobin-based photoacoustic in mouse models of neurological diseases.
computed tomography (PACT) scanning system captured the Constant developments and advances in micro- and mesoscale
superficial epileptic wave spreading around the epileptic focus imaging methods have prompted the creation of new tools for
and a corresponding wave propagating in the opposite hemi- evaluating the function of whole-brain circuits. This has led to a
sphere [181]. Going beyond superficial cortical measurements, a series of interactive computational structures that automatically
newly devised system combining PACT and electrophysiological annotate, analyze, visualize and share whole-brain data at cellular
recordings enabled the first non-invasive visualization of real-time resolution, using the interactive mouse brain atlas. Specifically,
thalamocortical activity during an epileptic seizure in the whole Furth et al. [195] developed an open-source software solution
mouse brain. Furthermore, endogenous contrast-based PACT “WholeBrain”, which enables the quantification and spatial
successfully mapped brain-wide activation during electrical fore- mapping of multidimensional data from whole-brain experiments,
and hind-paw stimulation in mice to their somatosensory cortex followed by “Openbrainmap” which enables data visualization and
forelimb and hindlimb areas, respectively [182]. Using contrast sharing in an interactive web-based framework. Another compu-
enhancement, Gottschalk et al. [183] recently measured real-time tational interface for single-resolution whole mouse brain analysis
in vivo calcium transients across the mouse brain by devising a is CUBIC-Cloud [196]. CUBIC-Cloud builds the user’s mouse brain
functional PA neuro-tomography setup. They reached sufficient database from the 3D image stack, whereas the graphical user
sensitivity to directly detect fast neural responses to electrical interface tools perform various types of quantification tasks. There
hind-paw stimulation. Using a near-infrared VSD, Kang et al. [184] are numerous other frameworks that allow a solid reconstruction
monitored in vivo chemically evoked seizures in rats at sub-mm and recording of the whole mouse brain, such as “ClearMap” [197],
spatial resolution, without the need for invasive craniotomy of “BrainsMapi” [198], “NeuroInfo” [199], to name but a few. The
skull thinning. availability of these open-source computational frameworks not
Although still in its infancy, whole-brain functional PAI has only simplifies the analysis of large imaging data sets but also
rapidly evolved in recent years to meet the standards of the facilitates the rapid comparison and sharing of data between
mainstay neuroimaging methods. With its multiscale imaging projects and laboratories.
capabilities comprising rich optical contrast, high spatial resolu-
tion, and imaging rate, PAI sits at a unique position to directly
visualize key parameters of brain function. Although PAI does CONCLUSIONS
come with its own set of limitations, much like any other Until recently, the inability to measure brain activity in its entirety
neuroimaging technique, it nevertheless shows great potential to and simultaneously link it to physiologically relevant processes has
bridge the gap between micro- and macroscopic functional limited our understanding of the relationship between neuronal
neuroimaging. activity and complex cognitive processes. This has changed
dramatically with new large-scale functional imaging methods,
Alternative methods for whole-brain functional mapping and data which allow us to study previously invisible processes both in real-
analysis. In this review, we focused on a group of rapidly time and longitudinally, and to associate these processes with
developing imaging methods that allow us to study the healthy or impaired neural function.
interactions between groups of neurons in a network. However, In this review, we have seen how the development of these
there are other ways to study brain function, which will be approaches has allowed for higher spatial resolution, a wider FOV,
mentioned here. A technique that has existed since the first half of and greater temporal resolution. However, there are still many
the twentieth century is electroencephalography on rodents [185]. limitations of these techniques that prevent a full understanding
Electroencephalography enables high-resolution visualization of of local and global brain dynamics and their impact on behavior
brain activity but with very limited spatial coverage. It is mostly and cognition. We have outlined some of these gaps in each
utilized to study brain oscillation patterns in sleep, epilepsy, section of this review to guide current and future investigators
schizophrenia, or as a biomarker of pharmacological activity of (see Table 1).
centrally active drugs [185, 186]. The recent developments in Besides the precise measurement of neural activity, the field of
rodent electroencephalography, along with translational benefits functional imaging also requires integration with computational
and pitfalls of the technique regarding the study of the rodent models capable of using this data in order to make predictions
brain in health and disease have recently been outlined in detailed about behavioral functions, which can then be tested experimen-
reviews (see [185–189]). tally. However, this has not been addressed here to give greater
An additional method that allows for the evaluation of emphasis to the technical/experimental aspect of the methods
behavior-induced neural activity in rodents is based on the use discussed. The challenge for the future is therefore not only to
of genes regulated by neuronal activity, such as Fos. Fos is a design and engineer systems capable of detecting brain functions
transcription factor induced by neural activity resulting from with the highest possible precision and accuracy, but also to
emotional arousal or sensory signals [190, 191]. Immunostaining of integrate and analyze this data within theoretical models to
this immediate-early transcription factor allowed scientists to develop a complete picture that can guide our understanding of
generate whole-brain maps of behavior-induced neural activity in the human brain. This review aims to attract new researchers to
rodents [191–193]. In one of the first applications of this approach, help unravel the mysteries of large-scale neural activity.
Translational Psychiatry (2021)11:457You can also read