European Construction Sector Observatory - Country profile Ireland December 2021
←
→
Page content transcription
If your browser does not render page correctly, please read the page content below

European Construction
   Sector Observatory
           Country profile Ireland
                       December 2021

       1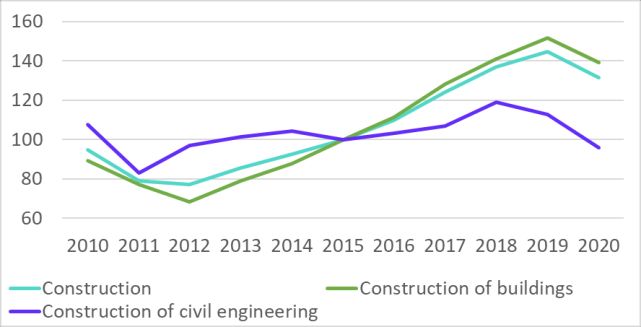
Country Fact Sheet Ireland

                                       In a nutshell
 Over the 2010-2020 period, Ireland GDP                  the narrow construction (+51.5%), manufacturing
 increased by 87.4%, from EUR 188.8 billion in           (+37.5%), and the real estate activities (+25.2%)
 2010 to EUR 353.8 billion in 2020. This represents      sub-sectors.
 an increase of 5.9% as compared to the 2019
 levels (EUR 334.2 billion). In 2021, the                  Turnover in the broad
 country’s GDP is forecast to grow significantly by        construction sector
                                                           between 2010 and 2020
                                                                                             58.0%
 14.6% (Y-o-Y), reaching EUR 405.3 billion.
Reflecting this macroeconomic trend, the number          Moreover, the gross operating rate of the broad
of enterprises in the Irish broad construction           construction sector2, which gives an indication of
sector considerably increased by 13.1% between           the sector’s profitability, stood at 16.2% in 20183,
2010 and 2020, totalling 83,577. This growth was         demonstrating the significant recovery of the
mainly driven by the increase in the number of           sector since the 2010 level of -12.0%. This is below
enterprises in the real estate activities (+65.0%),      the EU-27 average of 16.7%.
and the architectural and engineering activities
                                                         In terms of employment, there were 212,287
(+36.0%) sub-sectors over the same reference
                                                         persons employed in the Irish broad construction
period.
                                                         sector in 2020, marking an increase of 36.0%
 Number of enterprises in                                compared to the 2010 level (156,119 persons). This
 the broad construction                                  was mainly driven by the growth registered in the
 sector between 2010 and             13.1%               number of persons employed in the real estate
                                                         activities (+88.2%), the architectural and
 2020
                                                         engineering activities (+65.4%) and the narrow
In parallel, the volume index of production in the       construction (+26.5%) sub-sectors between 2010
broad construction sector recorded an increase of        and 2020.
31.4% during 2015-2020, mainly driven by a 39.2%           Number of persons
increase in the construction of buildings, offsetting      employed in the narrow
the decline registered in the construction of civil
engineering (-4.0%), over the same reference
                                                           construction sub-sector          26.5%
                                                           between 2010 and 2020
period.
                                                         The Irish construction sector suffers from a
Similarly, turnover in the broad construction sector
                                                         shortage of skilled labour, requiring an additional
in Ireland amounted to EUR 41.9 billion, which is a
                                                         40,000 to 50,000 new construction workers until
54.9% increase compared to 2010 (EUR 27.1
                                                         2027. This will be a key challenge to address, to
billion). It further increased to EUR 42.8 billion in
                                                         ensure the growth of the construction sector. To
20201, representing an increase of 58.0%
                                                         address this issue, the government has launched
compared to the 2010 level. This overall increase
                                                         several initiatives including the National Skills
was mainly driven by the turnover growth in the
                                                         Strategy 2025 and Action Plan for Jobs, which aims
architectural and engineering activities (+89.4%),
 European Construction Sector Observatory                                                                2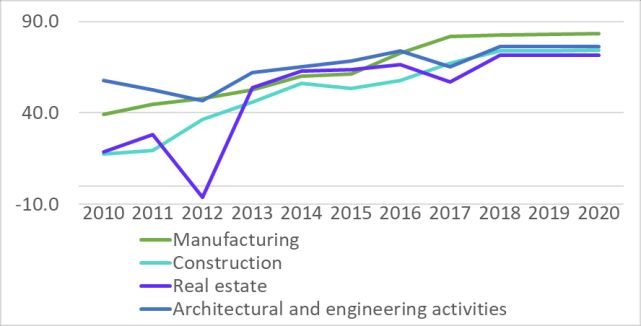
Country Fact Sheet Ireland

at improving and expanding workers’ skills,             funding for the government's Shared Island
including digital skills.                               initiative to be "at least doubled" to EUR 1.0 billion
                                                        until 2030.
Another pressing issue in Ireland is housing, given
the increasing homelessness due to shortages of           Under its EUR 989.0 million Recovery and
social housing. The government has taken a range          Resilience Plan (RRP), Ireland has allocated
of measures to support housing supply, including          EUR 164.0 million for the electrification and
the construction of social housing. As part of            upgrade of Cork commuter rail and EUR 155.0
Project Ireland 2040, EUR 7.5 billion has been            million for energy efficiency in residential and
allocated for the 2022-2027 period in the National        public building5.
Development Programme (NDP). The NDP aims at
                                                        The plan also supports the digitalisation of
investing EUR 11.6 billion over the 2018-2027
                                                        businesses, mainly of small and medium sized
period to facilitate the delivery of 112,000
                                                        enterprises (SMEs) in Ireland, with an investment
additional social housing homes.
                                                        of EUR 85.0 million. Also, the Irish plan promotes
 In October 2021, the Irish government                  digital skills by providing connectivity and
 announced a budget of EUR 6.0 billion for the          information and communications technology (ICT)
 Department of Housing, Local Government and            equipment to disadvantaged learners in schools
 Heritage for the year 20224.                           (EUR 64.0 million), as well as by supporting the
                                                        development of digital skills in Irish education at all
This includes EUR 4.0 billion to be spent on housing
                                                        levels6.
for all, the single biggest allocation for housing
investment by any Irish Government ever in a year.      Lastly, as part of the RRP, the government has also
                                                        allocated EUR 27.0 million to support access to the
In addition to the housing market, the civil
                                                        labour market for jobseekers and EUR 114.0 million
engineering market is expected to drive part of the
                                                        to support the reskilling and upskilling of workers
development in the Irish construction sector. More
                                                        with a strong focus on green, digital and
specifically, the government is expected to support
                                                        future-proof skills7.
the development of public infrastructure such as
roads, schools, rail, hospitals, housing and other        The Irish construction sector has an overall
vital societal construction. In October 2021, the         positive outlook. Non-residential and civil
Irish government announced the largest national           engineering market are expected to be the
development plan in the history of the state as it        primary growth drivers. Public sector
introduced spending proposals for the next decade         infrastructure, digitalisation, a shift towards a
(2021-2030). The plan includes a total investment         circular and green economy, backed by EU
of EUR 165.0 billion until 2030 on various capital
                                                          funding, are expected to dominate the sector’s
projects such as housing and transport
                                                          growth.
infrastructure. The investment will consist of extra
money for cross-border projects, with capital

3   European Construction Sector Observatory                                                                  3
Country Fact Sheet Ireland

                                               Table of Contents
In a nutshell ............................................................................................................................................. 2
1 Key figures ............................................................................................................................................ 5
   Construction market.........................................................................................................................................5
   Productivity ......................................................................................................................................................6
   Turnover and profitability ................................................................................................................................6
   Employment .....................................................................................................................................................7
2 Macroeconomic indicators .................................................................................................................... 8
   Economic development ....................................................................................................................................8
   Demography and employment.........................................................................................................................8
   Public finance ...................................................................................................................................................9
   Entrepreneurship and access to finance ..........................................................................................................9
3 Key economic drivers of the construction sector .................................................................................. 11
   Business confidence ...................................................................................................................................... 11
   Domestic sales ............................................................................................................................................... 11
   Export of construction-related products and services .................................................................................. 12
   Access to finance in the construction sector................................................................................................. 13
   Access to housing .......................................................................................................................................... 13
   Infrastructure................................................................................................................................................. 15
4 Key issues and barriers in the construction sector ................................................................................ 15
   Company failure ............................................................................................................................................ 16
   Trade credit ................................................................................................................................................... 16
   Late payment ................................................................................................................................................. 17
   Time and cost of obtaining building permits and licenses ............................................................................ 18
   Skills shortage ................................................................................................................................................ 18
   Sector and sub-sector specific issues ............................................................................................................ 19
5 Innovation in the construction sector................................................................................................... 20
   Innovation performance................................................................................................................................ 20
   Eco-innovation and digitalisation .................................................................................................................. 21
6 National and regional regulatory framework........................................................................................ 23
   Policy schemes............................................................................................................................................... 23
   Building regulations ....................................................................................................................................... 25
   Insurance and liability related regulations .................................................................................................... 25
7 Current status and national strategies to meet Construction 2020 objectives ........................................ 27
   TO 1 – Investment conditions and volumes .................................................................................................. 27
   TO 2 – Skills .................................................................................................................................................... 28
   TO 3 – Resource efficiency / Sustainable construction ................................................................................. 30
   TO 4 – Single Market ..................................................................................................................................... 31
   TO 5 – International competitiveness ........................................................................................................... 32
8 Outlook............................................................................................................................................... 34

European Construction Sector Observatory                                                                                                                        4
Country Fact Sheet Ireland

                                                      1
                                       Key figures
Construction market                                       The growth was mainly driven by the increase
                                                          recorded in the volume index of production for the
The number of enterprises in the broad                    construction of buildings (+39.2%), offsetting the
construction sector in Ireland totalled 83,577 in         decline registered in the construction of civil
20208 (Figure 1), representing an increment of            engineering (-4.0%), over the same reference
13.1% over the 2010 level (73,881). Enterprises in        period (Figure 2).
the narrow construction sub-sector represented
63.0% of the total, followed by the real estate            Volume index of
                                                           production in the
activities (22.4%), the architectural and
engineering      activities   (12.7%)   and    the         construction of buildings           39.2%
manufacturing (1.9%) sub-sectors respectively.             between 2015 and 2020
Over the period 2010-2020, the real estate                Figure 2: Volume index of production in Irish broad
activities sub-sector experienced the highest             construction sector between 2010 and 2020
increase (+65.0%; totalling 18,740), followed by          (2015=100)
the architectural and engineering activities
(+36.0%; totalling 10,590) sub-sectors. Conversely,
the manufacturing sub-sector experienced a
decline of 23.7% between 2010 and 2020, ending
at 1,621 enterprises; while the number of
enterprises in the narrow construction sub-sector
marginally grew (+0.04%) during the reference
period, totalling 52,626 in 2020.
Figure 1: Number of enterprises in the Irish broad
construction sector between 2010 and 2020                 Source: Eurostat, 2021.

                                                          The total added value at factor cost9 of the broad
                                                          construction sector amounted to EUR 15.8 billion
                                                          in 202010, with the narrow construction sub-sector
                                                          accounting for the largest share (62.0%, i.e.
                                                          EUR 9.8 billion). It is followed by the architectural
                                                          and engineering activities (16.2%, i.e. EUR 2.6
                                                          billion), the real estate activities (15.6%, i.e.
                                                          EUR 2.5 billion), and the manufacturing (6.1%, i.e.
                                                          EUR 1.0 billion) sub-sectors.
Source: Eurostat, 2021.
                                                          The share of gross value added (GVA) of the broad
 Number of enterprises in                                 construction sector as a percentage of GDP11 stood
 the broad construction
 sector between 2010 and            13.1%                 at 9.0% in 201712, below the EU-27 average of
                                                          16.5%. In 202013, the share of GVA of the narrow
 2020                                                     construction and the real estate activities14
The volume index of production in the broad               sub-sectors as a percentage of GDP stood at 2.1%
construction sector has been growing since 2015,          and 5.8% respectively (Figure 3).
increasing by 31.4% over the 2015-2020 period.

European Construction Sector Observatory                                                                 5
Country Fact Sheet Ireland
Figure 3: Gross value added as a share of GDP in Figure 4: Labour productivity in the broad
the Irish broad construction sub-sectors in 2020 construction sector in Ireland between 2010 and
(%) 2020 (EUR k)
Source: Eurostat, 2021 Source: Eurostat, 2021.
Ireland is statistically divided into three regions (at Turnover and profitability
NUTS 2 level) including Northern and Western,
Southern, and Eastern and Midland. Between 2010 In 2018 the turnover in the broad construction
and 201815, the GVA of the Eastern and Midland sector in Ireland amounted to EUR 41.9 billion,
region from the narrow construction sub-sector which is a 54.9% increase compared to 2010
experienced the highest increase of 312.2%, (EUR 27.1 billion). It further increased to EUR 42.8
followed by the Northern and Western (+247.4%) billion in 202020, representing an increase of 58.0%
and the Southern (+169.6%) regions. With regards compared to the 2010 level. In 2020, more than
to the real estate activities sub-sector, the GVA for half (65.3%, i.e. EUR 26.8 billion) of the total
the Eastern and Midland, Southern, and Northern turnover originated from the narrow construction
and Western regions experienced increases of sub-sector. This was followed by the architectural
113.5%, 84.7% and 70.7% respectively, during the and engineering activities (16.6%, i.e. EUR 6.8
same reference period. The Eastern and Midland billion), the real estate activities (11.6%, i.e.
region accounted for the highest share of GVA in EUR 4.8 billion), and the manufacturing (6.5%, i.e.
both the real estate activities and narrow EUR 2.7 billion) sub-sectors respectively. Notably,
construction sub-sectors, being 58.9% (EUR 11.8 over the period 2010-2020, the architectural and
billion) and 49.0% (EUR 3.9 billion), respectively, in engineering activities sub-sector registered the
201816. highest growth in turnover (+89.4%), followed by
the narrow construction (+51.5%), manufacturing
Productivity (+37.5%), and the real estate activities (+25.2%)
sub-sectors.
Apparent labour productivity17 in the broad
construction sector increased from EUR 24,479 in
Turnover in the narrow
2010 to EUR 73,838 in 201818, marking a significant
increase of 201.6%.
construction sub-sector
between 2010 and 2020
51.5%
With regards to the sub-sectors, labour
productivity in the narrow construction sub-sector The gross operating surplus of the broad
increased by 329.5% during 2010-202019, the construction sector, which was negative in 2010
highest growth among all the sub-sectors, growing turned positive in 2013 and ultimately amounted
from EUR 17,303 to EUR 74,300. This was followed to EUR 6.3 billion in 201821, against EUR 5.2 billion
by a 279.6% growth in the real estate activities in 2017.
sub-sector (from EUR 18,800 to EUR 71,365) over
The gross operating rate22 of the broad
the same period. Productivity in the manufacturing
construction sector23, which gives an indication of
and architectural and engineering activities
the sector’s profitability, stood at 16.2% in 201824,
sub-sectors also witnessed increases of 113.8%
demonstrating the significant recovery of the
and 32.1%, going from EUR 38,997 to EUR 83,365,
sector since the 2010 level of -12.0%. This is below
and from EUR 57,600 to EUR 76,111, respectively,
the EU-27 average of 16.7%. The real estate
between 2010 and 2020.
activities were the most profitable (32.9%)
European Construction Sector Observatory 6Country Fact Sheet Ireland
sub-sector in 2018, followed by the narrow Figure 6: Percentage of persons employed per
construction (14.4%) and the architectural and construction sub-sectors in Ireland in 2020
engineering activities (13.6%) sub-sectors.
In parallel, construction costs25 also witnessed a
steady increase, with the construction cost index
rising by 7.9% between 2015 and 2020 (Figure 5).
Figure 5: Construction cost index between 2010
and 2020 (2015=100)
Source: Eurostat, 2021.
Number of persons
employed in the broad
construction sector 36.0%
between 2010 and 2020
Regarding employment by specific occupations,
Source: Eurostat, 2021.
the number of professionals in the narrow
Employment construction sub-sector experienced the largest
increase (+340.7%) between 2010 and 2019. This
In 202026, there were 212,287 persons employed was followed by clerical support workers (+68.4%).
in the Irish broad construction sector, an increase However, in the manufacturing sub-sector, crafts
of 36.0% compared to the 2010 level (156,119 and related trades workers witnessed the
persons). The narrow construction sub-sector highest growth with an increment of 54.7%, while
employed 62.3% (i.e. 132,229 persons) of the total the demand for professionals rose by 34.0% over
workforce in the broad construction sector in the same period. On the contrary, the same
2020, followed by the real estate activities (16.3%, sub-sector witnessed a decline in the demand
i.e. 34,680 persons), the architectural and for managers (-28.4%) and elementary occupations
engineering activities (15.9%, i.e. 33,782 persons), (-26.0%) between 2010 and 2019.
and lastly the manufacturing (5.5%, i.e. 11,596
persons) sub-sectors (Figure 6). Further, the real In addition, the number of self-employed workers
estate activities sub-sector experienced the highest in the narrow construction sub-sector accounted
growth in the number of persons employed during for 14.1% of the total self-employed persons in the
2010-2020, being 88.2%. This was followed by the general economy in 2020. This is considerably
architectural and engineering activities (+65.4%) above the EU-27 average of 11.7% and the 2010
and the narrow construction (+26.5%) sub-sectors level (12.8%). Further, self-employed workers in
between 2010 and 2020. Conversely, the real estate activities sub-sector accounted for
manufacturing sub-sector registered a decline of 0.8% of the total self-employed persons in the
8.9%, in terms of number of persons employed, general economy in 201827. This is on par with the
over the same reference period. 2010 level (0.8%) and slightly below the EU-27
average of 1.3%.
In the context of full-time employment in the
narrow construction, the real estate activities, and
the manufacturing sub-sectors increased by 51.8%,
42.5% and 26.2% respectively between 2010 and
2020. In contrast, part-time employment in the
manufacturing and the narrow construction
sub-sectors registered declines of 19.5% and 38.9%
respectively during the same reference period.
European Construction Sector Observatory 7Country Fact Sheet Ireland
2
Macroeconomic indicators
Economic development Unemployment rate in Ireland and the EU-27
in 2020
In 2020, the GDP stood at EUR 353.8 billion,
exhibiting a significant increment of 87.4%
compared to 2010 level, with a growth rate of
4.5% 6.3%
5.9% in 2020. It is forecast to grow at 14.6% in
2021, totalling EUR 405.3 billion28.
In 2020, the country’s economy expanded despite
the COVID-19 pandemic, mainly due to surging Ireland EU-27
exports which helped to counter a slump in
domestic demand29. The potential GDP in 2020 In terms of demography, the total population in
was EUR 349.4 billion, resulting in a negative Ireland amounted to 5.0 million people in 2020,
output gap of 0.8%. Further, the inflation rate in which is 9.3% higher than the 2010 level (4.6
Ireland stood at -0.5% in 2020 having been million people). This is expected to increase further
fluctuating since 2010. This is below the 2019 level by 10.8% between 2020 and 2030 and 12.9%
of 0.9%. Ireland’s inflation is forecast to stabilise in between 2030 and 2050. In 2020, the working age
2021 at around 2.3%30. population made up 65.3% of the total population
in Ireland, slightly above the EU-27 average of
Irish GDP over 2010-2020 (EUR billion) 64.3%. By 2050, the share of the working age
population will have decreased to 58.8%, while
people aged 65 or above will make up 24.7% of the
82.8%
overall population.
2010: 189.6 2020: 346.6 This shift in terms of population may imply an
increasing need for adequate care buildings and
Demography and employment infrastructures. This in turn may generate more
opportunities for the broad construction sector.
In 2020, the average Projected population evolution in Ireland
unemployment rate (between 25-
64 years) in Ireland stood at 4.5%,
below the EU-27 average of 6.3%
+10.8% +12.9%
and 8.0 pps below the 2010 levels.
Unemployment decreased continuously since 2012 2020 2030 2050
when it had reached the peak of 13.5%. Further,
youth unemployment (below age of 25) increased While net migration has been negative since 2010,
to 15.3% in 2020, as compared to 12.5% in the it turned positive in 2014 for the first time in a
previous year, after continuously decreasing since decade, reflecting in part the improved economic
2012 (30.8%), and below the EU-27 average of situation in the country and income convergence.
16.8%. However, in 2020, the net migration stood at
18,273, representing a 42.7% decline compared to
the previous year level of 31,870. Migration and
labour mobility to Ireland are among the factors
European Construction Sector Observatory 8Country Fact Sheet Ireland
that also contributed to fill labour and skill entrepreneurial activities, intended to start a
shortages. business in the coming three years. Moreover,
39.9% of adult population in Ireland consider
Public finance entrepreneurship as a ‘good career choice’33.
In 2020, general government expenditure in Overall, Ireland’s loans to non-financial
Ireland accounted for 28.4% of GDP, well below corporations declined by 63.1% over the
the EU-27 average of 53.4%. In the same year, 2010-2020 period, from EUR 101.1 billion in 2010
general government deficit accounted for -5.0% of to EUR 37.3 million in 2020. This situation affected
GDP, while the EU-27 average stood at -6.9%. also Irish SMEs, with outstanding credit extended
Further, general government gross debt amounted to them dropping by 59.3% between 2010 and
to 59.5% of GDP, considerably below the EU-27 2020, from EUR 47.5 billion to EUR 19.3 billion.
average of 90.7%.
Loans to non-financial
General government expenditure relative to
GDP
corporations between
2010 and 2020
63.1%
According to the Survey on the Access to Finance
of Enterprises (SAFE) Report 2021, 6.8% of SME
28.4% 53.4% respondents reported that access to finance is the
most important problem their firm is facing, below
the EU-27 average of 9.8%34.
Moreover, the combined challenges of COVID-19
Ireland EU-27 pandemic and Brexit are further exacerbating the
ongoing challenges faced by Irish SMEs in access to
Entrepreneurship and access to finance, mainly smaller/micro firms. According to
finance the Central Bank of Ireland’s SME Market Report
2020, over a third of Irish SMEs have unpaid
According to the World Bank Doing invoices, for an amount equal to about one fifth of
Business 2020 Report, Ireland ranked a typical firm’s 2019 revenue35.
23rd out of 190 countries in ease of The Irish government helps businesses access to
starting a business, with a score of finance through a number of measures. Such as:
94.431.
• The Microenterprise Loan Fund Scheme
As per the report, starting a business in Ireland offers support in the form of loans for up
requires three procedures, taking 11 days and to EUR 25,000, available to start-up, newly
costing 0.1% of per capita income. This is the OCED established, or growing microenterprises
high income countries average, requiring 4.9 employing less than 10 people.
procedures, taking 9.2 days and costing 3.0% of • the COVID-19 Credit Guarantee Scheme
per capita income. Moreover, the paid-in minimum facilitates up to EUR 2.0 billion in lending
capital required (i.e., the amount that the to eligible businesses that have been
entrepreneur needs to deposit in a bank or with a adversely impacted by the COVID-19
notary before registration and up to three months pandemic.
following incorporation) is almost 0.0% of per • the Brexit Loan Scheme, launched by the
capita income in Ireland, well below the OECD Strategic Banking Corporation of Ireland
high-income average (7.6% of income per capita)32. (SBCI) in 2018, provides loans ranging from
According to Global Entrepreneurship Monitor EUR 25,000 to EUR 1.5 million at a nominal
2020, 50.2% of the Irish adult population perceive interest rate of 4.0%, or even lower to
that there are good opportunities for starting a SMEs and small mid-cap firms.
firm in the country, and 14.6% of the adult • the Future Growth Loan Scheme provides
population, currently not involved in up to EUR 800.0 million of loans to eligible
European Construction Sector Observatory 9Country Fact Sheet Ireland
businesses in Ireland over 7-10 years to
Additionally, in terms of other measures, the
support strategic long-term investment.
country’s early stage tech investor National Digital
• the COVID-19 Working Capital Scheme Research Centre (NDRC) launched an accelerator
offers loans under the scheme ranging programme for tech start-ups. NDRC teamed up
from EUR 25,000 to EUR 1.5 million to with Enterprise Ireland for this programme, which
eligible Irish businesses that have been aims to prepare aspiring entrepreneurs, starting to
negatively impacted by the outbreak of succeed or become interested in
COVID-1936. entrepreneurships, to meet demands of both
Moreover, the ‘Seed and Venture Capital Scheme’ investors and the market. This is part of Enterprise
(2019-2024) was also introduced for start-ups to Ireland’s overall strategy to increase the number of
provide EUR 175.0 million in government funding quality start-ups in Ireland with a potential to
available to them as risk capital37. employ more than ten people and achieving EUR
1.0 million in export sales within three years of
In September 2020, the Seed and Venture
inception. Yet another step in this direction
Capital Scheme now has an additional funding
includes the introduction of the ‘Competitive Start
of EUR 10.0 million available to invest in Fund’, which provides critical early-stage funding
portfolio of companies impacted by the to start-ups and entrepreneurs to test the
COVID-19 pandemic38. feasibility of their products and services in the
marketplace. A maximum of EUR 50,000 in equity
funding can be received by successful applicants39.
European Construction Sector Observatory 10Country Fact Sheet Ireland
3
Key economic drivers of the
construction sector
Business confidence years, reaching its peak of 46.6% in 2019 – in line
with positive trends in terms of confidence
Though business confidence in Ireland has indicators. However, it decreased to 30.5% in
shown signs of improvement since 2010, when 2020.
compared to the 2019 level, all three indicators The investment per worker in the Irish broad
(namely consumer, construction and industry construction sector grew by 11.1% from
confidence) declined in 2020. This is mainly due EUR 60,775 in 2010 to EUR 67,523 in 201940.
to the impact of COVID-19 pandemic and
In terms of sub-sectors, investment per worker in
restrictive measures taken to control its spread.
the real estate activities sub-sector registered the
After dropping to -23.8 in 2010, the consumer highest increment of 527.3% between 2010 and
confidence indicator improved gradually, entering 201841, rising from EUR 2,200 to EUR 13,800. This
positive territory in 2015 (5.1) and again falling was followed by a 185.7% rise in the narrow
to -2.6 in 2019, after +8.9 in 2018. However, it construction sub-sector which grew to EUR 4,000
further reduced to -12.3 in 2020, which is however in 201842 from EUR 1,400 in 2010. Over the same
better than the EU-27 average of -14.6. The period, investment per worker in the architectural
construction confidence indicator, which reached and engineering activities sub-sector increased
a bottom low of -36.1 in 2010, improved to 31.9 in from EUR 2,600 to EUR 5,700, marking an increase
2018 and however decreased to -3.4 in 2020 of 119.2% overtime.
(against 21.2 in 2019). This again is well above the
Investment per worker
EU-27 average of -9.3 in 2020. Lastly, the industry
confidence indicator in 2020 stood at -2.8, lower
than the previous year level of 11.8 and the 2010
in the narrow
construction sub-sector 185.7%
between 2010 and 2018
level of 11.3. This is considerably above the EU-27
average of -14.4 in 2020.
Domestic sales
Construction confidence indicator (2020) The ranking of the five most domestically sold
construction products in Ireland has experienced
some changes in recent years. The top five most
domestically sold construction products, together,
accounted for 61.1% of all Irish domestic
-3.4 -9.3 construction product sales in 2020. ‘Ready-mixed
concrete’ and ‘Doors, windows and their frames’,
which belonged to the top five list, witnessed sales
growth of 84.8% and 63.4% respectively over the
Ireland EU-27 period 2010 and 2020. The product group ‘Barrels
and coopers’ products of wood’ saw the largest
The investment ratio, which stood at 16.9% in
increase in sales value, rising by 283.4% between
2010, witnessed a constant growth in the following
2010 and 2020. It grew from EUR 8.1 million in
European Construction Sector Observatory 11Country Fact Sheet Ireland
2010 to EUR 31.0 million in 2020. Notably, this value, rising by 380.1%, 140.3% and 108.9%
product group has a sales share of only 1.6% and respectively between 2010 and 2020. However,
does not belong to the top five most domestically the highest increase was recorded by ‘Cement
sold construction products in Ireland. The second clinkers’, which export grew from EUR 60.0 in 2010
highest growth in sales value was observed by to EUR 8.7 million in 2020, with an export share of
‘Prefabricated buildings of metal’ rising by 94.7% just 1.3% in total construction related exports in
with a share of 6.0% in the total sales. Table 1 2020. The top five most exported construction
presents the top five most domestically sold products from Ireland and the EU-27 are
construction products, both in Ireland and the summarised in Table 2.
EU-27.
Table 2: Five most exported construction products
Table 1: Five most domestically sold construction in Ireland and EU-27 in 2020
products in Ireland and in the EU-27 in 2020 Ireland EU-27
Ireland EU-27 Share in
Share in construction
Value
construction Product product Product
Value (EUR m)
Product product Product export sales
(EUR m) (%)
domestic
sales (%) Ceramic
Portland cement,
Other tiles and
Ready-mixed 1 aluminous
structures 189.3 27.4 flags
1 concrete cement, etc.
360.6 18.4 (group (group
(group 236310) (group 235112)
251123) 233110)
Other
Tiles, flagstones, Ready-mixed Fibreboard of structures
bricks and concrete wood or other and parts
2 similar articles, 255.9 13.0 2 ligneous 155.7 22.6 of
(group
etc. (group 236310) materials (group structures
236111) 162115) (group
Portland Doors, 251123)
cement, windows and Fibreboard
3 aluminous 226.2 11.5 their frames of wood or
(group Oriented strand other
cement, etc. 3 board (OSB)
(group 235112) 251210) 65.7 9.5 ligneous
(group 162113) materials
Prefabricate (group
Other structures d buildings 162115)
4 and parts of of metal
195.5 10.0 Doors,
structures, etc. (group Prefabricated windows
(group 251123) 251110)
4 structural and their
61.7 8.9
Prefabricate components frames
Doors, windows d structural (group 236112) (group
5 and their frames 160.9 8.2 components 251210)
(group 251210) (group Builders
236112) joinery and
Doors, windows
Source: PRODCOM, 2021. 5 carpentry,
and their frames 42.6 6.2
etc.
(group 251210)
(group
Export of construction-related 162319)
Source: PRODCOM, 2021.
products and services
In terms of the cross-border provision of
The ranking of the most exported products also construction services43, Ireland exported EUR 72.0
experienced fluctuations in recent years. The top million worldwide in 2020, with all of it going to
five most exported products together accounted the EU-27 countries. This represents a 33.3%
for 74.6% of the total construction exports in 2020. increase compared to the 201244 level (EUR 54.0
Product groups belonging to the top five list, such million exported worldwide). In parallel, the
as ‘Prefabricated structural components for country imported construction services worth
buildings etc.’, ‘Portland cement, aluminous EUR 372.0 million in 2020, all of it coming from the
cement etc.’, ‘Doors, windows and their frames EU-27 countries. Ireland, therefore recorded a
etc.’ experienced significant growth in their export trade deficit of EUR 300.0 million in 2020. This
European Construction Sector Observatory 12Country Fact Sheet Ireland
represents a substantial increase of 417.2% as extended for other construction activities also
compared to a trade deficit of EUR 58.0 million in decreased by 64.8%, from EUR 1.1 billion to
201245. EUR 382.0 million between 2010 and 2020.
Access to finance in the Total outstanding credit
to the narrow
construction sector construction sub-sector 79.6%
As per the Survey on the Access to Finance of between 2010 and 2020
Enterprises (SAFE) 2021 report, on average, 6.4% The Irish government provides financial support to
of the Irish respondent SMEs considered ‘access construction firms. In 2020, a total of EUR 285.0
to finance’ as the most important issue, slightly million of financing was approved for construction
below the EU-27 average of 7.1%46. firms by the State agency established to fund the
According to the report, bank loans are still the delivery of new homes, with EUR 49.0 million
main source of financing for 58.0% of SMEs in advanced to borrowers50.
Ireland, above the EU-27 average of 45.7%. As per the latest annual report of Home Building
Between the period of April to September 2021, Finance Ireland (HBFI), the financial assistance
13.9% of Irish SMEs applied for a bank loan, while provided to Irish construction firms helped to
2.7% did not, because of fear of rejection. Out of support the development of 1,307 homes across
those who applied for a bank loan, 59.0% received 21 developments in 202051.
everything, which is below the EU-27 average of
71.3%47. HBFI, established by the Irish Government in 2018
to address a shortfall in finance available for the
The EIB Investment Survey construction of residential housing by providing
for 2020 shows that 28.0% finance at market rates to commercially viable
of firms in the construction developments, has approved total funding of
sector are dissatisfied with EUR 395.0 million to support 1,850 homes since its
the cost of collateral and inception52.
25% of them with the
collateral requirements, in Access to housing
the context of access to
finance48. The number of households in Ireland continued to
increase steadily, reaching 1.9 million in 2020 from
The survey also suggests that the share of 1.7 million in 2010, thus marking an increment of
financially constrained firms stood at 16.0% in the 11.1% overtime. While in 2010, the share of
Irish construction sector. Moreover, availability of population living in densely populated area stood
finance is considered as a long-term barrier to at 33.1%, it rose to 35.8% in 201953. However, the
investment by 58.0% of the firms in the share of population living in intermediate
construction sector49. urbanised areas declined to 23.4% from 27.7%
Access to finance in the Irish construction sector is over the same period. Meanwhile, the mean
increasingly difficult, with the credit extended to equivalised net income experienced a 23.9%
the Irish construction firms declining significantly. increase between 2010 and 201954, reaching
This trend continued in 2020, with total EUR 29,684 from EUR 23,965. This is above the
outstanding credit extended to the narrow EU-27 average of 19,567.
construction sub-sector decreasing by 79.6% since
2010, from EUR 3.5 billion to EUR 708.0 million in
2020. In particular, outstanding credit extended for
the construction of buildings fell by 84.3% over the
2010-2020 period, from EUR 1.6 billion to
EUR 257.0 million. Likewise, outstanding credit to
companies for civil engineering activities fell by
90.8% over the same period, from EUR 748.0
million to EUR 69.0 million. Outstanding credit
European Construction Sector Observatory 13Country Fact Sheet Ireland
Figure 8: House price index in Ireland between
2010 and 2020 (2015=100)
29,684
23,695
19,567
Ireland 2010 Ireland 2019 EU-27 2019
Mean equivalised net income in EUR
Additionally, total outstanding residential loans to
households declined considerably by 20.8%, falling Source: Eurostat, 2021.
to EUR 81.6 billion in 201955 from EUR 103.0 billion According to an Ireland-based property website
in 2010. Furthermore, the interest rate on Daft.ie, during 2020, the average house price in
mortgages (for loans over five years of original
Ireland rose strongly by 7.4% to EUR 269,522,
maturity) declined slightly, reaching 2.5% in 2020,
mainly due to tight supply56.
compared to 2.8% in 2010 (Figure 7).
In the fourth quarter of 2020, the number of new
Figure 7: Mortgage rates for loans over 5 years
dwelling completions stood at 7,400. This is a
original maturity (%) between 2010 and 2020
15.9% increase as compared to the 6,387
completed in the fourth quarter of 2019. This
marks a recovery from the impact of the COVID-19
pandemic and associated restrictions which
particularly affected completions in the second
quarter and third quarter of 2020. Overall, the
total number of new dwelling completions in
2020 stood at 20,676, down by 1.9% from the
previous year level of 21,08757.
Source: Eurostat, 2021. In addition, housing rental price index is following
an increasing trend, growing by 30.1% between
Since 2015, the house price index of existing
2015 and 2020.
dwellings has been increasing gradually, rising by
34.4% between 2015 and 2020. However, it
Rental price index for
experienced a slight decline of 0.4 index points (ip)
between 2019 and 2020. Furthermore, house
housing between 2015
and 2020
30.1%
prices for new dwellings increased by 32.6%
between 2015 and 2020, with an increment of In parallel, the number of building permits for
2.8 ip between 2019 and 2020 (Figure 8). residential dwellings has increased significantly by
241.4% between 2015 and 2020. With regards to
House price index of
one-dwelling building permits, there was a 78.7%
existing dwellings
between 2015 and 2020
34.4% increase over the same period. Notably, the
biggest increment was seen in building permits for
two and more dwelling buildings, rising by 838.6%
between 2015 and 2020.
Number of building
permits for residential
dwellings between 241.4%
2015 and 2020
The housing shortage is exerting an upward
pressure on prices. Combined with the relatively
European Construction Sector Observatory 14Country Fact Sheet Ireland
slower increase in disposable incomes and Housing cost overburden rate in 2020
increasing housing and rental accommodation
prices, housing affordability issues are rising –
sometimes leading to homelessness58.
In fact, in August 2021, a total of 8,212 people
were recorded as homeless in Ireland, with 3.4% 9.9%
children accounting for more than a quarter
(2,189) of those without a home in the country.
The number of homeless adults stood at 6,02359.
Ireland EU-27
In July 2021, the number of homeless adults in
Ireland stood at 6,003. This marks an increase of Infrastructure
43.7% over the July 2015 level of 4,177 homeless
adults60. The increase in homelessness has According to the World
prompted warnings from homelessness charities, Economic Forum Global
which have expressed concern that Ireland’s Competitiveness Report 201969,
homeless crisis will only worsen in the months to Ireland ranks 40th out of 141
come amid rising rents and an increasing number countries in terms of
of evictions61. infrastructure70.
At the same time, the home ownership rate for the In particular, it performs well with respect to
population earning above 60% of the median efficiency of air transport services and seaport
equivalised income62 in Ireland decreased from services, ranking 26th and 30th out of 141
76.6% in 2010 to 72.7% in 2019. This is slightly economies, respectively. It ranked 31st in terms of
below the EU-27 average of 73.6%. However, it road connectivity and 32nd in railroad density. In
increased to 75.3% in 2020. Additionally, for the the context of airport connectivity, it stood at 33rd
population earning below 60% of the median position and 41st in efficiency of train services71.
equivalised income, the home ownership rate
reduced from 55.1% in 2010 to 41.9% in 2019, In 2018 the Irish government announced to invest
standing below the EU-27 average of 50.3%. It EUR 116.0 billion in infrastructure until 2027 (The
further reduced to 39.5% in 2020. National Development Plan). The plan’s priorities
include energy and climate change projects, as well
The housing cost overburden rate63 stood at 3.4% as housing, roads, and railway construction, and
in 2020, well below the EU-27 average of 9.9%64. water system improvements72.
The overcrowding rate65 was at 4.8% in 2020, one
of the lowest in the EU, and considerably below In October 2021, the Irish government announced
the EU-27 average of 17.8%66. Similarly, the severe the largest national development plan in the
housing deprivation rate67 was 1.1% in 2019, history of the state as it introduced spending
below the EU-27 average of 4.0%. It increased to proposals for the next decade (2021-2030). The
1.7% in 202068. plan includes a total investment of EUR 165.0
billion until 2030 on various capital projects such
as housing and transport infrastructure. The
investment will consist of extra money for
cross-border projects, with capital funding for the
government's Shared Island initiative to be "at
least doubled" to EUR 1.0 billion until 203073.
European Construction Sector Observatory 15Country Fact Sheet Ireland
4
Key issues and barriers in the
construction sector
Company failure during the period. This marks an increase of 15.0%
as compared to the previous year level of 27
Over the period 2010-201874, business insolvencies80.
demography in the broad construction sector has
witnessed some improvement, with the number of Trade credit
company births rising and company deaths falling
According to the Survey on the Access to
simultaneously. In fact, company births in the
Finance of Enterprises (SAFE) 2021 report, trade
narrow construction sub-sector grew by 85.0%
credit constitutes a relevant source of financing
from 1,818 in 2010 to 3,364 in 201875. Similarly,
for 64.8% of Irish SMEs, double the EU-27
company births in the real estate activities and
average of 27.8%81.
architectural and engineering activities sub-sectors
increased by 22.4% and 51.3% respectively, As per the report, around 44.9% of SMEs have
reaching 841 and 507 in 201876. obtained trade credit from their business partners
in the last six months (April - September 2021),
Company births in the well above the EU-27 average (13.7%) for the same
narrow construction
sub-sector grew between 85.0% reference period. Further, 31.8% of the SME
respondents have applied for trade credit in the
2010 and 2018 last six months, while the EU-27 average stands at
Conversely, the number of company deaths in the only 29.6%. Out of the 31.8% of SMEs who applied
narrow construction sub-sector declined by 91.3%, for trade credit in the last six months, 72.4% SMEs
from 4,508 in 2010 to 387 in 201877. Similarly, received everything they applied for. This is above
company deaths in the real estate activities and the EU-27 average of 71.6%. Also, 75.7% of the
the architectural and engineering activities SME respondents consider that the availability of
sub-sectors decreased by 89.6% and 82.8% trade credit has remained unchanged over the past
respectively, reaching 94 and 108 in 201878. six months, and 72.0% expect that it will remain
unchanged in the six months following the
Company deaths in the survey82.
narrow construction
sub-sector grew 91.3% Share of companies using the trade credit in
between 2010 and 2018 2021
(in the first six months)
In the first half of 2021, a total of 169 corporate
insolvencies were recorded in Ireland, according 44.9% 13.7%
to the latest corporate insolvency statistics
report79.
In particular, the Irish construction sector recorded
31 insolvencies during the first of 2021, Ireland EU-27
representing 18.0% of total insolvencies recorded
European Construction Sector Observatory 16Country Fact Sheet Ireland
According to the Atradius Payment Practices As per the SAFE 2021 report, around 7.8% of
Barometer 2020, the proportion of total B2B SMEs reported facing late payment issues on a
(business-to-business) sales made on credit in regular basis, below the EU-27 average
Ireland stood at 58.0% in 2020, above the western (11.8%)92.
European average of 55.0%. 38.0% of the
As per the report, 35.8% of SMEs reported that
businesses surveyed reported an average one
their payments to suppliers have been affected as
quarter increase in the total value of their credit
a result of late payments by customers. For 19.6%
sales compared to before the COVID-19 pandemic,
of Irish SMEs, late payment affected production or
while 55.0% of the businesses reported no change.
operations, and for 16.7% it impacted investments
Also, 61.0% of businesses surveyed reported to
or new hiring. 17.3% of SMEs also reported that
accept trade credit requests from businesses of all
their loans repayments have been delayed, or they
sizes to encourage sales on the domestic market
have had to seek additional financing, as a result of
(regional average: 53.0%)83.
late payments93.
Late payment As per the Atradius Payment Practices Barometer
survey report, published in November 2020, the
According to the European total value of overdue invoices increased from
Payment Report 2021, about 29.0% to 51.0% due to the onset of COVID-19
36.0% of Irish respondent pandemic, marking a 76.0% year-on-year (Y-o-Y)
firms say late payments to increase94.
have a high impact and
As per the report, to turn overdue invoices into
prohibits growth, below the
cash, 48.0% of respondents having to wait up to 18
EU average of 37.0%84.
days longer than last year. On average 10.0% of the
As per the report, 59.0% of Irish businesses believe total value of receivables was written off as
that growing macroeconomic uncertainty has uncollectable after the onset of the pandemic,
caused them to extend their payment terms to above the Western Europe average of 7.0%.
suppliers in 2020 as compared to the EU-2885 Moreover, the increase in late payments is also
average of 57.0%. On average, a visible in the lengthening of DSO (Daily Sales
business-to-business (B2B) customer in Ireland is Outstanding). Around 52.0% of the businesses
allowed 41 days to pay dues, at par with the respondents reported DSO increases of up to
EU-2886 average of 41 days. However, on average a 10.0% (regional average: 57%)95.
B2B customer took 54 days to pay dues in 2021,
Furthermore, to limit liquidity shortages caused by
down of 15 days with respect to 202087.
late payments, 45.0% of Irish respondents
Further, 64.0% of Irish companies are more increased the amount of time, costs and resources
concerned than ever before about debtors’ ability they spent on managing outstanding receivables
to pay on time, with 62.0% of companies expecting (regional average: 37.0%). While 33% delayed
an increase in the risk of non-payment from paying their suppliers (regional average: 33.0%)96.
debtors in the next 12 months88.
As per the Atradius Payment Practices Barometer
Additionally, 49.0% of the respondents expect survey report, 51.0% of the total value of B2B
debtors’ liquidity challenge due to the impact of invoices in Ireland’s construction were impacted
COVID-19 affecting late payments. This is above by the late payments. This is well above the
the EU-2889 average of 48.0%. At the same time, previous year level of 24.0%97.
42.0% of respondents in Ireland ranked “Risk of a
With the onset of the COVID-19 pandemic, the
pan-European recession” as one of the main
situation has become quite difficult. According to
payment challenges in terms of their customers
the European Payment Report 2021, 64.0% (nearly
paying on time and in full over the next 12 months.
two-thirds) of the Irish SME respondents are
This is above the EU-2890 average of 40.0%91.
concerned about their debtors’ ability to pay them
on time. Moreover, around 20.0% of the
respondents) believe that an uncertain trading
European Construction Sector Observatory 17Country Fact Sheet Ireland
environment is a major challenge to customer Skills shortage
payments98.
The number of job vacancies in the
Time and cost of obtaining building narrow construction105 sub-sector
permits and licenses experienced an increase of 80.0%,
rising from 125 in 2010 to 225 in
As per the 2020 World Bank’s Doing Business
2020. However, it declined by
Report99, Ireland ranked 36th out of 190 economies
65.4% in 2020 over the previous
in terms of ‘dealing with construction permits’, a
year level of 650.
decline from 28th position the previous year100. In
2019, 10 procedures and 164 days were required While the job vacancy rate in the narrow
to complete administrative formalities to build a construction sub-sector witnessed a slight increase
warehouse101 in Ireland (Table 3). While the of 0.02 pps between 2010 and 2020, standing at
number of procedures is below the OECD 0.2% in 2020. However, in the real estate activities
high-income average of 12.7, the number of days is sub-sector, the job vacancy rate declined by 0.3
higher (164 against 152.3 days for the OECD high pps during the same reference period, from 0.5%
income average). In addition, the cost of obtaining to 0.2%.
a building permit for a warehouse represented
The number of tertiary students in engineering,
4.1% of the value of the warehouse in Ireland,
manufacturing and construction increased by
considerably higher than the OECD high-income
16.7% between 2010 and 2019106, reaching 8,262
average of 1.5%102.
from 7,079. The number of tertiary students
Table 3: Construction procedures timing and costs increased considerably in the engineering and
in Ireland engineering trades, as well as manufacturing and
processing, witnessing increases of 83.4% and
Procedure Time to Associated
complete costs
76.6%, respectively, over the same period. On the
contrary, tertiary students in architecture and
Publish notice of
construction in approved 1 day EUR 150 building declined by 33.0% between 2010 and
newspaper 2019107.
Obtain an ordinance survey
map
0.5 day EUR 77 Moreover, adult participation in education and
training108 in the narrow construction sub-sector
Hold a pre-planning meeting
with the Planning 21 days No charge grew from 8.0% in 2010 to 15.0% in 2020.
Department
Request and obtain planning
Adult participation in education and training
90 days EUR 102,357 in the narrow construction sub-sector
permission103
Request and obtain fire
safety and disability access 90 days EUR 4,272
certificates
Submit a commencement 8.0% 15.0%
0.5 day EUR 30
notice
Request water and sewage
1 day EUR 490
connection
Receive inspection for 2010 2020
feasibility of the connections 7 days no charge
and obtain connection offer
no charge
As per the EIB Investment Survey 2020 report,
Obtain water and sewage
Irish Water to 81.0% of firms in the construction sector
21 days decide on reported availability of skilled staff as a long-
connection
case by case
basis term barrier to investment109.
Submit the Certificate of
Compliance on Completion 21 days no charge The expansion of the construction sector is
and obtain approval predicted to require an additional 40,000 to
Source: Doing Business overview for Ireland, Word Bank, 50,000 new construction workers until 2027110.
2020104.
European Construction Sector Observatory 18Country Fact Sheet Ireland
With 17.0% of SMEs reporting a shortage of skilled construction activities alone generated a total
staff and experienced managers as their biggest waste of 1,903,058 tonnes in Ireland. This was
problem in 2019, Skillnet might help address this 18.2% higher than the waste generated in 2010,
deficit in SMEs. Funded by the National Training 1,609,762 tonnes117.
Fund, Skillnet is the national business support
In 2018118, approximately 6.2 million tonnes of
agency that promotes and facilitates workforce
CDW were collected in Ireland for treatment,
learning. Though there are 69 Skillnet Training
significantly above 4.7 million tonnes in 2017119.
Networks that are both sectoral and regionally
based, its reach still seems to be limited111. Moreover, Ireland achieved 77.0% material
recovery of non-hazardous, non-soil-and-stone
As the construction sector continues to grow
CDW in 2018, surpassing the EU target of 70.0% by
strongly, construction firms in Ireland are
2020120.
increasingly resorting to hiring construction
professionals from outside the country and even Climate and energy
beyond the European region112.
Emissions of greenhouse gases (carbon monoxide
Sector and sub-sector specific and dioxide, methane, and nitrous oxides) from the
narrow construction and the real estate activities
issues sub-sectors amounted to 484,750.1 tonnes and
29,317.0 tonnes in 2019121, respectively. While the
Material efficiency and waste management
former increased by 35.3% since 2010, the latter
Owing to the rise in economic activity, specifically witnessed a decline of 17.8% over the same period.
in construction, waste generated by the
construction sector has increased over recent Emissions in narrow
construction sub-sector
years. CDW mainly consists of several materials,
including concrete, bricks, gypsum, wood, glass, between 2010 and 35.3%
metals, plastic, solvents, asbestos and excavated 2019
soil, many of which can be recycled113. The bulk of Ireland uses the Dwelling Energy Assessment
CDW is made up for 81.0% of waste soil and Procedure (DEAP), as its official procedure for
stones, with the remainder segregated wastes such calculating and assessing the energy required for
as rubble, concrete, bricks, glass, plastic, wood, space heating, ventilation, water heating and
metals and mixed CDW. lighting, less savings from energy generation
Since close to zero CDW was recycled in Ireland, technologies. The DEAP is used to generate the
the Environmental Protection Agency issued its energy performance certificates122. It is based on
first licence in January 2020 to process large the UK Standard Assessment Procedure and is
volumes of CDW. The licence allowed the compliant with the EU Directive 2010/31/EU. DEAP
processing of these materials to produce a was first introduced in 2006 and has gone through
reusable material known as “greenrock”, which will a number of updates so that it can meet
be used in the construction of a new road on an regulatory, consumer and industry needs123.
EPA-licensed site in Ireland114,115. In 2018116,
European Construction Sector Observatory 19You can also read