European Construction Sector Observatory - Country profile Belgium November 2021
←
→
Page content transcription
If your browser does not render page correctly, please read the page content below

hh

     European Construction
        Sector Observatory
                Country profile Belgium
                             November 2021

            1
Country Fact Sheet Belgium

                                       In a nutshell
 Over the 2010-2020 period, the Belgian GDP               Turnover in the narrow
 increased by 6.6%, totalling EUR 416.4 billion in
 2020. However, in 2020 it recorded a 6.3%
                                                          construction sub-sector
                                                          between 2010 and 2020
                                                                                                23.6%
 decline compared to the 2019 level.                     The gross operating rate of the Belgian broad
In line with the economy, the number of enterprises      construction sector, an indicator of the sector’s
in the broad construction sector increased by 25.1%      profitability, stood at 15.4% in 20181, slightly above
between 2010 and 2019, reaching 192,068 in 2019.         the 2010 level of 14.5%. The real estate activities
In 2020, it decreased by 3.5% as compared to the         remained the most profitable sub-sector (39.9%),
2019 level, amounting to 185,340. Thus, over the         followed by the architectural and engineering
2010-2020 period, the number on enterprises              activities (17.7%), the manufacturing (12.3%) and
increased by 20.7%. Compared to 2019 level, the          the narrow construction (10.8%) sub-sectors in
most significant declines were reported by the           20182.
manufacturing sub-sector (-7.9%), followed by the        With regards to employment, 524,453 persons were
narrow construction sub-sector (-6.2%) in 2020.          employed in 2019, representing an increase of
 Number of enterprises in                                16.0% as compared to 2010 level. In contrast, this
 the broad construction                                  decreased to 501,390 persons in 2020, indicating an
 sector between 2010                  20.7%              annual decline of 4.4% in 2020. Overall, the total
 and 2020                                                number of persons employed increased by 10.9%
                                                         between 2010 and 2020. Compared to 2019, the
The volume index of production in the broad              most significant declines were reported in the
construction sector increased by 2.8% between            manufacturing (-7.6%) sub-sector, followed by the
2015 and 2019 before declining by 8.2% in 2020.          narrow construction (-5.9%) sub-sector in 2020.
This decrease is mainly due to a 9.0% decline in the
production of construction of buildings and a 6.2%        Employment in the broad
decrease in the production of construction of civil
engineering in 2020 as compared to 2019 level.
                                                          construction sector
                                                          between 2010 and 2020
                                                                                                 10.9%
Total turnover in the Belgian broad construction         The Belgian government – including through the
sector increased to EUR 103.5 billion in 2018 and        regional governments, launched numerous
reached EUR 103.8 billion in 2020. This represented      initiatives to promote the broad construction
an overall increment of 25.2% since 2010 and was         sector, by supporting e.g. the development of the
primarily driven by growth in three sub-sectors – the    housing market. For instance, in Brussels, under the
real estate activities (+72.5%), the architectural and   Regional Housing Plan and the Habitat Alliance, the
engineering activities (+25.0%) and the narrow           government is leading the sustainable renovation of
construction (+23.6%) sub-sectors over the 2010-         existing housing stock in addition to the
2020 period.                                             construction of 6,400 new housing units. Private
                                                         sector actors are also active in this field. In February
                                                         2021, institutional asset managers Bouwinvest Real
  European Construction Sector Observatory                                                                    2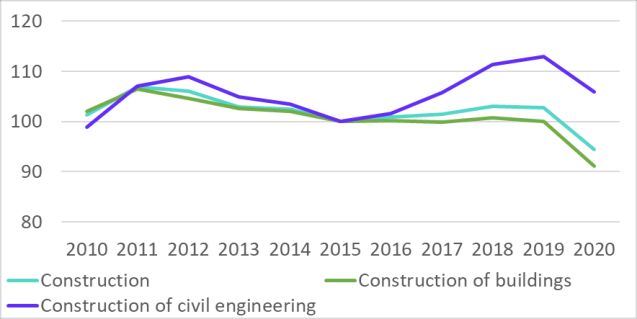
Country Fact Sheet Belgium

Estate Investors and CBRE Global Investment                Under its Recovery and Resilience Plan (RRP),
Partners (GIP) teamed up with ION, a Belgian real          Belgium will invest EUR 1,012.0 million of the
estate developer, to invest EUR 280.0 million in           total allocation in the renovation of its building
affordable housing. As per their agreement, the            stock4.
amount will be invested in building 1,000 affordable
                                                         This includes EUR 264.0 million for improving
new houses and apartments exclusively for the
                                                         renovation subsidy schemes as well as EUR 98.4
rental market.
                                                         million on social housing renovation in the Flemish
With regards to the civil engineering market, the        and Brussels-Capital regions and the German-
Belgian government has initiated various projects        speaking Community. Around EUR 636.3 million has
such as the construction of a regional express           been allotted to renovation in the public sector
network (RER) around Brussels, a second rail access      including schools (EUR 230.8 million), universities,
to the port of Antwerp and additional tracks             sports, and cultural facilities (EUR 210.3 million),
between Ghent and Bruges, as well as Bruges and          and other public buildings (EUR 195.2 million)5.
Zeebrugge. The federal rail investment strategy is
                                                         In fact, the RRP dedicates 56% of its budget for
set out in the Multiannual Strategic Investment Plan
                                                         infrastructure projects such as the renovation of
2018-2031, amounting EUR 1.2 billion. Through
                                                         buildings, including schools, the construction of new
these projects, the government plans to promote
                                                         generation CO2 capture and hydrogen transport
and support a gradual shift in modes of transit from
                                                         energy networks, the renovation and construction
roads to railways.
                                                         of transport infrastructure (mainly bicycles and
                                                         railways) or digital infrastructure (5G, optical fibres)
 Belgian railways are set to receive an additional
                                                         etc.
 EUR 250.0 million over the next three years3, as
 per the 2021 national budget. Most of this              In addition, the regional and federal governments
 amount will be invested in infrastructure, to           have decided on additional stimulus measures and
 further develop rail freight transport.                 investments from their own budgets.
                                                         Despite these initiatives, the Belgian broad
At the regional level, the government of the
                                                         construction sector faces two major challenges.
Brussels-Capital Region has extended the
                                                         Firstly, the construction sector continues to suffer
Multiannual Investment Plan for Public Transport
                                                         from the on-going shortage of skilled workers,
until 2028, involving investment of more than
                                                         along with a skills mismatch for existing roles.
EUR 6.0 billion for the three main transportation
                                                         Secondly, late payments continue to be a major
modes: metro, tram and bus. The Flanders region is
                                                         concern, which has further deteriorated due to the
also adopting an integrated investment programme
                                                         outbreak of COVID-19 pandemic.
called "Geïntegreerd Investeringsprogramma"
(GIP), involving a total investment of EUR 1.9 billion     Overall, the Belgian construction sector has a
in mobility and public works.                              positive outlook. The civil engineering markets
                                                           are expected to be the primary growth drivers.
                                                           Additionally, investment in public sector
                                                           infrastructure, digitalisation as well as a circular
                                                           and green economy, backed by EU funding, is
                                                           expected to lead the future growth of the sector.

 European Construction Sector Observatory                                                                         3
Country Fact Sheet Belgium

                                               Table of Contents
In a nutshell ............................................................................................................................................. 2
1 Key figures ............................................................................................................................................ 5
   Construction market.........................................................................................................................................5
   Productivity ......................................................................................................................................................6
   Turnover and profitability ................................................................................................................................6
   Employment .....................................................................................................................................................7
2 Macroeconomic indicators .................................................................................................................... 9
   Economic development ....................................................................................................................................9
   Demography and employment.........................................................................................................................9
   Public finance ...................................................................................................................................................9
   Entrepreneurship and access to finance ....................................................................................................... 10
3 Key economic drivers of the construction sector .................................................................................. 11
   Business confidence ...................................................................................................................................... 11
   Domestic sales ............................................................................................................................................... 11
   Export of construction-related products and services .................................................................................. 12
   Access to finance in the construction sector................................................................................................. 13
   Access to housing .......................................................................................................................................... 13
   Infrastructure................................................................................................................................................. 14
4 Key issues and barriers in the construction sector ................................................................................ 15
   Company failure ............................................................................................................................................ 15
   Trade credit ................................................................................................................................................... 15
   Late payment ................................................................................................................................................. 16
   Time and cost of obtaining building permits and licenses ............................................................................ 17
   Skills shortage ................................................................................................................................................ 17
   Sector and sub-sector specific issues ............................................................................................................ 18
5 Innovation in the construction sector................................................................................................... 19
   Innovation performance................................................................................................................................ 19
   Eco-innovation and digitalisation .................................................................................................................. 19
6 National and regional regulatory framework........................................................................................ 22
   Policy schemes............................................................................................................................................... 22
   Building regulations ....................................................................................................................................... 23
   Insurance and liability related regulations .................................................................................................... 24
7 Current status and national strategies to meet Construction 2020 objectives ........................................ 25
   TO 1 – Investment conditions and volumes .................................................................................................. 25
   TO 2 – Skills .................................................................................................................................................... 27
   TO 3 – Resource efficiency / Sustainable construction ................................................................................. 28
   TO 4 – Single Market ..................................................................................................................................... 30
   TO 5 – International competitiveness ........................................................................................................... 30
8 Outlook............................................................................................................................................... 32

 European Construction Sector Observatory                                                                                                                         4
Country Fact Sheet Belgium
1
Key figures
Construction market The volume index of production in the broad
construction sector decreased by 5.6% over the
The number of enterprises in the broad 2015-2020 period, primarily due to an 8.9% drop in
construction sector in Belgium totalled 185,340 in the production of construction of buildings
20206 (Figure 1), with the narrow construction offsetting the 5.9% increase in the production of
sub-sector accounting for 56.9% of total construction of civil engineering over the same
enterprises, followed by the real estate activities reference period.
sub-sector (26.3%). Overall, the number of
Figure 2: Volume index of production in the Belgian
enterprises in the broad construction sector
construction sector over 2010-2020 (2015=100)
increased by 20.7% over the 2010-2020 period,
mostly driven by growth in the real estate activities
sub-sector (+44.1%), followed by the architectural
and engineering activities sub-sector (+17.7%) as
well as the narrow construction
sub-sector (+14.4%). The number of companies in
the manufacturing sub-sector dropped marginally
by 6.5% over the same reference period. Looking
more specifically at the 2019-2020 period, the
number of enterprises in the broad construction Source: Eurostat, 2021.
sector proved to be affected by the COVID-19 The total value added at factor cost7 of the broad
pandemic, decreasing by 3.5%. Compared to 2019 construction sector amounted to EUR 32.2 billion in
level, the most significant declines were reported by 20208, representing a 26.8% increase compared to
the manufacturing sub-sector (-7.9%), followed by
the 2010 level of EUR 25.4 billion. The narrow
the narrow construction sub-sector (-6.2%) in 2020.
construction sub-sector was the main contributor,
Number of enterprises in with a 57.0% share of the total9 (EUR 18.4 billion),
the narrow construction followed by the real estate activities (EUR 7.1
sub-sector between 14.4% billion, i.e. 22.1% of the total), the manufacturing
2010 and 2020 (EUR 3.7 billion, i.e. 11.3% of the total) and the
architectural and engineering activities
Figure 1: Number of enterprises in the Belgian
(EUR 3.1 billion, 9.5% of the total) sub-sectors.
broad construction sector between 2010 and 2020
Total value added of the
broad construction sector
between 2010 and 2020
26.8%
The share of gross value added of the narrow
construction and the real estate activities
sub-sectors in GDP amounted to 4.9% and 9.0% in
2020, as compared to 4.9% and 7.5% in 2010,
respectively (Figure 3).
Source: Eurostat, 2021.
European Construction Sector Observatory 5Country Fact Sheet Belgium
Figure 3: Gross value added as a share of GDP in the Figure 4: Labour productivity in the Belgian broad
Belgian broad construction sector in 202010 (%) construction sector over 2010-2020 (EUR k)
Source: Eurostat, 2021. Source: Eurostat, 2021.
Belgium is statistically divided into eleven NUTS-2 Turnover and profitability
regions with Prov. Antwerp, Prov. Oost-Vlaanderen
and Prov. West-Vlaanderen together accounting for Total turnover of the Belgian broad construction
52.4% of the total gross regional value added in the stood at EUR 103.5 billion in 201815, representing an
narrow construction sub-sector in 2019. Likewise, increase of 24.8% compared to 2010
Brussels Hoofdstedelijk Gewest, Prov. Antwerp and (EUR 82.9 billion). It marginally increased to
Prov. Oost-Vlaanderen together made up 43.7% of EUR 103.8 billion in 202016, registering a 25.2%
the total gross regional value added in the real increase compared to 2010. This growth was
estate activities sub-sector in 201911. primarily driven by a 72.5% increase in the real
estate activities sub-sector over the 2010-2020
Productivity period. This was followed by the architectural and
engineering activities and the narrow construction
Overall, the apparent labour productivity12 in the
sub-sectors, registering increments of 25.0% and
Belgian broad construction sector increased from
23.6%, respectively, over the same reference
EUR 56,123 in 201013 to EUR 64,064 in 201814
period. In contrast, the manufacturing sub-sector
(+14.1%), well above the EU-27 average of
reported a decline of 2.2% over the 2010-2020
EUR 51,960. This increase is reflected across most
period. In 2020, 66.7% of the total turnover was
of the construction sub-sectors. The largest
generated by the narrow construction sub-sector,
increments were witnessed in the manufacturing
followed by the real estate activities (14.4%), the
sub-sector (+23.8%) and narrow construction
manufacturing (11.0%) and the architectural and
sub-sector (+17.4%), growing from EUR 65,249 and
engineering activities (7.9%) sub-sectors.
EUR 48,800 in 2010 to EUR 80,758 and EUR 57,272
in 2020, respectively. The architectural and Turnover in the narrow
engineering activities sub-sector reported a
marginal increase of 1.6%, amounting to
construction sub-sector
between 2010 and 2020
23.6%
EUR 58,106 in 2020. In contrast, the real estate
The gross operating surplus of the broad
activities sub-sector witnessed a decline of 4.0%
construction sector amounted to EUR 16.0 billion in
from EUR 89,300 in 2010 to EUR 85,720 in 2020.
201817, a 32.7% increase compared to 2010. In
Productivity in the terms of sub-sectors, the largest increase was
narrow construction reported by the real estate activities (+42.4%),
sub-sector between 17.4% followed by the manufacturing (+32.3%) and the
2010 and 2020 narrow construction (+28.7%) sub-sectors over the
2010-2018 period. Similarly, the architectural and
engineering activities sub-sector increased by
20.9% over the same reference period.
European Construction Sector Observatory 6Country Fact Sheet Belgium
Gross operating surplus Figure 6: Percentage of people employed per
of the narrow construction sub-sectors in Belgium in 2020
construction sub-sector 28.7%
between 2010 and 2018
The gross operating rate18 of the Belgian broad
construction sector19, which is an indicator of the
sector’s profitability, stood at 15.4% in 201820,
slightly above its 2010 level of 14.5% and below the
EU-27 average of 16.7%. In terms of sub-sectors, the
real estate activities sub-sector remained the most
profitable, with a gross operating rate of 39.9%,
Source: Eurostat, 2021.
slightly below its 2010 rate of 44.9%. Similarly, the
architectural and engineering activities sub-sector Employment in the real estate activities sub-sector
registered a gross operating rate of 17.7%, lower increased by 61.7% over the 2010-202023 period,
than its 2010 level of 18.2%. Likewise, the followed by the architectural and engineering
manufacturing and the narrow construction activities (+18.9%) and the narrow construction
sub-sectors reported gross operating rates of 12.3% (+5.3%) sub-sectors, respectively. In contrast, the
and 10.8% in 201821, slightly above their 2010 levels manufacturing sub-sector reported a decrease of
of 9.8% and 10.4%, respectively. 13.4% over the same reference period.
The construction cost index has been on an Employment in the real
increasing trend since 2010. In fact, over the estate activities
2015-2019 period, the construction cost index sub-sector between 2010 61.7%
increased by 8.1% (Figure 5). and 2020
Figure 5: Construction cost index between 2010 and In terms of employment by specific occupation, the
2019 (2015=100) biggest drop in the narrow construction sub-sector
between 2010 and 2020 was registered for
elementary occupations (-42.9%), followed by
managers (-23.8%). In contrast, clerical support
workers recorded the largest increase of 26.4%,
followed by professionals (+14.8%) over the same
reference period. With regards to the real estate
activities sub-sector, the largest increment was in
technicians and associate professionals (+181.3%),
followed by professionals (+56.5%). On the other
Source: Eurostat, 2021. hand, the demand for managers decreased by 9.4%
over the 2010-2020 period. Lastly, in the case of the
Employment manufacturing sub-sector, service and sales
In 202022, there were 501,390 persons employed in workers reported the largest increase of 56.6% over
the Belgian broad construction sector, representing the 2010-2020 period. In contrast, the number of
an increase of 10.9% since 2010 (452,285 persons). persons employed in elementary occupations
Most of these persons were employed in the declined by 50.8% over the same reference period.
narrow construction sub-sector (63.9%). The real The share of self-employed persons in the general
estate activities, the architectural and engineering economy working in the narrow construction
activities and the manufacturing sub-sectors sub-sector increased from 14.3% in 2010 to 14.9%
accounted for 16.5% (82,829 persons), 10.5% in 2020, slightly above the EU-27 average of 11.7%.
(52,770 persons) and 9.0% (45,376 persons) of the In the real estate activities sub-sector, the share of
total employed in the broad sector in 2020, self-employed workers stood at 1.9% in 2019,
respectively (Figure 6). marginally above its 2010 level (1.2%) as well as the
EU-27 average of 1.6%.
European Construction Sector Observatory 7Country Fact Sheet Belgium
In parallel, full-time employment recorded a of 10.6% in the number of persons employed in the
decrease in both the narrow construction (-1.7%) narrow construction sector over the 2010-201824
and the real estate activities (-10.9%) sub-sectors. period. Prov. Luxembourg (BE) reported the largest
In contrast, part-time employment registered an growth in the number of people employed in the
increase in both the narrow construction (+13.6%) real estate activities (+66.7%) sub-sector for the
and the real estate activities (+0.9%) sub-sectors above referred to period. Overall, in 2018, Prov.
over the 2010-2020 period. Antwerp, Prov. Oost-Vlaanderen and Prov.
West-Vlaanderen together accounted for 46.7% of
Part-time employment in
the total number of persons employed in the
the narrow construction
sub-sector between 2010 13.6% narrow construction sub-sector. Similarly, Brussels
Hoofdstedelijk Gewest, Prov. Antwerp as well as
and 2020
Prov. West-Vlaanderen made up 50.2% of the total
In terms of regional trends, the Brussels number of persons employed in the real estate
Hoofdstedelijk Gewest region registered an increase activities sub-sector in 2018.
European Construction Sector Observatory 8Country Fact Sheet Belgium
2
Macroeconomic indicators
Economic development In 2020, the working age population made up
64.0% of the total Belgian population, marginally
In 2020, Belgian GDP amounted below the EU-27 average of 64.3%. By 2050, it is
to EUR 416.4 billion, expected to decrease to 58.7%, slightly above the
representing an increase of EU-27 average of 56.8%. In parallel, the proportion
6.6% compared to the 2010 of elderly people (over 65 years old) is expected to
level. That said, the country’s increase from 19.2% in 2020 to 26.3% in 2050. This
GDP decreased by 6.3% is still lower than the projected EU-27 average of
compared to 2019 levels, 29.5% in 2050. In line with the elderly population
following the advent of the growth, the demand for elderly persons’
COVID-19 pandemic. infrastructures (hospitals, care homes, access
infrastructure) will also continue to rise gradually in
In 2020, Belgian potential GDP amounted to the medium and long-term, providing potential
EUR 444.4 billion, resulting in a negative output gap opportunities for the construction sector.
of 6.3%. In parallel, the inflation rate has been
increasing over the 2015-2019 period, reaching Unemployment rate in Belgium in 2010
7.8% in 2019. This further increased by 0.4 and 2020
percentage point in 2020, reaching 8.2% in 2020.
Demography and employment
The Belgian unemployment rate decreased from 7.0% 4.8%
7.0% in 2010 to 4.6% in 2019, reaching its lowest
level. It increased to 4.8% in 2020 primarily due
to COVID-19 pandemic, nevertheless remaining
slightly below the EU-27 average of 6.3% in 2010 2020
202025.
Similarly, youth unemployment (below the age of
Public finance
25) decreased from 22.4% in 2010 to 15.3% in 2020. In 2020, general government expenditure
This is also slightly below the EU-27 average of represented 60.0% of GDP, slightly higher than the
16.8%26. 2010 levels (53.9%) and the EU-27 average of
53.4%. The general government deficit amounted
In 2020, the total population of Belgium amounted
to 9.4% of GDP in 2020, higher than the EU-27
to 11.5 million. This is projected to further increase
average of 6.9%. Lastly, general government gross
by 2.2% to 11.8 million in 2030 and by 3.6% to 11.9
debt amounted to 114.1% of total GDP compared
million in 2050, respectively. This trend is supported
to the EU-27 average of 90.7%. Since 2019,
by the positive net migration rate, totalling 56,147
Belgium’s fiscal deficit has deteriorated primarily
in 2020.
due to a decrease in government revenue followed
by an increase in its fiscal expenditure and the
advent of COVID-19 pandemic27.
European Construction Sector Observatory 9Country Fact Sheet Belgium
Entrepreneurship and access to During the 2018-2019 period, some significant
measures were implemented by the government to
finance boost access to finance and entrepreneurship
within the country33:
As per World Bank Doing Business
2020 report, Belgium ranked 48th out • Cofinancing+, launched by PMV/z
of 190 countries in terms of ease of (Participatiemaatschappij Vlaanderen voor
starting a business with a score of zelfstandige ondernemers) in November
92.3. This is slightly below compared 2018, aimed at providing co-financing to
to its 2019’s 45th rank28,29,30. existing companies of up to four times their
own capital, with a minimum of
As per the report, starting a business in Belgium EUR 350,000 and a maximum of
requires five procedures, taking five days and EUR 700,000,
costing 5.3% of per capita income. In contrast, OECD • a new grant agreement with non-profit
high-income averages stood at 4.9 procedures, 9.2 organisation “BAN Vlaanderen” in January
days and 3.0% of per capita income, respectively. 2019, connecting SMEs with individuals
The paid-in minimum capital required (i.e., the looking to invest their personal capital,
amount that the entrepreneur needs to deposit in a thereby acting as a marketplace for
bank or with a notary before registration and up to companies and potential investors,
three months following incorporation), stood at • reduced social security contributions for
0.0% of per capita income, below the OECD high- start-ups from April 2018 onwards (during
income average of 7.6% of income per capita31. their first year), aimed at reducing the social
Belgium’s loans to non-financial corporations burden on self-employed people.
increased by 26.4% over the 2010-2020 period, Belgium also introduced several initiatives in 2020
from EUR 100.1 trillion in 2010 to EUR 126.5 trillion to promote entrepreneurship and increase the
in 2020. number of mentors in entrepreneurship.
Loans to non-financial Region-wise, Flanders is investing EUR 90.0 million
corporations between
2010 and 2020
26.4% in promoting entrepreneurship and innovation via
specific intermediaries. These selected
intermediaries will be tasked with advising and
According to the Survey on the Access to Finance of supporting companies in all their business activities.
Enterprises (SAFE) Report 2020, 9.0% of SME Similarly, Wallonia has introduced the
respondents reported that access to finance is the ‘development and growth’ entrepreneurial
most important problem they faced, marginally mentoring system, aiming at bringing together both
lower than the EU-27 average of 9.9%32. experienced and new entrepreneurs34.
European Construction Sector Observatory 10Country Fact Sheet Belgium
3
Key economic drivers of the
construction sector
Business confidence slightly increased by 7.7%, from EUR 73,000 in 2010
to EUR 78,600 in 201837.
Over the 2010-2020 period, both the consumer
confidence indicator and the industry confidence Investment per worker in
the narrow construction
indicator deteriorated considerably. The consumer
confidence indicator stood at -12.1 in 2020, well sub-sector between 2010 39.0%
below its 2010 level of -6.4 but slightly above the and 201838
EU-27 average of -14.6. The industry confidence
indicator also decreased from -5.5 in 2010 to -15.0
Domestic sales
in 2020, below the EU-27 average of -14.4. In The ranking of the top five most domestically sold
contrast, the construction confidence indicator construction products in Belgium in 2020 remained
slightly increased over the years, going from -11.7 in almost same as 2010 except for “Prefabricated
2010 to -9.4 in 2020, marginally lower than the EU- buildings of metal (group 251110)” and “Windows,
27 average of -9.3. French windows, etc. (group 162311)”, being
replaced by “Other structures and parts (group
Construction confidence indicator in 2020 251123)” and “Portland cement, aluminous cement,
etc. (group 235112)”. Compared to 2010, the total
value of “Prefabricated structural components
(group 236112)”, “Portland cement, aluminous
cement, etc. (group 235112)”, “Doors, windows and
-9.3 -9.4 their frames (group 251210)” and “Ready-mixed
concrete (group 236310)” sold domestically has
increased by 68.8%, 68.2%, 44.5% and 29.1%,
respectively. The top five most domestically sold
EU-27 Belgium construction products represented almost 60.1% of
total domestic construction product sales in 2020.
The Belgian investment ratio slightly increased from
Table 1: Five most domestically sold construction
21.7% in 2010 to 24.2% in 2020, above the EU-27
products in Belgium and in the EU in 2020
average of 21.8%.
Belgium EU-27
Investment per worker in the broad construction
sector increased by 14.7%, from EUR 114,810 in Share in
constructio
2010 to EUR 130,273 in 201835. In terms of sub- Product
Value
n product Product
(EUR m)
sectors, investment per worker in the domestic
sales (%)
manufacturing sub-sector increased by 192.9%,
followed by the narrow construction (+39.0%) Other
Other
structures
sub-sector and amounting to EUR 28,700 and 1 and parts 875.8 14.8
structures and
parts (group
EUR 22,100, respectively, in 201836. Investment per (group
251123)
worker in the real estate activities sub-sector 251123)
European Construction Sector Observatory 11Country Fact Sheet Belgium
Belgium EU-27 Table 2: Five most exported construction products
Share in in Belgium and in the EU in 2020
constructio
Value Belgium EU-27
Product n product Product
(EUR m)
domestic Share in
sales (%) construction
Value
Prefabricated Product product Product
Ready-mixed (EUR m)
structural export sales
concrete (%)
2 components 862.9 14.5
(group
(group Fibreboard of Ceramic tiles
236310)
236112) wood, etc. and flags
1 515.3 14.3
Doors, Doors, (group (group
windows and windows and 162115) 233110)
3 their frames 750.8 12.7 their frames Other
(group (group Other
structures
251210) 251210) structures and
2 and parts 386.0 10.7
parts (group
Ready-mixed Prefabricated (group
251123)
concrete buildings of 251123)
4 663.2 11.2
(group metal (group Prefabricated
236310) 251110) Fibreboard of
structural
wood, etc.
Portland 3 components 191.0 5.3
Prefabricated (group
cement, (group
structural 162115)
aluminous 236112)
5 410.4 6.9 components
cement, etc. Portland
(group Doors,
(group cement,
236112) windows and
235112) aluminous
4 166.0 4.6 their frames
Source: PRODCOM, 2021. cement, etc.
(group
(group
251210)
235112)
Export of construction-related
Builders
products and services Particle board joinery and
5 (group 160.3 4.5 carpentry, etc.
The ranking of the five most exported products has 162112) (group
162319)
seen notable changes in recent years with the
addition of “Fibreboard of wood, etc. (group Source: PRODCOM, 2021.
162115)”, “Other structures and parts (group In terms of the cross-border provision of
251123)” and “Particle board (group 162112)”, construction services39, Belgium exported
replacing “Other worked ornamental, etc. (group EUR 2.3 billion worldwide in 2020, 7.9% higher
237012)”, “Pallets, box pallets, etc. (group 162411)” compared to the 2010 value (EUR 2.2 billion). This
and “Calcined or agglomerated dolomite (group included EUR 1.7 billion of exports to the EU-27
235230)” since 2010. Additionally, compared to member states (i.e. 72.0% of exports), highlighting
2010, the total value of “Portland cement, the importance of the EU Single Market for the
aluminous cement, etc. (group 235112)” and country. Belgium imported a total of EUR 2.6 billion
“Prefabricated structural components (group in construction services in 2020, registering a
236112)” exported has increased by 11.0% and considerable growth of 50.3% compared to its 2010
5.2%, respectively, in 2020. level (EUR 1.7 billion). This included imports from
The top five most exported construction products EU-27 countries amounting to EUR 2.3 billion in
from Belgium and the EU-27 are summarised in 202040 (i.e. 85.5% of imports). Belgium, thus,
Table 2. Together, these made up 39.4% of all experienced a trade deficit of EUR 244.0 million in
construction product exports in 2019. 2020.
European Construction Sector Observatory 12Country Fact Sheet Belgium
Access to finance in the Access to housing
construction sector The number of households in Belgium experienced
a slight increase of 5.6%, from 4,622,400 in 2010 to
According to the 2020 Survey on the Access to
4,881,500 in 2020. The share of the total population
Finance of Enterprises (SAFE) report, 27.2% of small
living in densely-populated areas decreased from
and medium enterprises (SMEs) in Belgium reported
54.3% in 2010 to 30.0% in 2020. In contrast, the
grants or bank loans as being relevant, below the
share of the total population living in intermediate
EU-27 average (44.4%). Around 22.0% of the SMEs
urbanised areas increased from 41.5% in 2010 to
reported using bank loans recently, above the EU-27
54.8% in 2020.
average (17.9%). During the same period, 31.2% of
Belgian SMEs applied for a bank loan, lower than the The mean equivalised net income increased by
EU-27 average of 34.6%. This may be explained by 29.4%, from EUR 21,353 in 2010 to EUR 27,641 in
the fact that around 44.0% of SMEs did not apply for 2020, well above the EU-27 average of EUR 19,567.
bank loans because of sufficient internal funds, well
above the EU-27 average of 35.1%41,42. 27,641
The availability of bank loans for Belgian SMEs has
also changed. Around 11.4% of SMEs recorded that 21,353
19,567
the availability of bank loans has improved in 2020,
well below the EU-27 average (18.6%). 14.8% of
SMEs mentioned that it has deteriorated, almost in
line with the EU-27 average of 14.2%43.
As per the European Investment Bank (EIB)
Investment Survey 2020, 51.0% of Belgium’s
construction firms considered the availability of
finance as a long-term barrier for the sector44. Belgium 2010 Belgium 2020 EU-27 2020
Bank loans continue to make up the largest share of Mean equivalised net income in
external finance (about 65.0%) in the construction Belgium and in EU-27 (in EUR)
sector in Belgium, followed by leasing (20.0%). Housing loans to households picked up
60.0% of the Belgian firms in the construction sector considerably, with total outstanding residential
relied on internal sources of finance for investment loans increasing by 62.9%, from EUR 161.7 billion in
purposes compared to external sources (40.0%). 2010 to EUR 263.4 billion in 201949. This increase in
This is also driven by the fact that 70.0% of the residential loans is partly supported by the declining
Belgian construction firms reported making a profit, interest rates on mortgages, currently standing at
below the EU-27 average of 80.0%. Nonetheless, the 1.9% in 2020 compared to 4.1% in 2010 (Figure 7).
share of ‘financially constrained’45 firms in the Figure 7: Mortgage rates for loans for over 5 years
construction sector (6.0%) is slightly higher than the original maturity (%) between 2010 and 2020
firms operating in the manufacturing (4.5%) and
service sectors (5.0%) in Belgium46.
The impacts of COVID-19 on investment strategies
have also been quite negative with almost 40.0% of
Belgian construction firms investing less in 2020,
lower than EU-27 average of 45.0%47. However,
74.0% of construction firms believed their
investment over the last three years was about the
right amount, well above the EU-27 average of
50.0%48. Source: European Central Bank, 2021.
European Construction Sector Observatory 13Country Fact Sheet Belgium
The house price index for total dwellings increased Historically, Belgium has been characterised by a
by 18.6% over the 2015-2020 period, mostly driven high home ownership rate. Over the 2010-2020
by a 19.9% and 18.0% increase in price indices of period, the home ownership rate in Belgium
new dwellings and existing dwellings over the same remained above 71.0%, being at 71.1% in 2020. This
reference period, respectively (Figure 8). This rate further increased to 76.7% for the population
increase in house prices is partially due to the earning above 60.0% of the median equivalised
overvaluation of the Belgian residential real estate income53 whereas it substantially declined to 36.9%
market50. for the population earning below 60.0% of the
median equivalised income.
House price index for
new dwellings between
2015 and 2020
19.9% In parallel, Belgium’s overcrowding rate54 stood at
5.7%55 in 2019 and 2020, considerably below the
EU-27 average of 17.1% for 2019. The severe
Figure 8: House price index in Belgium between
housing deprivation rate56 stood at 1.9% in 2019
2010 and 2020 (2015=100)
and 2.3% in 2020, slightly below the EU-27 average
of 4.0% in 2019. Lastly, the housing cost overburden
rate57 stood at 7.8% in 2020, slightly below the EU-
27 average of 9.9%.
Housing cost overburden rate in 2020
Source: Eurostat, 2021. 7.8% 9.9%
Social housing continues to be a concern, especially
in the case of the private rental market with 8.6% of
the Belgian population spending about 40.0% or
more of their household income on housing51. Belgium EU-27
Likewise, obtaining a building permit continues to
be difficult and involves long delays, particularly
Infrastructure
with regards to the renovation of Belgium’s existing As per the 2019 Global
housing stock. The number of new residential Competitiveness Report,
construction building permits issued for new Belgium ranked 14th out of 141
buildings and new dwellings increased by 4.9% and economies in terms of its
9.6%, from 27,292 and 50,545 in 2010 to 28,633 and overall infrastructure quality58.
55,412 in 2020, respectively. In the case of
Belgium ranked 16th with regards to its transport
non-residential constructions, the number of new
infrastructure and 4th in terms of its railroad density,
buildings permits issued increased by 34.3%, from
9th for the efficiency of its seaport services and 19th
4,753 in 2010 to 6,383 in 2020. Similarly, the
with regard to the efficiency of its air transport
number of building permits issued for residential
services. Belgium ranked 21st in terms of road
renovations slightly increased by 2.0%, from 28,888
connectivity, 36th in relation to the efficiency of its
in 2010 to 29,480 in 2020. In contrast, the number
train services, 42nd with regard to its airport
of building permits issued for non-residential
connectivity and 56th for the quality of its road
renovations decreased by 32.4%, from 5,252 in
infrastructure. However, Belgium also has one of
2010 to 3,552 in 202052.
the densest road networks in the EU, reaching 58.0
Number of permits for km per 1,000 km2 in 201859. In order to improve the
non-residential quality of the general infrastructure, the regions
renovations between 32.4% have implemented their own infrastructure
2010 and 2020 investment plans.
European Construction Sector Observatory 14Country Fact Sheet Belgium
4
Key issues and barriers in the
construction sector
Company failure Trade credit
Over the 2010-201860 period, the number of In 2020, about 50.0% of the total value of Belgian
company deaths in the real estate activities B2B (business to business) sales were made through
sub-sector increased by 60.1%, from 511 in 2010 to the use of trade credit. This is slightly lower than the
818 in 201861. Similarly, the number of company Western European average of 55.5%. Nonetheless,
deaths in the narrow construction and the 41.0% of the respondent businesses reported an
architectural and engineering activities sub-sectors increased use of credit sales (by almost 36.0%) with
increased by 43.2% and 39.4%, from 2,718 and 642 the onset of COVID-19 pandemic68.
in 2010 to 3,893 and 895 in 201862, respectively.
As per the Payment Practices Barometer
Company deaths in the Belgium 2020, 57.0% of the respondent
narrow construction businesses offered trade credit primarily to
sub-sector between 2010 43.2% encourage domestic market transactions,
and 201863 slightly above the Western European average of
53.0%. 21.0% offered trade credit to meet
The number of company births in the real estate
short-term financial needs, lower than the
activities sub-sector increased by 34.5%, from 1,404
Western European average of 23.0%69.
in 2010 to 1,889 in 2018. Likewise, the narrow
construction and the architectural and engineering As per the report, 40.0% of the respondent are likely
activities sub-sectors experienced increases of to refuse trade credit requests due to deteriorating
18.9% and 11.6%, from 6,882 and 1,626 in 2010 to customer creditworthiness, substantially above the
8,183 and 1,815 in 201864, respectively. Western European average of 26.0%. In fact,
businesses representing almost 30.0% of the total
Company births in the
B2B sales value refused to provide trade credit.
narrow construction
sub-sector between 2010 18.9% Going forward, 28.0% of respondent businesses
plan to offer trade credit next year to help develop
and 201865
foreign sales, slightly higher than the Western
In parallel, the number of bankruptcies in the European average of 23.0%. This is followed by
Belgian narrow construction and the real estate 23.0% of respondent businesses planning to offer
activities sub-sector decreased by 15.3% and 32.6%, trade credit as a short-term financing option for B2B
from 1,560 and 218 in 2010 to 1,322 and 147 in customers (compared to the Western Europe
2020, respectively. In fact, over the January average of 20.0%). 4.0% of respondent businesses
2021-September 2021 period, 977 and 90 plan to offer less trade credit to their B2B customers
bankruptcies had already been registered in the in the coming months70.
narrow construction and real estate activities
sub-sectors, respectively66,67.
European Construction Sector Observatory 15Country Fact Sheet Belgium
According to the 2020 Survey freezes as a coping mechanism for lower revenue
on the Access to Finance of levels77.
Enterprises (SAFE) Report,
As per the 2020 Atradius Payment Practice
34.6% of Belgian SME
Barometer, 57.0% of the respondent businesses
respondents reported trade
deem that the increasing construction costs
credit to be relevant, well
represent the biggest risk for profitability in 2021.
above the EU-27 average of
This is well above the Western European average
27.7%71, 72.
of 43.0%. This is followed by the collection of
Amongst the firms which applied for trade credit in outstanding invoices as reported by 54.0% of the
Belgium, 57.5% of SMEs received everything they respondent businesses, well above the Western
applied for, lower than the EU-27 average of 67.3%. European average of 42.0%78.
14.4% of Belgian SMEs received above 75.0% of
what they applied for in trade credit, slightly above
As per Intrum European Payment
the EU-27 average of 10.8%. 19.9% of SMEs
Report 2021, 64.0% of Belgian
received below 75.0% of what they applied for, well
businesses are concerned about
above the EU-27 average of 10.1%73.
debtor’s ability to pay debt on time
Late payment and 44.0% of businesses expect the
widening gap between payment
According to 2020 Atradius Payment Practice terms and pay duration to become a
Barometer, 63.0% of the total value of B2B serious risk for sustainable business
invoices in the Belgian construction sector were growth79.
affected by late payments74.
As per the report, some of the major challenges still
As per the report, 36.0% of the total value of B2B faced by companies making customers pay on time
invoices reported waiting longer (up to ten days) included debtor’s facing liquidity challenges due to
past the due date to turn outstanding invoices into impact of COVID-19 (48.0%), debtors in financial
cash. 54.0% reported no change in average cash difficulties (40.0%), risk of pan-European recession
turnaround time, while 4.0% registered a reduced (39.0%), disputes regarding goods and services
cash turnaround time compared to before the delivered (36.0%) and lack of business experience
COVID-19 pandemic75. among customers (30.0%)80. About 40.0% of
According to the 2020 Payment Practice Barometer, business respondents use pre-payments as a
the average Days Sales Outstanding (DSO) for the precautionary measure, followed by credit checks
Belgian construction sector stood at 91 days, higher (35.0%), debt collection (25.0%), credit insurance
than the Western European average of 70 days. (16.0%), bank guarantees (12.0%), factoring (8.0%)
60.0% of the respondent businesses reported their and fraud prevention (9.0%)81.
DSO increased by up to 10.0%, while 25.0% In terms of good payment practices, the
confirmed that their DSO increased by above 10.0% construction sector is among the lowest performing
as compared to previous year76. sectors in the Belgian economy with only 34.0% of
50.0% of the respondent businesses in the Belgian construction sector enterprises in Q4 2020 making
construction sector reported lower revenue levels payments by the due date. The number of firms
due to the COVID-19 pandemic downturn, almost paying after over 90 days past the due date stood at
on par with the Western European average of 2.1% in Q4 202082.
49.0%. Consequently, 29.0% of the respondent The Late Payment Directive was transposed
businesses delayed payments to suppliers, slightly through the Act of 22 November 2013, ensuring
lower compared to the Western European average that businesses, including SMEs, are safeguarded
of 36.0%. Additionally, 25.0% of the respondent against payment delays by adding minimum debt-
businesses requested an extension to bank recovery processing compensation and increased
overdrafts. 25.0% spent more on time, costs and interest penalties for late payments. The directive
resources to collect unpaid invoices. Similarly, also stipulates that payment terms should be set at
25.0% of the respondents also declared hiring 30 days if not otherwise specified in the contract.
European Construction Sector Observatory 16Country Fact Sheet Belgium
For B2B transactions, the two parties can also agree Obtain water and sewage
75 days EUR 16,602
connection
on payment terms of up to 60 days or longer, Source: Doing Business overview for Belgium, Word Bank, 2021.
provided that the agreement is not unfair to the
creditor83. Skills shortage
Recently, the Belgian government has been actively In 2020, there were 7,938 job vacancies in the
taking steps to address late payment issues, Belgian narrow construction sub-sector and 683
particularly those affecting SMEs. For instance, in vacancies in the real estate activities sub-sector.
May 2019, the Belgian government amended the This represented a significant increase of 43.9% and
law of 2nd August 2002 related to late payment in 209.9% as compared to 201387 levels, respectively.
commercial transactions. As such, enforceable from The job vacancy rate for both the narrow
April 2020, the maximum payment terms between construction as well as the real estate activities
SMEs and larger enterprises cannot exceed 60 sub-sectors increased from 2.6% and 1.5% in 2013
days84. to 3.7% and 2.8% in 2020, respectively.
Time and cost of obtaining building Job vacancies in the
narrow construction
permits and licenses sub-sector between 2013 43.9%
According to the World Bank Doing Business 2020 and 2020
Report, Belgium ranked 45th out of 190 countries
with respect to “Dealing with construction The situation has worsened in the third quarter of
permits”85. In 2019, ten procedures were required 2021, as the narrow construction sub-sector
to complete the formalities to build a warehouse86, reported 18,194 job vacancies, being the third
worst affected sector after the hospitality and ICT
slightly below the OECD high-income average of
12.7. However, the time needed to complete them sectors88. Over the 2011-2020 period89, adult
totalled 212 days, considerably above the OECD participation in education and training in the broad
high-income average of 152.3 (Table 3). The cost of construction sector decreased. In the case of the
completing the formalities to build a warehouse real estate activities sub-sector, the adult
represented 0.9% of the total value of the participation rate decreased from 13.3% in 2011 to
warehouse, notably below the OECD high-income 8.6% in 201990. In contrast, the adult participation
average of 1.5%. rate in the narrow construction sub-sector
marginally increased from 4.0% in 2010 to 4.1% in
Table 3: Construction procedures timing and costs 2020.
in Belgium
The number of tertiary students enrolled in
Time to Associated
Procedure
complete costs
engineering, manufacturing and construction
Obtain a recent proof of land increased by 17.3% from 11,243 in 2010 to 13,192
7 days EUR 75
ownership in 201991. Out of this, 3,380 tertiary students were
Obtain clearance from the
Fire Department
14 days EUR 880 enrolled in architecture and building in 2019,
Request building permit representing a slight increase of 5.6% compared to
110 days EUR 780
from the Municipality the 2010 level of 3,200 students.
Inform Municipality of
1 day No charge
commencement of work Labour shortages continue to be an ongoing
Receive on-site inspection
concern for Belgium with the country facing an
from Fire Department after 1 day No charge
construction annual scarcity of about 20,000 construction
Inform Municipality of the
1 day No charge workers every year92. Finding appropriate skills in
completion of construction
File application and receive
the broad construction sector, in addition to
an inspection by the recruiting qualified personnel, is one of the greatest
1 day No charge
Cadastre upon completion challenges of the sector. The highest scarcity relates
of construction
Apply for water and sewage
to professions such as trained technical personnel
1 day No charge with a highly technical degree, engineers, project
connection
Receive inspection for water managers, and mathematicians. Additionally, the
and sewage on construction 1 day No charge
site construction sector needs plasterers, painters,
plumbers, bricklayers, carpenters, scaffolders,
European Construction Sector Observatory 17Country Fact Sheet Belgium
roofers, tile layers, building site workers, quantities of materials present in a non-residential
electricians and mechanics93. To mitigate the buildings up for demolition so as to enable the
increasing number of workers leaving the identification and recycling of hazardous waste101.
profession, the number of new recruitments will At the same time, following the traceability system
need to increase from a baseline of 24,150 in 2012 of the non-profit independent demolition
to 24,900 in 203094. management organisation Tracimat can result in a
“certificate of selective demolition”102. Sectoral
Sector and sub-sector specific implementation plans were also introduced for
issues CDW. The Public Waste Agency of Flanders (OVAM)
has developed a policy to make Flanders asbestos-
Material efficiency and waste management safe by 2040103. An asbestos inventory will be
In 201895, Belgium reported a total of 22.6 million mandatory in 2022 when selling a building104.
tonnes of construction and demolition waste Since January 2021, a reduced VAT rate of six per
(CDW), representing a growth of 34.4% compared cent has been applied instead of 21 per cent for the
to the 2010 level (16.9 million tonnes). Of the 2018 demolition and reconstruction of a house
total, 22.6 million tonnes (i.e. 94.8%) were throughout Belgium. This is a temporary measure,
non-hazardous, with the remaining 1.2 million with specific conditions, which runs until the end of
tonnes (i.e. 5.2%) being hazardous waste96,97. 2022. This measure goes in addition to the existing
VAT reduction for demolition and reconstruction in
Construction and
32 cities105.
demolition waste
between 2010 and 2018
34.4% According to a survey conducted by Bouwunie, half
of the respondents (contractors) have seen a
With regards to waste management, Belgium is one
remarkable increase in the number of applications
of the best performers in the EU. It has already
since the introduction of the reduced rate. The
achieved its EU 2020 municipal waste recycling
measure therefore works.
target. However, different regions follow separate
collection rates with Flanders and Wallonia (70.0%) Climate and energy
performing much better compared to Brussels
Emissions of greenhouse gases (carbon monoxide
(43.0%). Additionally, in 2018 Belgium recorded a
and dioxide, methane and nitrous oxides) from the
97% recovery rate in construction and demolition
narrow construction and real estate activities
waste98. Nonetheless, the Belgian regional and
sub-sectors in Belgium amounted to a total of 2.7
federal governments have launched several
million tonnes and 227,851 tonnes in 2019,
initiatives to promote resource efficiency and the
respectively. Over the 2010-2019 period, emissions
adoption of the circular economy. For instance,
by the narrow construction sub-sector decreased by
Flanders has launched Green Deals on circular
11.6%. Contrarily, emissions by the real estate
purchasing and circular construction and the
activities sub-sector significantly increased by
Circular Flanders hub99. Similarly, Wallonia has also
53.6%.
launched three competitiveness clusters to create a
common platform for plastic recycling along with a Construction materials shortages
Green Deal for circular purchasing100, whereas the
Various material shortages occurred in conjunction
Brussels-Capital Region launched the with the COVID-19 pandemic, creating widespread
BuildCircular.Brussels amongst other. supply-chain tensions and important price hikes.
Waste prevention and sustainable recovery, being According to a survey made by the Construction
an important aspect of effective waste Confederation, a majority of contractors were still
management, the Flanders region has introduced experiencing price increases and abnormally long
requirements to pre-identify the types and delivery times at the end of 2021.
European Construction Sector Observatory 18Country Fact Sheet Belgium
5
Innovation in the construction sector
Innovation performance sub-sector grew by 80.0%, from 4,167 in 2010 to
7,501 in 2017114.
According to the 2021 European Innovation
In line with the generally moderate developments
Scoreboard, Belgium is classified as an
in BERD and FTE, the number of
Innovation Leader, better than its Strong
construction-related patent applications has
Innovator rank in 2020106.
fluctuated, from 41 in 2010 to 61 in 2020 (+48.8%)
The top three indicators of the Belgian innovation and averaging at 59 patents over the 2010-2020
system included foreign doctorate students, period.
innovative SMEs collaborating with others as well as
Construction-related
enterprises providing ICT training. The country also
demonstrated strong performance in attractive
patent applications
between 2010 and 2020
48.8%
research systems, use of information technologies
and linkages107. Moreover, two Belgian construction and materials
firms ranked within the top 1,000 EU-28 companies
As per the scoreboard, Belgian innovation
by R&D (industrial sector ICB-3D), according to the
performance improved in 2020 primarily driven by
2020 EU R&D Scoreboard115.
substantial performance improvement in several
indicators including using innovation survey data, The Belgian Building Research Institute (BBRI), a
digital skills, venture capital and resource private research centre founded with the support of
productivity. The country also achieved above the National Federation of Belgian Building
average scores on the climate change related Contractors, plays a key role in boosting research
indicators108. and innovation in the construction sector. It aims to
provide technical support to innovation activities,
In 2017109, Business Enterprise R&D Expenditure
tailored to the specific needs of construction SMEs.
(BERD) in the narrow construction and the real
This technological guidance is also supported by the
estate activities sub-sectors amounted to
Flanders Region, the Walloon Region as well as the
EUR 74.4 million and EUR 1.0 million, representing
Brussels-Capital region116. BBRI also runs the Centre
a 16.7% and 35.8% growth compared to its 2010
for Excellence in Sustainable Construction (CESC) in
levels, respectively. BERD in the professional,
Brussels, aimed at supporting construction
scientific and technical activities sub-sector also
companies in the application of new technologies
significantly increased by 69.8%, from EUR 552.0
and promoting sustainable buildings and
million in 2010 to EUR 937.7 million in 2017110.
renovation techniques117.
BERD expenditure in the
The Belgian Road Research Centre plays a similar
professional, scientific and
role in road construction and Volta for the
technical activities
sub-sector between
69.8% electricians.
2010 and 2017111 Eco-innovation and digitalisation
Total R&D personnel (full-time equivalents –
FTE)112, in the narrow construction and the real As per to the 2021 Eco-Innovation
estate activities sub-sectors considerably increased Scoreboard (Eco-IS), Belgium scored
by 54.4% and 100.0%, from 513 and 7 in 2010 to 792 107, well below the EU-27 average
and 14 in 2017, respectively113. The FTE in the of 121118.
professional, scientific and technical activities
European Construction Sector Observatory 19You can also read