FMRI Methods Journal Club: DTI - Cabeza, Diaz, and Madden Labs 02/04/13
←
→
Page content transcription
If your browser does not render page correctly, please read the page content below
fMRI Methods Journal Club: DTI

                 Cabeza, Diaz, and Madden Labs
                                     02/04/13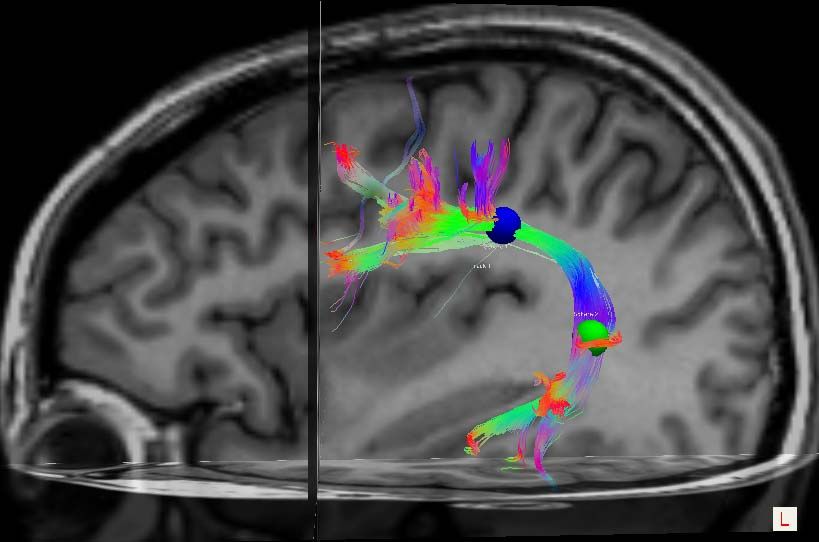
Outline for today’s discussion
`   Theoretical overview of DTI
    ` What is DTI?
    ` Advantages/Disadvantages to this technique
    ` Some applications of DTI in the literature

`   Implementing DTI in your lab
    ` Introduction of available software packages w/ examples
    ` DTI analysis
    ` BIAC pipeline: Connectome Mapper Tool Kit

`   A complementary tool for investigating white matter
    ` Lesion Segmentation Tool

`   Useful papers/links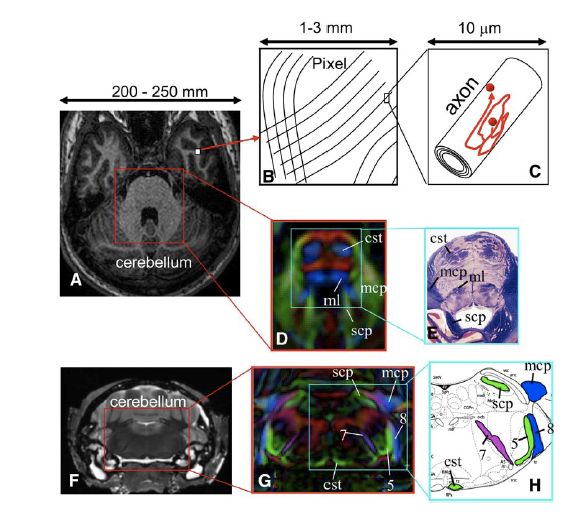
What is DTI?

`   “Diffusion tensor magnetic
    resonance imaging (DTI) is a
    non-invasive method to
    determine the underlying
    composition and integrity of
    nerves, neural fibers, etc.”
              Beaulieu, NMR Biomed, 2002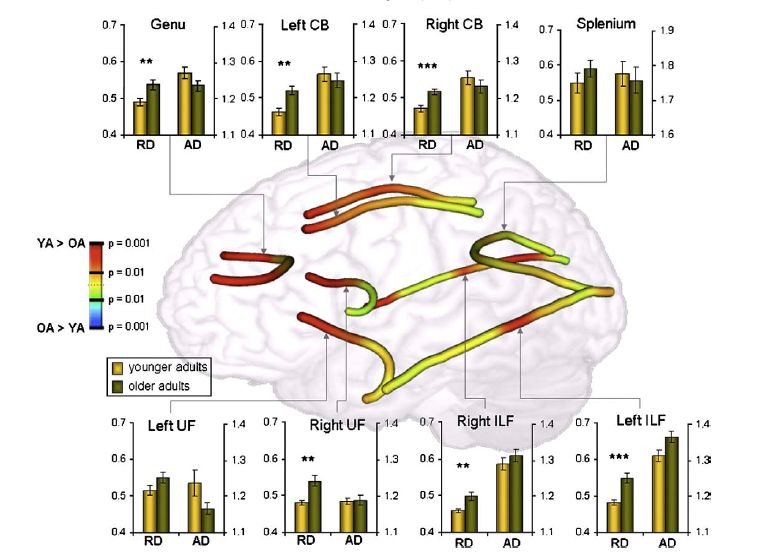
`   Provides a way to look at the other “tissue”, white
    matter

                                               Cortex
                                               Gray Matter
                 Segmentation

                                               Fibers
                                               White Matter
                                Cortex

                                White matter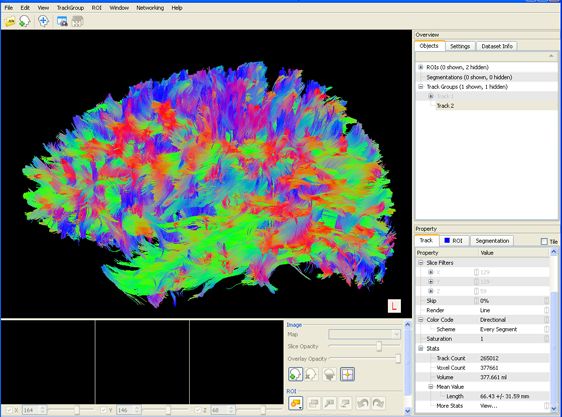
A quick comparison of MRI and DTI
images…

                       Mori et al, Neuron,
                       2006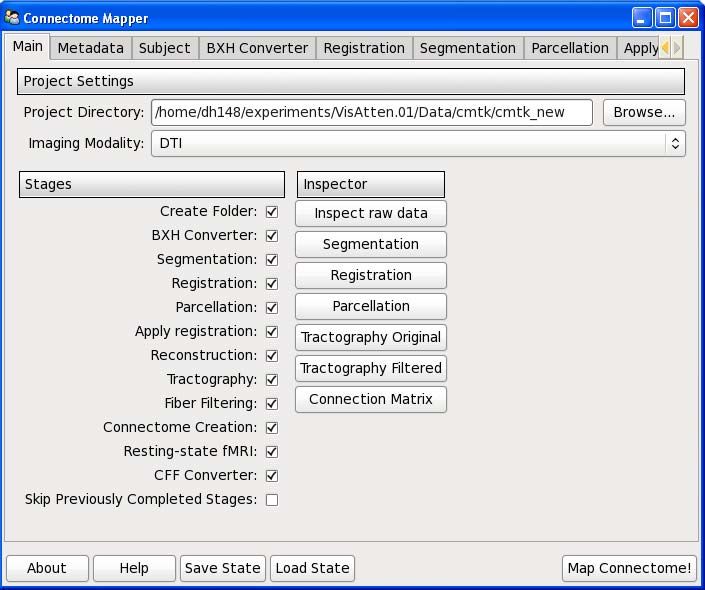
What is DTI?
`   Diffusion tensor magnetic resonance imaging (DTI)
    is a non-invasive method to determine the
    underlying composition and integrity of nerves,
    neural fibers, etc.

`   Primarily dependent on the way water diffuses
    within different brain structures

`   What factors influencing how water diffuses?
    `   Underlying tissue micro-structure (neurons, glia, etc.)
    `   Changes in Temperature (heat)
    `   Viscosity as indexed by the number of molecular-
        molecular interactions

`    The “difficulty” in the mobility of water molecules
    to travel may reveal the underlying structure of
    the tissue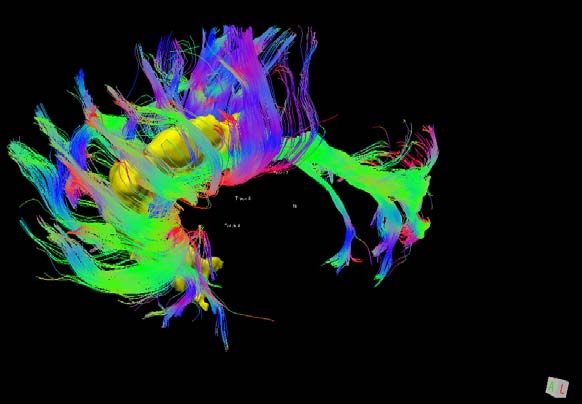
Two different forms of diffusion…

Beaulieu, NMR Biomed, 2002               Beaulieu, NMR Biomed, 2002
¾ The mobility of molecules is referred to a physical constant, the diffusion
coefficient, and when measured by DTI, yields a measure called apparent
diffusion coefficient

¾ In isotropic diffusion, diffusion of the molecules is equal in all directions
whereas anisotropic diffusion refers to diffusion that is greater in one
direction than the rest
Potential sources of this anisotropy?

                                       Beaulieu, NMR Biomed, 2002

¾ “Barriers” to optimal mobility to water diffusion perpendicular to the axon could
be as shown in this schematic, the axonal membrane, neuro-filament, and
microtubule structures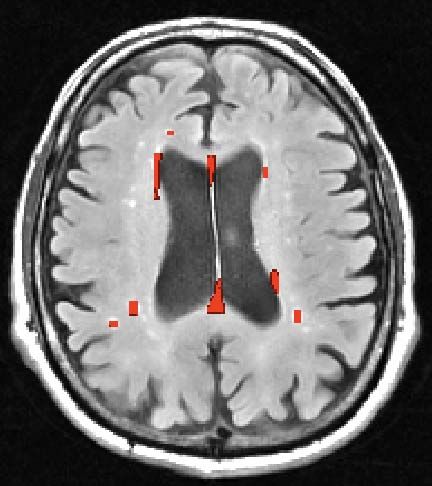
Diffusion Tensor aids in measuring
diffusion along different directions

                    Mukherjee et al., AJNR, 2008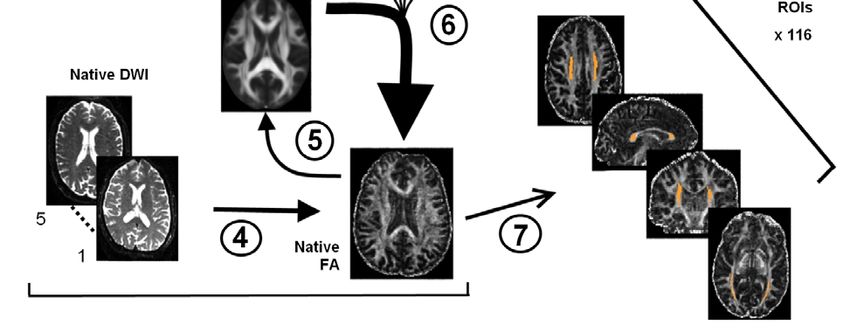
Anisotropy & Color-coded Orientation
                                        ¾ From a diffusion
                                        measurement along multiple
                                        axes a “diffusion ellipsoid” is
                                        created

                                        ¾ One can get an FA map
                                        with darker regions more
                                        isotropic than lighter more
                                        anisotropic regions

                                        ¾ From this “diffusion
                                        ellipsoid” one can get the local
                                        fiber orientation by identifying
                                        the longest axis

                                        ¾ Color-coded orientation
             Mori et al, Neuron, 2006   map can then be created; R
                                        (left-right), B (sup-inf), G
                                        (ant-post)
Indices one can get from DTI…
¾ Axial Diffusivity (AD)
¾ Reflects diffusivity along the
longitudinal/main axis (λ1)
¾ Radial Diffusivity (RD)
¾ Reflects average of the two
minor axes (λ2 + λ3)/2
¾ Mean Diffusivity (MD)
¾ Reflects average of all three
eigenvectors (λ1 +λ2 +λ3)/3
¾Fractional Anisotropy (FA)
¾ Measure that ranges from 0
(isotropic) to 1 (very anisotropic)
Mori et al, Neuron, 2006Indices one can get from DTI…
¾ Axial Diffusivity (AD)
¾ Reflects diffusivity along the
longitudinal/main axis (λ1)
¾ Radial Diffusivity (RD)
¾ Reflects average of the two
minor axes (λ2 + λ3)/2
¾ Mean Diffusivity (MD)
¾ Reflects average of all three
eigenvectors (λ1 +λ2 +λ3)/3
¾Fractional Anisotropy (FA)
¾ Measure that ranges from 0
(isotropic) to 1 (very anisotropic)
Mori et al, Neuron, 2006Examples of studies using DTI…
¾ Davis and colleagues
employed DTI using
manual/deterministic
tractography and TBSS to look at
age-related deficits on long-white
matter tracts
¾ Looked at DTI measures of RD
and AD for each of the tracts in
younger and older adults
¾ Study also included
neuropsych measuresExamples of studies using DTI… ¾ Metzler-Baddeley et al., traced tracts (fornix, PHG cingulum, uncinate fasciculus) involving regions that were functionally known to be involved in episodic memory and looked at the underlying structural integrity of the three tracts
Examples of studies using DTI…

                                 ¾ Fuentemilla et al.,
                                 were interested in
                                 looking at how
                                 differences in the
                                 accuracy of memory
                                 could be driven by
                                 anatomical
                                 differences as gauged
                                 by white matter
                                 integrity in “memory-
                                 relevant” tracts
Some Advantages & Disadvantages to
DTI…
` Advantages
` Non-invasive and Requires the use of no contrast agents or tracers
` Works within the existing fMRI framework – no major additional setup
required
` Allows for a more refined understanding of the underlying structural
fidelity
` How does structural connectivity inform functional connectivity and vice
versa Æ DTI via FA indices could help w/ structural connectivity
` Disadvantages
` DTI is sensitive to noise and motion impacting SNR & tractography
` Problems with tensor fitting and diffusion-weighting gradientsFSL’s TBSS: Tract‐Based Spatial Statistics
• http://fsl.fmrib.ox.ac.uk/fsl/fslwiki/TBSS
FMRIB58_FA‐skeleton_1mm.nii.gz
FMRIB58_FA_1mm.nii.gz MNI152_T1_1mm_brain.nii.gzSkeleton‐based stats with FSL’s
randomise
http://fsl.fmrib.ox.ac.uk/fsl/fslwiki/Randomise
http://fsl.fmrib.ox.ac.uk/fsl/fslwiki/TBSS
design_ttest2 design 4 4
test_groups.mat test_groups.con
/NumWaves 2 /NumWaves 2
/NumPoints 8 /NumContrasts 2
/PPheights 1 1 /PPheights 1 1
/Matrix /Matrix
10 1 ‐1
10 ‐1 1
10
10
01
01
01
Example of code to run “randomise”
01 randomise –i all_FA_skeletonised.nii.gz –o test_groups test_groups_tfce_corrp_tstat2.nii.gz
–m mean_FA_skeleton_mask.nii.gz –d test_groups.mat
–t test_groups.con –n 1000 –T2 -VTBSS code
http://fsl.fmrib.ox.ac.uk/fsl/fslwiki/TBSS
• 1) tbss_1_preproc *.nii.gz
• 2) tbss_2_reg –T
– Or, tbss_2_reg –n (for study‐specific option, see website)
• 3) tbss_3_postreg –T
– Or, tbss_3_postreg –S (for study‐specific option, see website)
• 4) tbss_4_prestats 0.2 (to threshold meanFA skeleton and create all_FA_skeletonised.nii.gz)
Alternatively, for Steps 2 & 3, you could use the following FSL functions:
• fsl_reg ${subj}_FA ${FSLDIR}/data/standard/FMRIB58_FA_1mm ${subj}_to_FMRIB58 –FA
– For registration, which is what the tbss_2_reg is doing anyway
• fslmerge –a all_FA *to_FMRIB58.nii.gz
– creates a 4D file with all subjects' registered FA images
• fslmaths all_FA –max 0 –Tmin –bin mean_FA_mask –odt char
– Create mean_FA_mask.nii.gz
• # ## to use the TBSS mean_FA template (FMRIB58) and create skeleton
• fslmaths $FSLDIR/data/standard/FMRIB58_FA_1mm ‐mas mean_FA_mask mean_FA
• fslmaths mean_FA ‐bin mean_FA_mask
• fslmaths all_FA ‐mas mean_FA_mask all_FA
• $FSLDIR/bin/imcp $FSLDIR/data/standard/FMRIB58_FA‐skeleton_1mm mean_FA_skeletonSemi‐automated ROI definition and deprojection method
ROI deprojection code
• * NOTE: FOR ALL THESE FSL FUNCTIONS, TO LEARN MORE ABOUT THE FUNCTION OR PARAMETER OPTIONS, TYPE THE
NAME OF THE FUNCTION IN AN INTERACTIVE NODE
• Register all subjects’ T1 images (e.g., “…_anat_...nii.gz”) to MNI T1 template
• for j in `$FSLDIR/bin/imglob *_anat_*` ; do
• flirt ‐ref ${FSLDIR}/data/standard/MNI152_T1_1mm_brain ‐in $j ‐omat
${OUTPUTDIR}/${j}_to_MNI_aff.mat –out ${OUTPUTDIR}/${j}_flirted
• fnirt ‐‐in=$j ‐‐aff=${OUTPUTDIR}/${j}_to_MNI_aff.mat ‐‐
cout=${OUTPUTDIR}/${j}_to_MNI_nonlin_warps ‐‐config=T1_2_MNI152_2mm ‐‐
ref=${FSLDIR}/data/standard/MNI152_T1_1mm_brain ‐‐
refmask=${FSLDIR}/data/standard/MNI152_T1_1mm_brain_mask
• applywarp ‐‐ref=${FSLDIR}/data/standard/MNI152_T1_1mm_brain ‐‐in=${j} ‐‐
warp=${OUTPUTDIR}/${j}_to_MNI_nonlin_warps ‐‐out=${OUTPUTDIR}/${j}_in_MNI
• done
• Register (nonlinearly) a subject’s FA image to MNI’s FA template
– Fsl_reg subj_FA ${FSLDIR}/data/standard/FMRIB58_FA_1mm subj_to_FMRIB58 –FA
• Get the inverse nonlinear registration transformation parameters
– invwarp ‐‐ref=subj_FA ‐‐ warp=subj_to_FMRIB58_warp ‐‐out=FMRIB58_into_subj_warp
• Deproject an ROI using the inverse warp
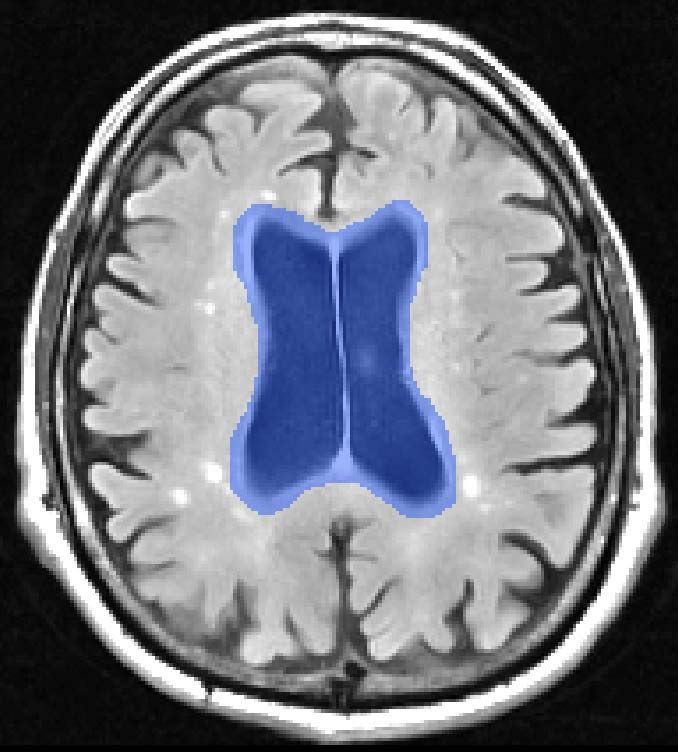
– applywarp –ref=subj_FA –in=ROI.nii.gz –warp=FMRIB58_into_subj_warp –out=ROI_in_subj_FATractography CMTK Pipeline -> TrackVis
Connectome Mapping Tool Kit
(CMTK)
Image processing pipeline that integrates
Anatomical (T1/T2)
Resting State fMRI
–BIAC RS pipeline
Diffusion Tensor Imaging
–Via Diffusion Toolkit (DTK)
BIAC-connectomemapper
connectomics.orgTrackVis
Fiber tracking visualization and analysis
Provides statistics such as track count, volume,
and fiber length
Numerous filtering options
ROI placement within tracts
trackvis.orgWhat you need
CMTK
– DTI data with BXH headers
– Anatomical T1 images for registration (.bxh)
– Cluster access
TrackVis
– .trk file output from CMTK
– Newer computer with 1-2GB memoryWhat you get
TrackVis Overlay scalar maps generated in participant space Provides statistics such as FA, RD, and MD
Limitations
All steps must be run (12+ hours)
Post-hoc WM seeding by default
– Whole brain tractography using freesurfer GM atlas
TrackVis forces 2 x 2 x 2 for visualization
TrackVis is very memory/graphics intensiveHelpful links CMTK - connectomics.org TrackVis - trackvis.org BIAC - wiki.biac.duke.edu
Lesion Segmentation Tool (LST)
fMRI Methods Journal Club
February 4, 2013
Automated Lesion Segmentation
• Lesion : any abnormality in tissue due to injury or disease
• Lesion Segmentation Tool (LST): white matter lesion detection
▫ lesion growth algorithm
x Schmidt, P., Gaser, C., Arsic, M., Buck, D., Förschler, A., Berthele, A.,
Hoshi, M., Ilg, R., Schmid, V.J., Zimmer, C., Hemmer, B., and Muhlau,
M., 2012. An automated tool for detection of FLAIR‐hyperintense
white‐matter lesions in Multiple Sclerosis. NeuroImage 59, 3774‐3783.
▫ open source toolbox in
SPM Find voxel Find voxels that are
intensities hyper-intense outliers
Ð of each tissue class
▫ technical aspects: Segment Ð
×
x Java VM for MATLAB: voxels into Detection of lesions
Increase heap space tissue classes
using Java.opts derived from T2 FLAIR
x minimum of 10G derived from T1 image coregistered to T1
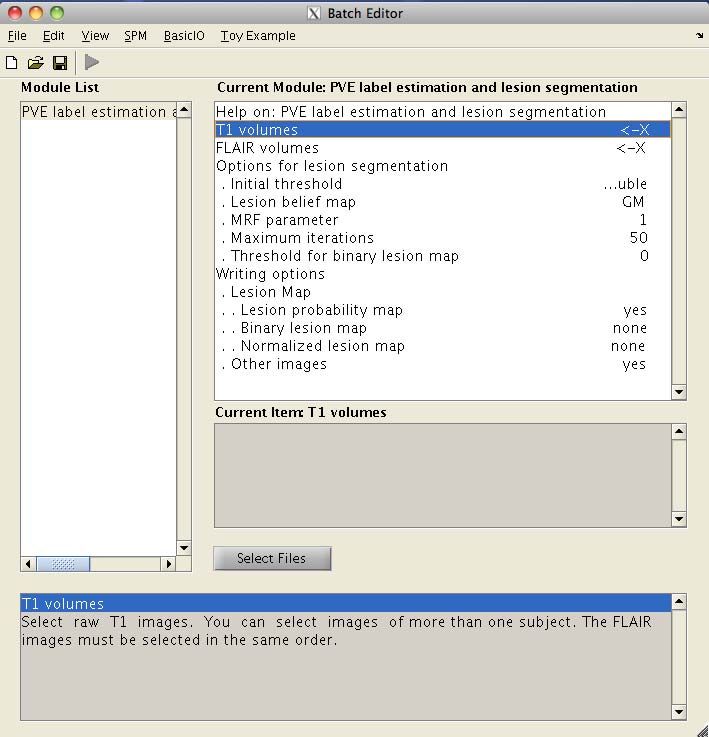
requested on cluster imageLST Module and Utilities Lesion maps in T1 space Volume of lesion load (mL)
LST Input

   Î        T1

            T2 FLAIR
LST Output: Lesion map
Base image: T2 FLAIR Lesion map
bias‐corrected FLAIR image in the (Threshold, k = 0.30)
space of the T1 imageLST Output: Lesion map continued…
• Location is key!
▫ Periventricular region
▫ Deep white matter region DW
M
PV
• Setting parameters
▫ conservative and liberal
thresholds
▫ altering the algorithm via lesion
growth initialization: GM seed
vs. GM & WM seedLST Output: Volume
Potential for:
Mean Lesion Volume (mL) by Age Group
• Group comparisons 5.0
Mean Lesion Volume (mL)
4.583
4.0
3.0
• Comparisons with 2.0
behavioral data 1.0 0.531
0.103
0.0
Younger Middle Older
• Informing threshold choice Age GroupFuture ventures?
• Relating lesion data to DTI data:
▫ Does lesion location correspond to measures of
decreased white matter integrity?
• Relating lesion data to behavioral measures:
▫ Does the amount or location of lesions predict
behavioral performance?
• Group comparisons of lesion load
▫ AgingUseful Links • LST’s website: http://www.applied‐statistics.de/lst.html • Schmidt, P., Gaser, C., Arsic, M., Buck, D., Förschler, A., Berthele, A., Hoshi, M., Ilg, R., Schmid, V.J., Zimmer, C., Hemmer, B., and Muhlau, M., 2012. An automated tool for detection of FLAIR‐hyperintense white‐matter lesions in Multiple Sclerosis. NeuroImage 59, 3774‐3783.
Theoretical Foundation for
 Lesion Growth Algorithm
|   1) Classify voxels according to
    intensity range of tissue classes
    (based on segmentation of the
    T1 image)

    y   Individual native T1-image
        generates a partial volume
        estimate label (range: 1-3)
        corresponding to intensity class
           1 = CSF
           2 = GM
           3 = WM

|   2) Find hyperintense-outliers of
    intensity distribution for each
    tissue class, (based on the T2
    FLAIR image)

    y   Standard module’s generation of
        lesions: Hyper-intense outliers of
        the GM class are projected to the
        sum of hyper-intense outliers of
        CSF, GM, and WM classes
You can also read