Functional characterization and pathophysiological evaluation of
←
→
Page content transcription
If your browser does not render page correctly, please read the page content below
TECHNISCHE UNIVERSITÄT MÜNCHEN
                                   FAKULTÄT FÜR MEDIZIN

            Functional characterization and
          pathophysiological evaluation of the
              Olfactomedin-like 2B gene

                                    Tanja Angelika Plӧtz

Vollständiger Abdruck der von der Fakultät für Medizin der Technischen Universität
München zur Erlangung des akademischen Grades eines

                      Doktors der Naturwissenschaften (Dr. rer. nat.)

genehmigten Dissertation.

Vorsitzender:                       Prof. Dr. Radu Roland Rad
Prüfer der Dissertation:
                              1.    Priv.-Doz. Dr. Arne Pfeufer
                              2.    Prof. Dr. Hans-Werner Mewes

Die Dissertation wurde am 20.07.2020 bei der Technischen Universität München eingereicht
und durch die Fakultät für Medizin am 16.03.2021 angenommen.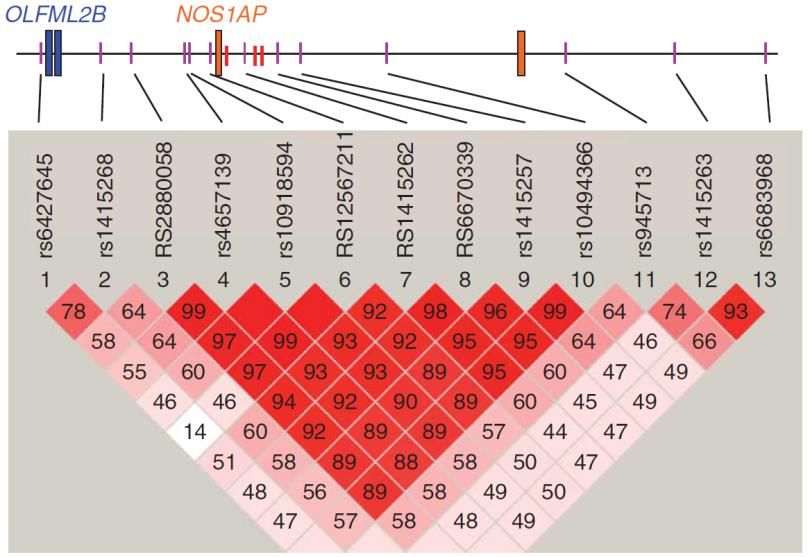
Table of Content

TABLE OF CONTENT
Table of Content ............................................................................................................... 2

Abbreviations ................................................................................................................... 5

I.         Abstract .................................................................................................................... 8

Zusammenfassung ............................................................................................................ 9

II.        Introduction .............................................................................................................10
      1.      Cardiomyopathies and Arrhythmias ............................................................................ 10
      2.      Genome-wide Association Studies ............................................................................... 15
      3.      GWAS for Cardiomyopathies........................................................................................ 16
      4.      The Olfactomedins ....................................................................................................... 20
      5.      Aims of the Study ......................................................................................................... 22

III. Material and Methods ..............................................................................................23
      1.      Material ........................................................................................................................ 23
      1.1.        Cohorts ..................................................................................................................... 23
      1.2.        Molecular Biology..................................................................................................... 23
      1.3.        Cell Culture ............................................................................................................... 25
      1.4.        Human Heart Tissue ................................................................................................. 26
      1.5.        Antibodies ................................................................................................................ 26
      1.6.        Laboratory Chemicals and Reagents ........................................................................ 28
      1.7.        Kits ............................................................................................................................ 30
      1.8.        Consumables ............................................................................................................ 31
      1.9.        Technical Devices ..................................................................................................... 31
      2.      Methods ....................................................................................................................... 33
      2.1.        Molecular Biology..................................................................................................... 33
      2.1.1.         Molecular Cloning ................................................................................................ 33
      2.1.2.         RNA Isolation, Purification and Reverse Transcription including qPCR ............... 34
      2.2.        Cell Culture ............................................................................................................... 35
      2.2.1.         Growth and Maintenance of HEK293 Cells .......................................................... 35

                                                                                                                                                    2
Table of Content

  2.2.2.        Transient Transfection and Lysis of HEK293 Cells ................................................ 36
  2.2.3.        Cryo-stocks ........................................................................................................... 37
  2.3.      Protein Preparation .................................................................................................. 37
  2.3.1.        Isolation of Protein from HEK293 Cells ................................................................ 37
  2.3.2.        Isolation of Protein from Human Heart Tissue .................................................... 37
  2.3.3.        Isolation of Protein from Human Whole Blood ................................................... 38
  2.3.4.        Protein Purification by FLAG Tag .......................................................................... 38
  2.3.5.        Protein Purification by Protein G Conjugated Sepharose Beads ......................... 39
  2.3.6.        Protein Purification by Compat-AbleTM Protein Assay ......................................... 39
  2.3.7.        Protein Quantitation by BCA ................................................................................ 39
  2.4.      Protein Analysis ........................................................................................................ 39
  2.4.1.        Sodium Dodecyl Sulphate-polyacrylamide Gel Electrophoresis .......................... 39
  2.4.2.        Western Blot Analysis .......................................................................................... 39
  2.4.3.        Colloidal Coomassie Staining................................................................................ 40
  2.4.4.        Mass Spectrometry .............................................................................................. 40
  2.5.      Immunoassays .......................................................................................................... 41
  2.5.1.        Dot Blot Analysis................................................................................................... 41
  2.5.2.        Enzyme-linked Immunosorbent Assay ................................................................. 41

IV.      Results .................................................................................................................43
  1.     Characterization of the OLFML2B Protein ................................................................... 43
  1.1.      Validation of Monoclonal Antibodies ...................................................................... 43
  1.2.      Intracellular Presence of Wildtype and 23 Mutant Proteins ................................... 44
  1.3.      In-silico Modelling of the Structure.......................................................................... 45
  1.4.      Structural Changes ................................................................................................... 46
  1.5.      Secretional Behaviour .............................................................................................. 47
  1.6.      Dominant Effect ....................................................................................................... 49
  1.7.      Temperature-Dependent Secretion ......................................................................... 50
  2.     Detection of OLFML2B in Human Heart Tissue ............................................................ 53
  3.     Proteomics of OLFML2B by LC-MSMS.......................................................................... 54
  4.     Tenascin C as Interaction Partner of OLFML2B ............................................................ 56

                                                                                                                                        3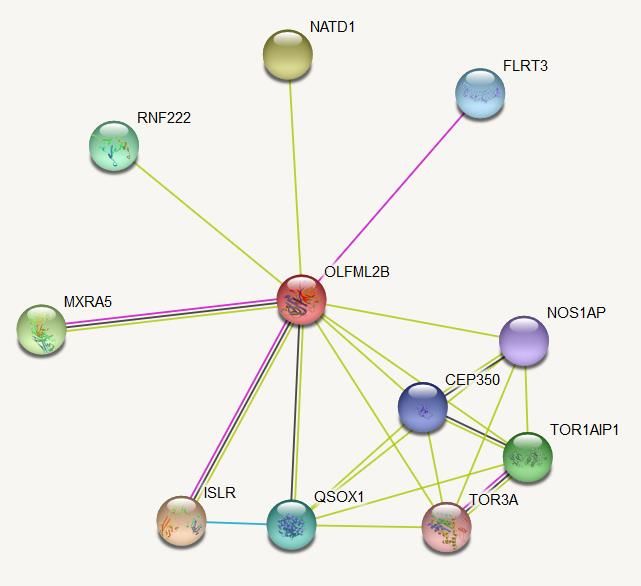
Table of Content

     5.      Establishment of two Sandwich ELISAs for Soluble OLFML2B ..................................... 57

V.        Discussion ................................................................................................................59
     1.      Characterization of the OLFML2B Protein ................................................................... 59
     2.      Interaction Partners of the OLFML2B Protein.............................................................. 64
     3.      Generation of a Biomarker Assay to Detect Circulating OLFML2B Protein ................. 66
     4.      Conclusion .................................................................................................................... 69

VI.          References ...........................................................................................................70

VII.         List of Figures .......................................................................................................84

VIII.        List of Tables.........................................................................................................87

IX.          Acknowledgements ..............................................................................................89

                                                                                                                                             4
Abbreviations

ABBREVIATIONS
aa              Amino acid
ab              Antibody
AF              Atrial fibrillation
ARIC            Atherosclerosis Risk in Communities
BCA             Bicinchoninic acid
bp              Base pair
BrS             Brugada syndrome
BSA             Bovine serum albumin
C-terminus      Carboxy-terminus
CaCl2           Calcium chloride
CAD             Coronary artery disease
CPVT            Catecholaminergic polymorphic ventricular tachycardia
DCM             Dilated cardiomyopathy
ddH2O           Double distilled water
DMEM            Dulbecco’s modified eagle medium
DNA             Deoxyribonucleic acid
ECG             Electrocardiogram
ECL             Enhanced chemiluminescence
ECM             Extracellular matrix
EDTA            Ethylenediaminetetraacetic acid
ELISA           Enzyme-linked immunosorbent assay
ER              Endoplasmic reticulum
ExAC            Exome aggregation consortium
FBS             Fetal bovine serum
GAPDH           Glycerinaldehyd-3-phosphat-Dehydrogenase
GenNOVA         Genetic Epidemiology Network of Atherosclerosis
GLDN            Gliomedin
gnomAD          Genome Aggregation Database
GWAS            Genome-wide association study
                                                                                   5
Abbreviations

GxE          Gene - environment interaction
HEPES        4-(2-hydroxyethyl)-1-piperazineethanesulfonic acid
HEK          Human embryonic kidney
HNR          Heinz Nixdorf Recall Study
HPLC         High-performance liquid chromatography
HRP          Horse radish peroxidase
IP           Immunoprecipitation
IgG          Immunoglobulin G
IVF          Idiopathic ventricular fibrillation
kb           Kilobase
KORA         Kooperative Gesundheitsforschung in der Region Augsburg
LB           Lysogeny broth
LC           Liquid chromatography
LD           Linkage disequilibrium
LOF          Loss-of-function
LQTS         Long-QT syndrome
M            Molar
MAF          Minor allele frequency
MES          2-(N-morpholino)ethanesulfonic acid
MgCl2        Magnesium chloride
MS           Mass spectrometry
MS/MS        Tandem mass spectrometry
MYOC         Myocilin
N-terminus   Amino-terminus
NHGRI        National Human Genome Research Institute
NOS1AP       Nitric oxide synthase 1 adaptor protein
NP-40        Nonident-40
OD           Optical density
OLFM1        Olfactomedin 1
OLFM2        Olfactomedin 2

                                                                             6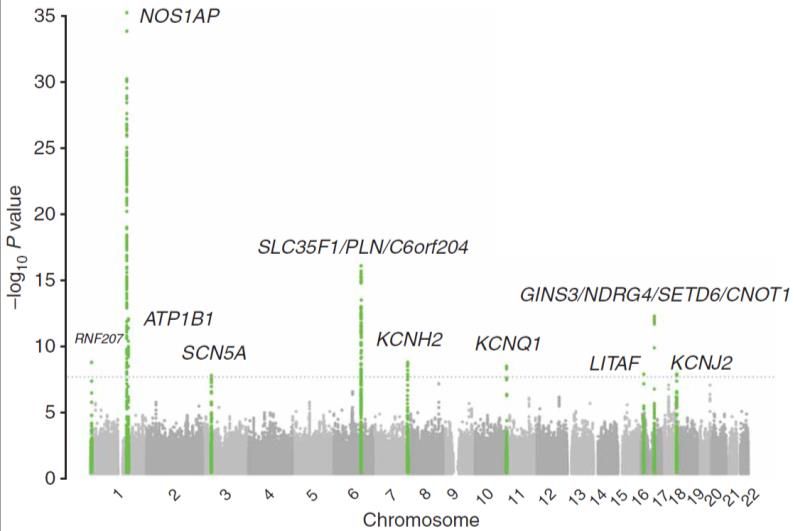
Abbreviations

OLFM3         Olfactomedin 3
OLFM4         Olfactomedin 4
OLFML1        Olfactomedin-like 1
OLFML2A       Olfactomedin-like 2A
OLFML2B       Olfactomedin-like 2B
OLFML3        Olfactomedin-like 3
PAGE          Polyacrylamide gel electrophoresis
PBS           Phosphate buffered saline
PCR           Polymerase chain reaction
POAG          Primary open angle glaucoma
PPI           Protein-protein interaction
PVDF          Polyvinylidene difluoride
qPCR          Quantitative PCR
QTc_RAS       QT interval corrected for heart rate, age and sex
QTSCD study   Study about QT interval and sudden cardiac death
RNA           Ribonucleic acid
RT            Room temperature
SardiNIA      Sardinian population cohort
SCD           Sudden cardiac death
SDS           Sodium dodecyl sulphate
SIDS          Sudden infant death syndrome
SN            Supernatant
SNP           Single nucleotide polymorphism
SQTS          Short-QT syndrome
TBS/ T        Tris-buffered saline/ with Tween20
TMB           3,3',5,5'-Tetramethylbenzidin
TNC           Tenascin C
Tris          Tris(hydroxymethyl)aminomethane
WHO           World Health Organization
Wt            Wildtype

                                                                             7
I. Abstract

I.     ABSTRACT
Impaired cardiac repolarization can induce life-threatening ventricular arrhythmias and
sudden death. While extreme repolarization disturbances occur in the rare monogenic short-
and long-QT syndromes, common genetic, non-genetic and exogenous factors such as
changes in body temperature are known to potentially trigger arrhythmias in the general
population. Genome-wide association studies have mapped the strongest common genetic
modifier of QT interval in the NOS1AP-OLFML2B genomic region in 1q23.3. This study
investigated the contribution of the olfactomedin-like 2B protein (OLFML2B) to the cardiac
repolarization process.
As mutations in the olfactomedin paralog myocilin cause disease by impairing protein
secretion, wildtype OLFML2B and 23 missense variants were characterized for their
temperature dependent secretional behaviour. Monoallelic mutations were identified in
patients with atrial (AF) and ventricular arrhythmias (LQT), as well as dilated cardiomyopathy
(DCM) and sudden infant death syndrome (SIDS) while three common OLFML2B variants
were also analysed. Upon recombinant expression in HEK293 cells, cytosolic OLFML2B levels
were indistinguishable, but levels of secreted protein varied strongly by temperature and
variant. Combined analysis illustrated that protein secretion correlated highly with
population allele frequency and temperature: Poorly secreted variants were rare at the
population level and originated exclusively from patients with SIDS, AF or LQT. These
findings suggest a role for OLFML2B in fever-triggered impaired cardiac repolarization and
for rare OLFML2B mutations predisposing to repolarization induced arrhythmia and sudden
cardiac death.
Additional evidence for the pathogenicity of OLFML2B is indicated by the pronounced
dominant effect of the mutated OLFML2B protein on the wildtype. Consequently, in a
heterozygous genotype the wildtype allele is incapable of rescuing the non-secretion caused
by the mutant allele, especially since the effect does not seem to depend on protein
concentration. This loss-of-function phenotype provides a plausible explanation for the
lethal course of all investigated SIDS cases holding an OLFML2B mutation.
The detection of OLFML2B in human heart tissue not only by itself but also simultaneously
with its interaction partner Tenascin C (TNC) identified by mass spectrometric analysis
illustrates another piece of understanding the overall mode of action: TNC was
demonstrated to be abundantly available during embryonic development but only
marginally in adults except for phases with high mechanical stress. This puts TNC, a protein
that has been shown to impair the inactivation of sodium channels, in context with cardiac
injuries pointing to a pathophysiological mechanism to influence the QT interval and thereby
repolarization of the heart.

                                                                                            8
Zusammenfassung

ZUSAMMENFASSUNG
Die Störung kardialer Repolarisation kann zu lebensbedrohlichen ventrikulären Arrhythmien
und zum plötzlichen Herztod führen. Während bei seltenen monogenen Short- und Long-QT-
Syndromen extreme Repolarisationsstörungen auftreten, können auch häufige genetische,
nicht-genetische und exogene Faktoren wie Veränderungen der Körpertemperatur
Arrhythmien in der Bevölkerung auslösen. Genomweite Assoziationsstudien haben den
stärksten genomischen Modifier des QT-Intervalls in der Region 1q23.3 der Gene NOS1AP-
OLFML2B lokalisiert. In dieser Arbeit wurde der Beitrag des Proteins Olfactomedin-like 2B
(OLFML2B) zur kardialen Repolarisation untersucht.
Da Mutationen im Paralog Myocilin aufgrund verminderter Proteinsekretion Krankheiten
verursachen, ist das temperaturabhängige Sekretionsverhalten von Wildtyp-OLFML2B und
23 Missense-Varianten charakterisiert worden. Monoallelische Mutationen konnten bei
Patienten mit atrialer (AF) und ventrikulärer Arrhythmie (LQT), dilatativer Kardiomyopathie
(DCM) und plötzlichem Kindstod (SIDS) identifiziert werden; zusätzlich zu diesen Mutationen
wurden drei häufige OLFML2B-Varianten untersucht. Während die zytosolischen
Proteinkonzentrationen keine Unterschiede zeigten, variierten die Werte für sekretiertes
OLFML2B je nach Temperatur und Proteinvariante erheblich. Kombinierte Analysen ließen
auf eine starke Korrelation der Proteinsekretion mit der Temperatur und der Allelfrequenz in
der Population schließen: Schlecht sekretierende Varianten kamen selten auf der
Bevölkerungsebene vor und stammten ausschließlich von Patienten mit SIDS, AF oder LQT.
Diese Ergebnisse deuten auf eine Rolle von OLFML2B bei fieberbedingten kardialen
Repolarisationsstörungen und seltenen OLFML2B-Mutationen hin, welche zu ventrikulären
Arrhythmien und plötzlichem Herztod führen können.
Einen weiteren Hinweis auf die Pathogenität von OLFML2B liefert der ausgeprägte
dominante Effekt des mutierten OLFML2B-Proteins auf den Wildtyp. Dadurch wird im
heterozygoten Genotyp ein Ausgleich der durch das mutierte Allel verursachten Nicht-
Sekretion durch das Wildtyp-Allel verhindert, zumal der Effekt nicht von der
Proteinkonzentration abzuhängen scheint. Dieser Loss-of-Function-Phänotyp bietet eine
naheliegende Erklärung für den tödlichen Verlauf aller untersuchter SIDS-Fälle, bei denen
eine OLFML2B-Mutation nachgewiesen wurde.
Der Nachweis von OLFML2B in menschlichem Herzgewebe, nicht nur isoliert sondern
gemeinsam mit seinem durch massenspektrometrische Analysen identifizierten
Interaktionspartner Tenascin C (TNC), verdeutlicht die Wirkungsweise: TNC ist während der
Embryonalentwicklung im Überfluss vorhanden, bei Erwachsenen jedoch nur geringfügig mit
Ausnahme von Phasen mechanischen Stresses. Dies assoziiert TNC, ein Protein das die
Inaktivierung von Natriumkanälen beeinträchtigt, mit kardialen Verletzungen und weist auf
einen pathophysiologischen Mechanismus hin, der das QT-Intervall und damit die
Repolarisation des Herzens beeinflusst.

                                                                                          9
II. Introduction

II.       INTRODUCTION
1. CARDIOMYOPATHIES AND ARRHYTHMIAS
Despite a lot of recent progress in our understanding of genetic cardiomyopathies and
arrhythmias, cardiac diseases still remain one of the most prevalent causes of premature
death in developed societies (Arking et al., 2006; Arking and Sotoodehnia, 2012). About 64%
of those deaths are induced by Sudden Cardiac Death (SCD), which is referred to as
unexpected, natural death induced by cardiac causes that occurs within one hour of the
onset of symptoms (Zipes and Wellens, 1998; Parakh, 2015). In 2008, SCD was affecting
about four to five million people each year worldwide (Chugh et al., 2008). The number of
deaths increased drastically over the past years with more than seven million lives per year
currently (Abhilash and Namboodiri, 2014; Parakh, 2015). The overall age distribution of SCD
indicates a distinctive pattern with a bimodal peak: The childhood peak occurs at
II. Introduction

The QT interval is measured from the beginning of the QRS complex until the end of the
T wave in the electrocardiogram (ECG). Consequently, it describes stages of ventricular
depolarization and repolarization mediated by different cardiac ion channels: While the
rapid inflow of positively charged ions (sodium and calcium) triggers depolarization, the
repolarization is initiated by the outflow of positively charged potassium ions (Al-Khatib et
al., 2003).
With retention of the positively charged ions potassium, sodium and calcium inside the
cardiomyocytes, the repolarization phase of the cardiac action potential extends. Impaired
cardiac repolarization often reveals itself by a prolonged QT interval (Figure 1) in the ECG
(Schwartz, 2012). This generates electrical instability and leads to a propensity toward the
polymorphic ventricular arrhythmia torsade de pointes followed by ventricular fibrillation.
Without immediate defibrillation this can result in SCD (Priori et al., 2001; Roden, 2008).

                            Figure 1: Schematic ECG showing extended QT interval in red.

So far, 15 subtypes of the congenital LQT syndrome have been identified (Table 1).

Table 1: Overview about 15 subtypes of congenital LQTS (adapted from Spears and Gollob, 2015).

LQTS                                                              FUNCTIONAL EFFECT OF
              GENE         PROTEIN AFFECTED                                                           FREQUENCY
SUBTYPES                                                          MUTATION

LQT1          KCNQ1        Alpha-subunit of IKs                   Loss-of-function, reduced IKs       30–35 %

LQT2          KCNH2        Alpha-subunit of IKr                   Loss-of-function, reduced IKr       25–30 %

                                                                  Gain-of-function, increased late
LQT3          SCN5A        Alpha-subunit of INa                                                       5–10 %
                                                                  INa inward current

                           Ankyrin-B; links membrane              Loss-of-function, disrupts
LQT4          ANK2         proteins with underlying               function of multiple ion
II. Introduction
LQTS FUNCTIONAL EFFECT OF
GENE PROTEIN AFFECTED FREQUENCY
SUBTYPES MUTATION
LQT6 KCNE2 Beta-subunit of IKr Loss-of-function, reduced IKrII. Introduction
SIDS cases as well (Skinner, 2005; Tester and Ackerman, 2005; Hunt and Hauck, 2006). This
was first recognized when cases with prolongation of the QT interval in SIDS patients were
reported (Border and Benson, 2007) and mutations in the same genes coding for ion
channels that cause LQT syndrome were discovered in SIDS (Schwartz et al., 2001; Otagiri et
al., 2008). Schwartz et al. (1998) conducted a study from 1976 to 1994, in which ECGs of
33,034 new-borns were screened including follow-up data for one year. 24 out of the
neonates died prospectively from SIDS, who showed with 435±45 ms a longer corrected QT
interval than the survivors with 400±20 ms. While none of the survivors showed a prolonged
QT interval, 12 of the SIDS cases had been measured with ≥440 ms. This increases the risk of
SIDS for an infant with prolonged QT interval by the factor 41.3, which is far greater than any
other established risk factor for SIDS such as sleeping position and environment,
overheating, maternal risk factors and postnatal care (American Academy of Pediatrics,
2016):
• Sleeping position and environment: Prone position has been recognized as a major
risk factor for SIDS (Hauck et al., 2002). Since it is easier for the infant to roll to the
prone position than on its back, side sleeping is considered just as dangerous
(American Academy of Pediatrics, 2005). For both positions, the immediate risk for
the infant is based on rebreathing expired gases resulting in hypercapnia and
hypoxia. In addition, the use of soft bedding, pillows or soft toys have been strongly
associated with an increased risk for SIDS since it can increase the potential of
rebreathing and suffocation (Patel et al., 2001; Kanetake et al., 2003). Epidemiologic
studies of co-sleeping have shown that it can increase risk factors of SIDS such as
rebreathing, head covering, overheating and exposure to tobacco smoke (American
Academy of Pediatrics, 2011). Many parents choose to share their bed anyway
because it facilitates breastfeeding (Horsley et al., 2007).
• Overheating: There is clear evidence, that risk of SIDS is associated with room
temperature and the amount of clothing. This could be due to the higher possibility
of asphyxiation when the number of blankets is raised and also correlates with the
season of the year since infants wear more clothes during the cold weather
(Ponsonby et al., 1992).
• Maternal risk factors: It is quite evident that good pre- and postnatal care can lower
the risk of SIDS (Stewart et al., 1995) as it can increase the infant’s overall chances of
survival. Tobacco smoke, alcohol and other illicit substances are major risk factors for
SIDS, irrespective of the exposure taking place during pregnancy or after birth (Gelfer
and Tatum, 2014).
• Postnatal care: Breastfeeding is protective against SIDS especially when applied
exclusively (Hauck et al., 2011). In addition, routine immunization (Mitchell et al.,
1995) and providing a pacifier for sleeping (Hauck et al., 2005) are by now known to
not in- but decrease the risk of SIDS.
13II. Introduction
SIDS is defined as the sudden and unexpected death of an infant before one year of age
that cannot be explained after a thorough case investigation including scene
examination, autopsy, and review of the clinical history (Willinger et al., 1991). This
disease is regarded as multifactorial and its origin described best with the Triple-Risk
Hypothesis (Figure 2).
Figure 2: Triple-Risk Hypothesis for SIDS (Tester et al., 2018).
This model of the disease development proposes that three conditions have to be fulfilled in
order to provoke SIDS: Dysfunctional or immature cardiorespiratory or arousal systems,
external triggers such as prone position and critical period of development, which represents
the first year of the infant’s life.
After identification of the above risk factors, an organization has been built called Safe to
Sleep campaign, formerly known as the Back to Sleep campaign
rd
(https://safetosleep.nichd.nih.gov/ website accessed on May 3 , 2020). The overall goal of
this campaign was to inform communities, educating caregivers and health care providers
about how to reduce the amount of SIDS cases. Since its beginning in 1994, the SIDS
incidence dropped by more than 50% until 2000. Despite the great success of the campaign,
the SIDS rate remained constant since then (Trachtenberg et al., 2012).
This may be due to the still unknown pathological mechanism. Recent case-control studies
proposed several candidate genes for SIDS, where variants were discovered during post-
mortem genetic screening, that were absent in healthy infants and those dying of other
causes (Hunt and Hauck, 2006):
• Promoter region of serotonin transporter gene (5-HTT)
• Autonomic nervous system development genes (Phox2a, RET, ECE1, TLX3, EN1)
• Genes regulating infection and inflammation (complement C4A/ B, Il-10)
14II. Introduction
Although a lot of progress has been made in identifying predisposing genetic and
environmental factors increasing the probability to these multifactorial and complex
disorders, further research is needed to fully understand the relevant interactions.
2. GENOME-WIDE ASSOCIATION STUDIES
After deeper insight into cardiomyopathies, a significant amount of genetic influence seems
undeniable. SCD and SIDS have proven to be mostly not monogenic but multifactorial and
complex diseases. Unlike Mendelian disorders, which are characterized by a specific
segregation pattern and caused by rare variants with high effect sizes, the different genetic
architecture of quantitative traits limits the success in identification of the responsible
genetic variant(s) by the otherwise effective linkage analysis.
Genome-wide association studies (GWAS) on the other hand qualify highly for the search of
complex disease susceptibility factors. These studies detect association signals between
complex traits and chromosomal location that influence the risk of disease by comparing the
allele frequency in affected and unaffected individuals across the whole genome
(Panoutsopoulou et al., 2013). The way GWAS is set up, it is completely unbiased regarding
previous or expected results (Visscher et al., 2012). Several key developments were required
for GWAS to achieve reproducible and true results:
1. Advances in high throughput genotyping technologies allowed to assay thousands of
common single nucleotide polymorphisms (SNPs) and decreased the per-sample
costs (Manolio and Collins, 2009).
2. The HapMap project typed several million SNPs in 270 individuals providing a
genome-wide database for human genetic variation patterns to be used in genetic
association studies of common diseases (Manolio et al., 2008).
3. The Wellcome Trust Case Control Consortium tested the hypothesis that phenotypes
caused by complex traits are due to common variants demonstrating that robust
associations between genetic loci and traits can be found and that the ‘common
variant hypothesis’ is true (Atanasovska et al., 2015).
GWAS analysis is based on the premise that SNPs within close physical distance are in
linkage disequilibrium (LD) with each other. The HapMap project mapped the LD landscape
and developed a genome-wide set of tag-SNPs, which are tested by GWAS to identify the LD
block with the disease association. However, any LD block only provides information about
the haplotype and pinpoints to the genomic region comprehending the causal variant
without distinguishing between disease-causing and bystander SNPs (Atanasovska et al.,
2015). A thorough functional and mechanistic characterization of the association signal is
necessary to verify the correlation between SNP and phenotype.
Welter et al. (2014) published the actual numbers of GWAS data included in the National
Human Genome Research Institute (NHGRI) Catalog. It mentions 1,751 publications of
11,912 SNPs claiming to have assayed at least 100,000 SNPs. An update was given by
15II. Introduction
MacArthur et al. in 2017, stating that the GWAS data set was containing 2,518 publications
with 24,218 SNPs in September 2016. Recent GWAS data published on their website
(https://www.ebi.ac.uk/gwas website accessed on May 17th, 2020) show analysis of 185,724
SNP-trait associations from 4,545 publications as of May 3rd, 2020. Figure 3 visualizes all
associations detected by GWAS mapping SNPs to the cytogenetic band.
Figure 3: The interactive GWAS diagram visualizes all SNP-trait associations with P < 5.0 x 10⁻⁸, mapped to the SNP’s
cytogenetic band (https://www.ebi.ac.uk/gwas website accessed on May 17th, 2020).
3. GWAS FOR CARDIOMYOPATHIES
The first attempt to identify SNPs associated with the QT interval was performed in 2006 by
Arking et al. on large, population-based cohorts. They corrected the QT interval value for the
known influencing covariates heart rate, age and sex (QTc_RAS). To minimize false positive
findings but maximize power and efficiency of the study, a multiple-stage design approach
was conducted including three stages (Figure 4).
• Stage I: Genotyping of 200 females of the KORA S4 survey with extreme QTc_RAS
values (QT intervals below the 7.5th percentile or above 92.5th percentile)
16II. Introduction
• Stage II: Genotyping of 400 additional women having QTc_RAS below the 15 th or
above the 85th percentile with SNPs that passed stage I
• Stage III: Genotyping of all samples excluding women analysed in stage I and II with
SNPs that passed both previous stages
Figure 4: GWAS of QT interval showing the three-stage study design (Arking et al., 2006).
Three loci with nominal significance (P < 0.05) were identified during stage III:
• NOS1AP (Nitric oxide synthase 1 adaptor protein) on cytoband 1q23.3 with SNP
rs10494366 (P < 10-7): coding for the C-terminal PDZ domain ligand to neuronal nitric
oxide synthase
• QTc_5.3 GeneScan prediction (Burge and Karlin, 1997) with SNP rs1559578
(P < 0.004): non-coding
• CACNA2D1 on cytoband 7q21.11 with SNP rs7341478 (P < 0.024): coding for an
L-type voltage-dependent calcium channel regulatory subunit
These results were further validated by genotyping 2,646 samples of the KORA F3 cohort as
well as 1,805 participants from the Framingham Heart Study for seven SNPs from stage III.
Both independent cohorts were able to replicate the association signal for rs10494366 in
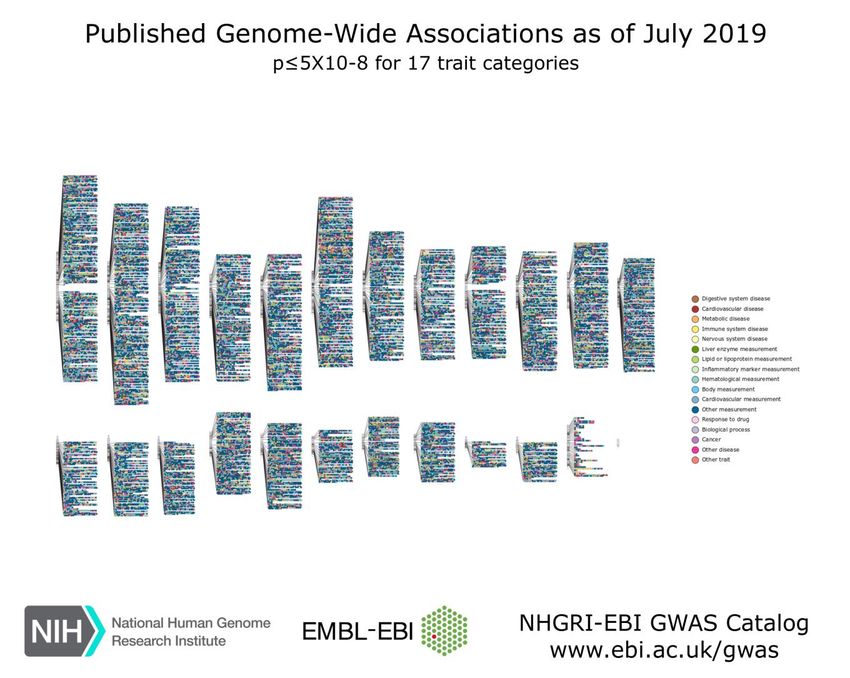
NOS1AP. After fine-scale association mapping of the NOS1AP locus by genotyping 13 SNPs in
the 600 stage II samples, the strongest association was found in the 5’ upstream region of
the NOS1AP gene (rs4657139), although there was a very strong association detectable in
the entire area between rs10494366 and rs2880058 (Figure 5).
17II. Introduction
Figure 5: Fine mapping of NOS1AP showing LD between SNPs. Each value in the diamonds corresponds to
pairwise correlation signals between SNPs, also represented in the shading of the fields. Fields without a
number represent a signal of 1. NOS1AP exons 1 and 2 are shown in orange (Arking et al., 2006).
The identification of NOS1AP, a gene with unknown and unsuspected involvement in the
QT interval variation, is supposed to explain 1.5% of the QT variance. This association of
NOS1AP and QT interval variation was replicated in several more studies (Aarnoudse et al.,
2007; Post et al., 2007; Tobin et al., 2008).
These GWASs of the QT interval were followed by a meta-analysis of the combined results by
Pfeufer et al. (2009). In this QTSCD study (study about QT interval and sudden cardiac
death), the five population-based cohorts ARIC (Atherosclerosis Risk in Communities; Dekker
et al., 2004), KORA (Kooperative Gesundheitsforschung in der Region Augsburg; Wichmann
et al., 2005), SardiNIA (Sardinian population cohort; Pilia et al., 2006), GenNOVA (Genetic
Epidemiology Network of Atherosclerosis; Pattaro et al., 2007) and HNR (Heinz Nixdorf
Recall Study; Schmermund et al., 2002) were analysed including a total of 15,847 individuals.
They were able to identify ten association signals across the genome (Figure 6).
Figure 6: Manhattan Plot of genome-wide association analyses. The threshold for genome-wide significance is marked by
the blue dotted line (5 × 10⁻⁸). SNPs within loci exceeding this threshold are highlighted in green (Pfeufer et al., 2009).
18II. Introduction
Four loci near the monogenic LQT genes KCNQ1, KCNH2, SCN5A and KCNJ2 as well as two
loci near genes with known electrophysiological function ATP1B1 and PLN were identified. In
addition, three new loci that map to RNF207, LITAF and GINS3-NDRG4-SETD6-CNOT1 were
found without an obvious candidate for cardiovascular disease. The strongest main
association signal maps to the NOS1AP locus, which is consistent with the previous GWAS
finding (Arking et al., 2006). This signal derives from SNP rs12143842. A second, independent
signal at rs4657178 showed low LD to the main signal. The whole chromosomal region
1q23.3 harbours several variants independently contributing to the overall effect (Figure 7).
Figure 7: Association results at locus 1q23.3 spanning ± 600 kb around each SNP. The
SNPs are coloured according to their LD; the leading variant is highlighted with a blue
square, while SNPs representing independent signals from the leading variant are
highlighted with a purple diamond. Gene transcripts are annotated in the lower box
indicating the direction of transcription by ‘+’ or ‘-‘ (Pfeufer et al., 2009).
While some of the SNPs are located within the genetic region of NOS1AP, others map to the
Olfactomedin-like 2B (OLFML2B) gene. No coding SNP within NOS1AP or OLFML2B has been
identified to be responsible for this association, pinpointing to a regulatory haplotype effect
in the intergenic region. 1.0% of the variation in duration of the QT interval was explained by
the NOS1AP SNP rs12143842 alone. Inclusion of all nine newly identified main association
signals increases this to a rate of 3.3%.
Another study composed of 13,685 individuals with an independent yet similar meta-
analysis by the QTGEN consortium (Newton-Cheh et al., 2009) was published at the same
time. By comparing the results of the two studies, all association signals found in the QTSCD
study were replicated by the QTGEN study.
In conclusion, the genome-wide data collected in these studies suggest a high association of
the chromosomal region 1q23.3 with the QT interval and a strong focus on the NOS1AP
gene.
19II. Introduction
4. THE OLFACTOMEDINS
Due to the absence of SIDS cases correlated with mutations in NOS1AP and the investigation
of this gene by Dr. Chakravarti together with his workgroup at the Johns Hopkins University
School of Medicine in Baltimore (Kapoor et al., 2014), this study focused on the OLFML2B
gene.
OLFML2B belongs to the protein family of ten olfactomedins, which all share an
olfactomedin domain at their c-terminal region. This family was discovered during a study
for identification of novel proteins involved in olfaction (Anholt et al., 1990). The first
glycoprotein found was characterized by Snyder et al. (1991) and named ‘olfactomedin’.
Karavanich and Anholt (1998) showed the widespread occurrence of olfactomedins among
vertebrates and invertebrates with extensive homologies throughout the protein indicating a
function of universal importance. OLFML2A (photomedin-1) and OLFML2B (photomedin-2)
were discovered during a search for extracellular matrix (ECM) proteins. The basic domain
structure of the proteins (Figure 8) was demonstrated as well as their ability to secrete into
the extracellular space, which enables them to bind to the ECM components heparin and
chondroitin sulphate-E. They also share the ability to form disulphide-bonded homodimers
and oligomers (Furutani et al., 2005).
Figure 8: Schematic domain structure showing photomedin-1 (OLFML2A) and photomedin-2
(OLFML2B). Signal sequences (labelled ‘Pre’) and Ser/Thr-rich regions are shaded dark and light
grey respectively; regions containing CXC motifs including CXCXCX 9C motifs are indicated by white
boxes, coiled-coil domains by hatched boxes, and olfactomedin domains by black boxes displaying
the sequence homologies between photomedin-1 and photomedin-2 below (Furutani et al., 2005).
In contrast to that, the structure of OLFML2B described on UniProt slightly differs: OLFML2B
shows an n-terminal signal peptide from amino acid (aa) 1 to 22, coiled-coil sequences from
aa 40 to 68 as well as from aa 179 to 213 and ends with the c-terminal olfactomedin domain
from aa 493 to 750. Post-translational modifications include O-glycosylation and N-
glycosylation (https://www.uniprot.org/uniprot/Q68BL8 website accessed on May 3rd,
2020).
Phylogenetic analyses by Zeng et al. (2005) have categorized proteins containing the
conserved olfactomedin domain into seven evolutionary distinct subfamilies. Those families
were grouped by similar structural and functional characteristics with focus on the
coevolved and interdependent domains. OLFML2A and OLFML2B were classified as
members of subfamily IV. Though both proteins show similar expression patterns, OLFML2B
20II. Introduction
exhibits a broader spectrum of tissue specificity as it was detected in every human tissue but
brain, certain cells, oesophagus (mucosa), liver, pancreas and stomach (Figure 9).
Figure 9: Gene expression of OLFML2B in human tissue (https://gtexportal.org/home/gene/OLFML2B website accessed
on May 3rd, 2020).
Nine paralogs of OLFML2B have been identified in the human genome. While the four
olfactomedins OLFML1, OLFML2A, OLFML2B and OLFML3 were not analysed for their
functions yet, six are already identified to correlate with diseases (Table 2).
Table 2: Overview of olfactomedins and their functions.
AFFECTED PATHWAYS/
OLFACTOMEDIN GENE DISEASES
PHENOTYPES
GLIOMEDIN GLDN Nodes of Ranvier formation Neurologic diseases
Primary open angle glaucoma
MYOCILIN (TIGR) MYOC Eye determination (ciliary muscle)
(POAG)
OLFACTOMEDIN 1
OLFM1 Cell proliferation Lung adenocarcinoma
(NOELIN 1, PANCORTIN)
OLFACTOMEDIN 2
OLFM2 Neuronal differentiation Open angle glaucoma
(NOELIN 2)
OLFACTOMEDIN 3 OLFM3 Cell proliferation Endothelioma
Gastric, colon, breast, lung and
OLFACTOMEDIN 4 OLFM4 Cell proliferation
pancreatic cancer
Gliomedin is involved in generating and maintaining the clustering of sodium channels at the
nodes of Ranvier to ensure the saltatory conduction (Eshed et al., 2007; Feinberg et al.,
2010; Eshed-Eisenbach and Peles, 2013; Amor et al., 2014). Node of Ranvier disruption
21II. Introduction
seems to be the cause of many neurologic diseases (Susuki, 2013). In 1997, Myocilin was first
implicated by Stone et al. with primary open angle glaucoma (Adam et al., 1997).
Olfactomedin 1 has been linked to lung adenocarcinoma (Wu et al., 2010), Olfactomedin 2 to
open angle glaucoma (Funayama et al., 2006) and Olfactomedin 3 to endothelioma
(Miljkovic-Licina et al., 2012), whereas Olfactomedin 4 is believed to cause several types of
cancer, among them gastric (Oue et al., 2009), colon, breast, lung (Koshida et al., 2007) and
pancreatic cancer (Kobayashi et al., 2007).
It appears that olfactomedins play essential roles in development and cell differentiation.
Mutations, especially in the evolutionary highly conserved olfactomedin domain, are
associated with many common diseases including glaucoma and several types of cancer
(Anholt, 2014). Though there has been a lot of progress in identifying and characterizing
olfactomedin family members, the physiological function of OLFML2B remains elusive.
5. AIMS OF THE STUDY
The objective of this study was to detect a potential connection between the OLFML2B gene
and QT interval prolongation in order to explain one of the causes for atrial (AF) and
ventricular arrhythmias (LQT), dilated cardiomyopathy (DCM) and sudden infant death
syndrome (SIDS). In detail, the following projects have been conducted:
(1) Detection of OLFML2B in human heart tissue.
(2) Characterization of wildtype and mutant OLFML2B proteins including protein stability
and structure as well as secretional status in HEK293 cells.
(3) Cultivation at different temperatures and subsequent analysis of the secretion to
elucidate the stability of the protein and the influence of fever and hypothermia.
(4) Co-expression of wildtype and mutant protein to determine a possible dominant
effect of OLFML2B.
(5) Detection and characterization of antibody binding sites by LC-MSMS.
(6) Mass spectrometry analyses with synthetic OLFML2B protein for identification of
intra- and extracellular protein-protein interaction (PPI) partners and follow-up of
most likely PPIs.
(7) Validation of a sandwich ELISA for OLFML2B protein to generate a biomarker that can
be used to test serum of affected patients for insufficiency or arrhythmogenic
predisposition.
22III. Material and Methods
III. MATERIAL AND METHODS
1. MATERIAL
1.1. COHORTS
We investigated individuals with a diverse set of cardiac conditions for mutations in
OLFML2B including cohorts of patients with long-QT syndrome (LQTS), atrial fibrillation (AF),
dilative cardiomyopathy (DCM) and sudden infant death syndrome (SIDS) as well as a control
study population (Table 3).
Table 3: Patient and control cohorts.
NUMBER OF
DISEASE COHORT CENTERS
INDIVIDUALS
Klinikum der Universität München, Großhadern, Université de Nantes and
125 LQTS
University Medical Center Amsterdam
92 AF Klinikum der Universität München, Großhadern
94 DCM Klinikum der Universität München, Großhadern
SIDS (all patients German Study on Sudden Infant Death, forensic medicine department of
93 died within the the Ludwig-Maximilians-Universität München and Sheffield Children’s
first year of life) Hospital, UK
Non-Finnish European descent from the ExAC (Exome aggregation
consortium; Lek et al., 2016) accessible through the Genome Aggregation
141,456 Control
Database (gnomAD; https://gnomad.broadinstitute.org/ website accessed
on May 5th, 2020)
1.2. MOLECULAR BIOLOGY
The Escherichia coli strain XL1-Blue supercompetent cells by Stratagene (La Jolla, USA) and
oligonucleotides provided by Metabion (Martinsried, Germany) were used for cloning of
OLFML2B cDNA (NM_015441.2). To design primers for cDNA amplification, the ExonPrimer
software based on Primer3 according to hg18 was applied (Table 4).
Table 4: Nucleotide sequence of primers.
PRIMER SEQUENCE APPLICATION
OLFML2B-CDNA-F 5’ - CCCCAGCCATTCTCTGAAGG - 3’ qPCR
OLFML2B-CDNA-R 5’ - TTCTGCTTGTGGGGACAAGG - 3’ qPCR
GAPDH-CDNA-F 5’ - TCCTCTGACTTCAACAGCGA - 3’ qPCR
GAPDH-CDNA-R 5’ - GGGTCTTACTCCTTGGAGGC - 3’ qPCR
OLFML2B_SEQ_118_F 5´- tgcggaggacgagactctg - 3´ Sequencing
OLFML2B_SEQ_217_R 5´- agccctcagacazagccttg - 3´ Sequencing
23III. Material and Methods
PRIMER SEQUENCE APPLICATION
OLFML2B_SEQ_340_F 5´- tgcaagtgtgcctgtgatgc - 3´ Sequencing
OLFML2B_SEQ_389_R 5´- ctcgcaggattgaggg - 3´ Sequencing
OLFML2B_SEQ_704_F 5´- cagcctagcccacccagag - 3´ Sequencing
OLFML2B_SEQ_1077_F 5´- tgtgacaagcgacctgaaca – 3 Sequencing
OLFML2B_SEQ_1487_F 5´- acactctctccacaatcacg - 3´ Sequencing
OLFML2B_SEQ_1945_F 5´- agcaagctcaatgccgc - 3´ Sequencing
OLFML2B_QC_WT_A12S_F 5´ - tgctagttctctacttctctctgattgtggttccg - 3´ Site directed mutagenesis
OLFML2B_QC_WT_A12S_R 5´- cggaaccacaatcagagagaagtagagaactagca - 3` Site directed mutagenesis
OLFML2B_QC_WT_V15G_F 5´- cttcgctctgattggggttccggcctggg - 3´ Site directed mutagenesis
OLFML2B_QC_WT_V15G_R 5´- cccaggccggaaccccaatcagagcgaag - 3´ Site directed mutagenesis
OLFML2B_QC_WT_R347W_F 5´- gaccagtgtcacctggaggcctgcagc - 3' Site directed mutagenesis
OLFML2B_QC_WT_R347W_R 5´- gctgcaggcctccaggtgacactggtc - 3´ Site directed mutagenesis
OLFML2B_QC_WT_R353H_F 5´- cctgcagccacccatcagggacacagc - 3´ Site directed mutagenesis
OLFML2B_QC_WT_R353H_R 5´- gctgtgtccctgatgggtggctgcagg - 3´ Site directed mutagenesis
OLFML2B_QC_WT_A436S_F 5´- cccagctcctccgtcagtgtctcccag - 3´ Site directed mutagenesis
OLFML2B_QC_WT_A436S_R 5´- ctgggagacactgacggaggagctggg - 3´ Site directed mutagenesis
OLFML2B_QC_WT_P504L_F 5´- cacaatcacggggctgaccacccagaacac - 3´ Site directed mutagenesis
OLFML2B_QC_WT_P504L_R 5´ - gtgttctgggtggtcagccccgtgattgtg - 3´ Site directed mutagenesis
OLFML2B_QC_WT_G515E_F 5´- catatgggcggaatgaagaggcctggatgaaccaccc - 3´ Site directed mutagenesis
OLFML2B_QC_WT_G515E_R 5´-gggtccttcatccaggcctattcattccacccatatg - 3´ Site directed mutagenesis
OLFML2B_QC_WT_R527Q_F 5´- gaagaggcctggatgatgaaggaccc - 3´ Site directed mutagenesis
OLFML2B_QC_WT_R527Q_R 5´- gggtccttcatcatccagcctcttc - 3´ Site directed mutagenesis
OLFML2B_QC_WT_Y557H_F 5´- cgctggagcaattcccacaagctcccgtaca - 3´ Site directed mutagenesis
OLFML2B_QC_WT_Y557H_R 5´- tgtacgggagcttgtgggaattgctccagcg - 3´ Site directed mutagenesis
OLFML2B_QC_WT_V604M_F 5´- ccatgctgcatgacatggcctacgaggag - 3´ Site directed mutagenesis
OLFML2B_QC_WT_V604M_R 5´- ctcctcgtaggccatgtcatgcagcatgg - 3´ Site directed mutagenesis
OLFML2B_QC_WT_N690S_F 5´- gccgtggacagctacagccagcggaatgccaac - 3´ Site directed mutagenesis
OLFML2B_QC_WT_N690S_R 5´- gttggcattccgctggctgtagctatccacggc - 3´ Site directed mutagenesis
All clones were inserted into the mammalian expression vector pcDNA3.0 by Invitrogen
(Carlsbad, USA). The following OLFML2B variants were generated as cDNA clones (Table 5).
24III. Material and Methods
Table 5: OLFML2B cDNA clones (AF: atrial fibrillation, DCM: dilated cardiomyopathy, LQTS: long-QT syndrome, SIDS:
sudden infant death syndrome).
PROTEIN VARIANT ORIGIN FROM
CDNA VECTOR
PROTEIN CDNA GENOME (HG19) PATIENT WITH
Wildtype - Common OLFML2B pcDNA3.0
A12S c.34C>A 1-161993187-C-A DCM OLFML2B pcDNA3.0
V15G c.44T>G 1-161993177-A-C AF OLFML2B pcDNA3.0
R86W c.256C>T 1-161989891-G-A LQT OLFML2B pcDNA3.0
S113L c.338C>T 1-161989809-G-A LQT OLFML2B pcDNA3.0
T149A c.445A>G 1-161987291-T-C LQT OLFML2B pcDNA3.0
L269P c.806T>C 1-161970046-A-G Common OLFML2B pcDNA3.0
P289L c.866C>T 1-161969986-G-A Common OLFML2B pcDNA3.0
R347W c.1039G>A 1-161968050-G-A LQT OLFML2B pcDNA3.0
R353H c.1058G>A 1-161968031-C-T LQT OLFML2B pcDNA3.0
R367W c.1099C>T 1-161967990-G-A AF OLFML2B pcDNA3.0
S379L c.1136C>T 1-161967953-G-A DCM OLFML2B pcDNA3.0
S384R c.1152C>G 1-161967937-G-C LQT OLFML2B pcDNA3.0
A436S c.1306G>T 1-161967783-C-A AF OLFML2B pcDNA3.0
T456I c.1367C>T 1-161967722-G-A DCM OLFML2B pcDNA3.0
W470R c.1408T>C 1-161967681-A-G Common OLFML2B pcDNA3.0
P504L c.1512G>T 1-161954734-G-A SIDS OLFML2B pcDNA3.0
G515E c.1544G>A 1-161954701-C-T SIDS OLFML2B pcDNA3.0
R527Q c.1580G>A 1-161954665-C-T LQT OLFML2B pcDNA3.0
G536S c.1606G>A 1-161954639-C-T SIDS OLFML2B pcDNA3.0
Y557H c.1669T>C 1-161954049-A-G SIDS OLFML2B pcDNA3.0
V604M c.1810G>A 1-161953908-C-T DCM OLFML2B pcDNA3.0
G674D c.2021G>A 1-161953697-C-T SIDS OLFML2B pcDNA3.0
N690S c.2069A>G 1-161953649-T-C AF OLFML2B pcDNA3.0
1.3. CELL CULTURE
Human embryonic kidney cells HEK293 were used for cell culture (DSMZ, Braunschweig,
Germany).
25III. Material and Methods
1.4. HUMAN HEART TISSUE
All cardiac tissue used in this study was retrieved from the Klinikum der Universität
München, Großhadern.
1.5. ANTIBODIES
The commercial primary antibodies listed in Table 6 were used in various applications in this
study.
Table 6: Commercial primary antibodies.
PRIMARY ANTIBODY SPECIES, CLONALITY DILUTION COMPANY
ANTI-FLAG-M2 Mouse, monoclonal 1:1,000 Sigma-Aldrich, St. Louis, MO, USA
ANTI-FLAG-6F7 Rat, monoclonal 1:10 HMGU
Santa Cruz Biotechnology, Dallas,
ANTI-TENASCIN C (E-9) Mouse, monoclonal 1:100
Texas, USA
ANTI-TENASCIN C Rabbit, polyclonal 0.5 μg/ml Merck KGaA, Darmstadt, Germany
Thermo Fisher Scientific, Waltham,
ANTI-TENASCIN C (4C8mS) Mouse, monoclonal 1:200-1:1,000
Massachusetts
Thermo Fisher Scientific, Waltham,
ANTI-TENASCIN C (BC-24) Mouse, monoclonal 2-4 µg/ml
Massachusetts
Monoclonal antibodies had previously been generated by peptide vaccination in rat or
mouse with the peptide sequences described in Table 7.
Table 7: Peptide sequence of self-generated primary antibodies.
PEPTIDE PEPTIDE SEQUENCE AMINO ACID LENGTH
OLF1 n-TSEPPDAQTVAPAEDETLQNC-c 28 to 48 21 aa
OLF2 n-EDMEEIRTEMNKRGKENC-c 197 to 214 18 aa
FUSION GST fused to n-(GS)TTSVSPDPTRESVLQPSPQVPATTVAHTA
397 to 464 68 aa
PEPTIDE TQQPAAPAPPAVSPREALMEAMHTVPVPPTTVRTDSLGK(S)-c
CDNA entire OLFML2B 1 to 750 750 aa
All antibodies listed below were available as culture supernatant, purified (Western Blot, Dot
blot analysis) and 25% or 50% biotinylated (ELISA). They were raised against the following
antigens (Table 8).
26III. Material and Methods
Table 8: Self-generated primary hybridoma cell line antibodies.
HYBRIDOMA CELL SPECIES, IGG DILUTION FOR DILUTION FOR
PEPTIDE
LINE ANTIBODY CLONALITY CLASS SDS-PAGE ELISA
7C4 Rat, monoclonal IgG2a OLF1 1:10 250ng/ 1:10,000
7B9 Rat, monoclonal IgG2c OLF2 1:10 250ng/ 1:10,000
5A5 Rat, monoclonal IgG2a OLF2 1:10 250ng/ 1:10,000
6B11 Rat, monoclonal IgG1 OLF2 1:10 250ng/ 1:10,000
5D8 Rat, monoclonal IgG2a cDNA 1:10 250ng/ 1:10,000
6B1 Rat, monoclonal IgG2a OLF2 1:10 250ng/ 1:10,000
7E9 Rat, monoclonal IgG2a OLF2 1:10 250ng/ 1:10,000
8B10 Rat, monoclonal IgG2a cDNA 1:10 250ng/ 1:10,000
2E9 Mouse, monoclonal IgG1 Fusion Peptide 1:10 250ng/ 1:10,000
7D7 Mouse, monoclonal IgG1 Fusion Peptide 1:10 250ng/ 1:10,000
1E8 Mouse, monoclonal IgG2a Fusion Peptide 1:10 250ng/ 1:10,000
6D1 Mouse, monoclonal IgG2a Fusion Peptide 1:10 250ng/ 1:10,000
7A12 Mouse, monoclonal IgG2a Fusion Peptide 1:10 250ng/ 1:10,000
4C2 Mouse, monoclonal IgG2b Fusion Peptide 1:10 250ng/ 1:10,000
Anti-OLFML2B monoclonal antibodies producing hybridoma cell lines have been provided by
HMGU, Institute for Molecular Immunology, Dr. Elisabeth Kremmer.
For detection of the antigen-antibody-complex, a secondary antibody was applied (Table 9).
Table 9: Secondary antibodies.
SECONDARY ANTIBODY DILUTION COMPANY
GOAT ANTI-MOUSE HRP 1:20,000 Dianova, Hamburg, Germany
RAT ANTI-MOUSE HRP 1:400 HMGU
RAT ANTI-MOUSE IGG1 HRP 1:1,000 HMGU
RAT ANTI-MOUSE IG2A HRP 1:1,000 HMGU
RAT ANTI-MOUSE IG2B HRP 1:1,000 HMGU
RABBIT ANTI-MOUSE HRP 1:150,000 Dianova, Hamburg, Germany
GOAT ANTI-RAT HRP 1:20,000 Dianova, Hamburg, Germany
MOUSE ANTI-RAT HRP 1:400 HMGU
MOUSE ANTI-RAT IGG1 HRP 1:1,000 HMGU
27III. Material and Methods
SECONDARY ANTIBODY DILUTION COMPANY
MOUSE ANTI-RAT IG2A HRP 1:1,000 HMGU
MOUSE ANTI-RAT IG2C HRP 1:1,000 HMGU
RABBIT ANTI-RAT 1:20,000 Dianova, Hamburg, Germany
GOAT ANTI-RABBIT 1:100,000 Dianova, Hamburg, Germany
AVIDIN HRP 1:4,000 HMGU
1.6. LABORATORY CHEMICALS AND REAGENTS
The chemicals and reagents listed in Table 10 were used in this study.
Table 10: Chemicals and reagents.
DEVICE APPLICATION COMPANY
Thermo Fisher Scientific, Waltham,
1-STEP™ ULTRA TMB-ELISA Dot blot, ELISA
Massachusetts
Fluka, Sigma-Aldrich, Taufkirchen,
5% SKIM MILK POWDER SDS-PAGE, ELISA
Germany
AMERSHAM™ ECL™ PRIME SDS-PAGE GE Healthcare, Freiburg, Germany
ANTI-FLAG M2 AFFINITY GEL Protein purification Sigma-Aldrich, Taufkirchen, Germany
BORIC ACID Molecular cloning Sigma-Aldrich, Taufkirchen, Germany
BSA (BOVINE SERUM ALBUMIN) Protein purification Sigma-Aldrich, Taufkirchen, Germany
Roche Diagnostics GmbH, Mannheim,
C0MPLETE TABLETS EASYPACK Cell culture
Germany
Thermo Fisher Scientific, Waltham,
COOMASSIE BRILLIANT BLUE G-250 DYE Mass spectrometry
Massachusetts
DMEM (DULBECCO’S MODIFIED EAGLE
Cell culture Gibco, Invitrogen, Carlsbad, USA
MEDIUM – HIGH GLUCOSE)
Thermo Fisher Scientific, Waltham,
DOUBLE DISTILLED WATER (DDH2O) SDS-PAGE
Massachusetts
EDTA (ETHYLENEDIAMINETETRAACETIC
Cell culture Sigma-Aldrich, Taufkirchen, Germany
ACID)
FBS (FETAL BOVINE SERUM) Cell culture Gibco, Invitrogen, Carlsbad, USA
Agarose gel Thermo Fisher Scientific, Waltham,
GENERULER 100 BP DNA LADDER
electrophoresis Massachusetts
GLYCEROL Molecular Cloning Sigma-Aldrich, Taufkirchen, Germany
H2O Cell culture Biochrom, Berlin, Germany
28III. Material and Methods
DEVICE APPLICATION COMPANY
HEPES BUFFER 1M (4-(2-HYDROXYETHYL)-1-
Protein purification Biochrom, Berlin, Germany
PIPERAZINEETHANESULFONIC ACID)
HIMARK™ PRE-STAINED PROTEIN Thermo Fisher Scientific, Waltham,
SDS-PAGE
STANDARD Massachusetts
HUMAN TENASCIN-C PURIFIED PROTEIN SDS-PAGE Merck KGaA, Darmstadt, Germany
LIPOFECTAMINE® LTX & PLUS™ REAGENT Cell culture Invitrogen, Carlsbad, USA
L-GLUTAMINE Cell culture Gibco, Invitrogen, Carlsbad, USA
MAGICMARK™ XP WESTERN PROTEIN
SDS-PAGE Invitrogen, Carlsbad, USA
STANDARD
MES (2-(N-MORPHOLINO)ETHANESULFONIC
Cell culture Carl Roth, Karlsruhe, Germany
ACID)
Roche Diagnostics GmbH, Mannheim,
NP-40 (NONIDENT-40) Cell culture
Germany
NUPAGE® NOVEX ANTIOXIDANT SDS-PAGE Invitrogen, Carlsbad, USA
NUPAGE® NOVEX REDUCING AGENT (10X) SDS-PAGE Invitrogen, Carlsbad, USA
NUPAGE® NOVEX LDS (LITHIUM DODECYL
SDS-PAGE Invitrogen, Carlsbad, USA
SULFATE) SAMPLE BUFFER
PBS (PHOSPHATE BUFFERED SALINE) Cell culture Gibco, Invitrogen, Carlsbad, USA
PENICILLIN-STREPTOMYCIN Cell culture Gibco, Invitrogen, Carlsbad, USA
Roche Diagnostics GmbH, Mannheim,
PHOSSTOP Cell culture
Germany
PONCEAU S SOLUTION SDS-PAGE Sigma-Aldrich, Taufkirchen, Germany
PRECISION PLUS PROTEIN STANDARD,
Mass spectrometry BioRad, Munich, Germany
UNSTAINED
PROTEIN G CONJUGATED SEPHAROSE
Protein purification Sigma-Aldrich, Taufkirchen, Germany
BEADS
SODIUM CHLORIDE Protein isolation Sigma-Aldrich, Taufkirchen, Germany
SODIUM HYDORXIDE Protein isolation Sigma-Aldrich, Taufkirchen, Germany
CANDOR Bioscience GmbH, Wangen,
STRIPPING BUFFER Protein isolation
Germany
SULFURIC ACID ELISA Sigma-Aldrich, Taufkirchen, Germany
RNA reverse
SUPERSCRIPT III REVERSE TRANSCRIPTASE Invitrogen, Carlsbad, USA
transcription
TRIS (TRIS(HYDROXYMETHYL)
Molecular Cloning Calbiochem, San Diego, USA
AMINOMETHANE)
29III. Material and Methods
DEVICE APPLICATION COMPANY
Thermo Fisher Scientific, Waltham,
TRIZOL™ REAGENT RNA isolation
Massachusetts
TRYPSIN Cell culture Gibco, Invitrogen, Carlsbad, USA
TURBO™ DNASE RNA purification Invitrogen, Carlsbad, USA
1.7. KITS
For better reproducibility and standardization of laboratory work, the molecular biology kits
specified in Table 11 were used.
Table 11: Molecular biology kits.
DEVICE APPLICATION COMPANY
AMERSHAM ECL PRIME WESTERN BLOTTING
Western blot GE Healthcare, Freiburg, Germany
DETECTION REAGENT
COMPAT-ABLETM PROTEIN ASSAY Thermo Fisher Scientific, Waltham,
Protein purification
PREPARATION REAGENT SET Massachusetts
Plasmid DNA
ENDOFREE PLASMID MAXI KIT (10) Qiagen, Hilden, Germany
purification
Plasmid DNA
PERFECTPREP PLASMID MINI Eppendorf, Hamburg, Germany
isolation
QIAAMP DNA BLOOD MINI KIT (50) DNA purification Qiagen, Hilden, Germany
Plasmid DNA
QIAFILTER PLASMID MIDI KIT (25) Qiagen, Hilden, Germany
purification
QIAQUICK GEL EXTRACTION KIT (50) DNA purification Qiagen, Hilden, Germany
QUIKCHANGE II XL SITE-DIRECTED Site-directed
Agilent, Santa Clara, USA
MUTAGENESIS KIT mutagenesis
Plasmid DNA
QUICKLYSE MINIPREP KIT (100) Qiagen, Hilden, Germany
isolation
Protein Thermo Fisher Scientific, Waltham,
PIERCE™ BCA PROTEIN ASSAY KIT
concentration Massachusetts
PROTEOEXTRACT® SUBCELLULAR
Protein purification Merck KGaA, Darmstadt, Germany
PROTEOME EXTRACTION KIT
SYBR SELECT MASTER MIX qPCR Applied Biosystems, Foster City, USA
30You can also read