Generating landslide density heatmaps for rapid detection using open-access satellite radar data in Google Earth Engine
←
→
Page content transcription
If your browser does not render page correctly, please read the page content below
Nat. Hazards Earth Syst. Sci., 22, 753–773, 2022
https://doi.org/10.5194/nhess-22-753-2022
© Author(s) 2022. This work is distributed under
the Creative Commons Attribution 4.0 License.

Generating landslide density heatmaps for rapid detection using
open-access satellite radar data in Google Earth Engine
Alexander L. Handwerger1,2 , Mong-Han Huang3 , Shannan Y. Jones3 , Pukar Amatya4,5,6 , Hannah R. Kerner7 , and
Dalia B. Kirschbaum6
1 Joint Institute for Regional Earth System Science and Engineering,
University of California, Los Angeles, Los Angeles, CA, USA
2 Jet Propulsion Laboratory, California Institute of Technology, Pasadena, CA, USA
3 Department of Geology, University of Maryland, College Park, MD, USA
4 University of Maryland, Baltimore County, Baltimore, MD, USA
5 Goddard Earth Sciences Technology and Research II, Baltimore, MD, USA
6 Hydrological Sciences Laboratory, NASA Goddard Space Flight Center, Greenbelt, MD, USA
7 Department of Geography, University of Maryland, College Park, MD, USA

Correspondence: Alexander L. Handwerger (alexander.handwerger@jpl.nasa.gov)
and Mong-Han Huang (mhhuang@umd.edu)

Received: 1 October 2021 – Discussion started: 19 October 2021
Revised: 28 January 2022 – Accepted: 28 January 2022 – Published: 9 March 2022

Abstract. Rapid detection of landslides is critical for emer-    1   Introduction
gency response, disaster mitigation, and improving our un-
derstanding of landslide dynamics. Satellite-based synthetic     Rapid response to landslide events (and other natural haz-
aperture radar (SAR) can be used to detect landslides, of-       ards) is necessary to assess damage and save lives. This
ten within days of a triggering event, because it penetrates     response effort includes ground-based teams of local resi-
clouds, operates day and night, and is regularly acquired        dents, government officials and logistics coordinators, scien-
worldwide. Here we present a SAR backscatter change ap-          tists, engineers, and more, all working together to identify
proach in the cloud-based Google Earth Engine (GEE) that         critically damaged areas (e.g., Benz and Blum, 2019; Inter-
uses multi-temporal stacks of freely available data from the     Agency Standing Committee, 2015). Yet, many response ef-
Copernicus Sentinel-1 satellites to generate landslide density   forts are impeded by a lack of detailed information on the
heatmaps for rapid detection. We test our GEE-based ap-          condition or location of damaged areas following large and
proach on multiple recent rainfall- and earthquake-triggered     widespread landslide events (Lacroix et al., 2018; Robinson
landslide events. Our ability to detect surface change from      et al., 2019). In addition to rapid response efforts, it is also
landslides generally improves with the total number of SAR       important to construct accurate landslide inventories in the
images acquired before and after a landslide event, by com-      weeks to months following these events (Froude and Pet-
bining data from both ascending and descending satellite         ley, 2018; Roback et al., 2018; Williams et al., 2018). These
acquisition geometries and applying topographic masks to         detailed inventories are used to improve understanding of
remove flat areas unlikely to experience landslides. Impor-      where landslides occur; to quantify erosion; and to look for
tantly, our GEE approach does not require downloading a          areas where secondary hazards, such as outburst flooding
large volume of data to a local system or specialized pro-       due to landslide dams, may be occurring (Collins and Jib-
cessing software, which allows the broader hazard and land-      son, 2015; Kirschbaum et al., 2015; Kirschbaum and Stan-
slide community to utilize and advance these state-of-the-art    ley, 2018; Roback et al., 2018). It is therefore necessary to
remote sensing data for improved situational awareness of        develop tools with freely available data that can be used to
landslide hazards.                                               map the landslide extent and level of damage following catas-
                                                                 trophic events.

Published by Copernicus Publications on behalf of the European Geosciences Union.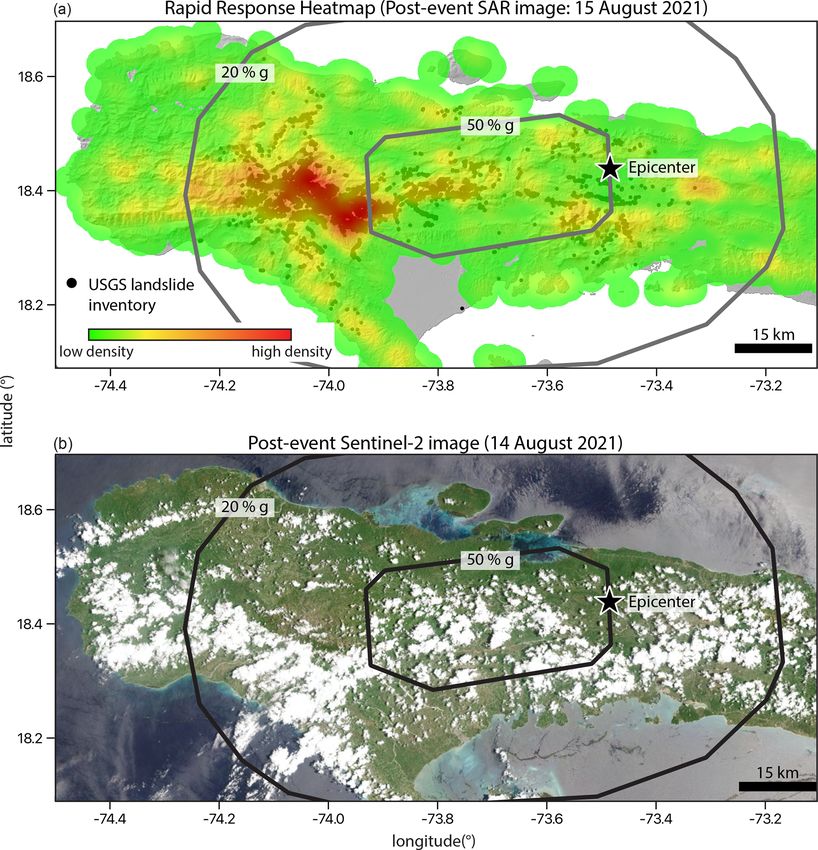
754                                   A. L. Handwerger et al.: Generating landslide density heatmaps for rapid detection

   Remote sensing techniques are commonly used to con-            a landslide event (Burrows et al., 2020; Inter-Agency Stand-
struct landslide inventories over large areas following catas-    ing Committee, 2015; Williams et al., 2018). Our tools run in
trophic events (e.g., Bessette-Kirton et al., 2019; Roback        Google Earth Engine (GEE), a free cloud-based online plat-
et al., 2018). Satellite-based optical imagery provides high-     form, using only freely available data (Gorelick et al., 2017).
quality information for landslide mapping. Many studies           Recent studies have used GEE to identify floods (e.g., De-
have leveraged these data with manual (e.g., Harp and Jib-        Vries et al., 2020) and landslides (e.g., Scheip and Wegmann,
son, 1996; Massey et al., 2020) and semi-automated and/or         2021), investigate land cover (e.g., Huang et al., 2017a) and
automated mapping techniques to identify landslides (e.g.,        surface water change (e.g., Donchyts et al., 2016), monitor
Amatya et al., 2019, 2021; Ghorbanzadeh et al., 2019; Höl-        agriculture (e.g., Dong et al., 2016), and more. For landslide
bling et al., 2015; Lu et al., 2019; Mondini et al., 2011,        detection, we measure changes in SAR backscatter from the
2013; Stumpf and Kerle, 2011). While optical imagery pro-         open-access Copernicus Sentinel-1 (S1) satellites. Our ap-
vides high-quality data, it is often limited in rapid response    proach requires the spatial coordinates of the area of in-
efforts because optical imagery requires daylight as well as      terest (AOI) and the dates and duration of the landslide-
shadow- and cloud-free conditions for accurately identifying      triggering event. We test our landslide detection tools for
landslides. Persistent cloud cover can prevent landslide map-     recent events occurring under different environmental con-
ping from satellite optical imagery for weeks to months (e.g.,    ditions. To better investigate landslide detection for different
Lacroix et al., 2018; Robinson et al., 2019).                     types and sizes of landslide, we analyze (1) the 2018 rainfall-
   Satellite-based synthetic aperture radar (SAR) circum-         induced landslides in Hiroshima Prefecture, Japan; (2) the
vents some of the optical data limitations because it can pen-    2018 earthquake-triggered landslides in Hokkaidō, Japan;
etrate clouds and operate day or night, but SAR data are still    (3) 2020 rainfall-triggered landslides in Huong Phung, Viet-
limited by geometric shadow and distortion (e.g., Adriano et      nam; and (4) 2020 rainfall-triggered landslides in Quang
al., 2020; Mondini et al., 2021). SAR data have been used for     Nam, Vietnam (Fig. 1). To determine the most effective
nearly 2 decades to investigate landslides (e.g., Colesanti and   strategies for landslide detection, we perform a sensitivity
Wasowski, 2006; Hilley et al., 2004; Roering et al., 2009).       analysis for the 2018 Hiroshima event by varying the time
However, most studies have focused on interferometric SAR         span (i.e., number of images) of SAR data used to mea-
(InSAR), which measures the radar phase change between            sure changes in backscatter before and after the landslide-
two acquisitions in order to quantify ground surface defor-       triggering event and by incorporating topographic slope-
mation (e.g., Handwerger et al., 2019; Huang et al., 2017b;       and curvature-based masks to remove regions where land-
Intrieri et al., 2017; Schlögel et al., 2015).                    slides are unlikely to occur. We then apply our most effec-
   SAR backscatter intensity- and coherence-based change          tive landslide detection strategies to the other case studies.
detection can also be used to detect landslides, floods, and      We do not make systematic quantitative comparisons with
other types of natural hazards (Burrows et al., 2020; De-         other remote-sensing-based data used for landslide detection
Vries et al., 2020; Jung and Yun, 2020; Mondini et al.,           – e.g., SAR-based coherence (data not available in GEE) or
2019, 2021; Rignot and Van Zyl, 1993; Tay et al., 2020; Yun       the normalized difference vegetation index (NDVI). How-
et al., 2015). Changes in backscatter and coherence occur         ever, we do make quantitative comparisons of our findings
when there are changes in ground surface properties (e.g.,        with optical-data-based landslide inventories and qualitative
reflectance, roughness, dielectric properties) before and after   comparisons with optical data from the Copernicus Sentinel-
landslide events. Coherence-based change detection methods        2 (S2) satellites for validation of our SAR-based landslide
work best in urban areas because normally the coherence is        detection. Lastly, we applied our landslide detection tools
high prior to an event and there is a reduction in coherence      to support rapid response to the August 2021 earthquake-
from damage after an event. However, backscatter change           triggered landslide event in Haiti (Fig. 1). The 2021 Haiti
detection methods can outperform coherence-based methods          event occurred during the writing of this paper and pro-
in densely vegetated mountainous regions because in these         vides the first real-time application of our landslide detec-
areas coherence is always low (i.e., no change) while the         tion approach for rapid response. Our work highlights the
backscatter can change (see Jung and Yun, 2020, for a de-         utility of using changes in SAR backscatter data to detect ar-
tailed comparison between these methods). Currently, SAR-         eas that have likely experienced landslides following catas-
based change detection methods are under-utilized for land-       trophic events, which is necessary for rapid response and
slide identification following catastrophic events, which we      for generating landslide inventories in mountainous regions
believe is primarily due to data access and the specialized       that commonly have persistent cloud cover. Importantly, our
processing and software required to analyze SAR data.             GEE approach does not require specialized SAR software or
   In this study, we develop tools and strategies to detect       downloading large volumes of data to a local system, so the
individual landslides and areas with high landslide density       broader hazard communities can utilize these state-of-the-art
(i.e., heatmaps) that can aid in rapid response and in con-       remote sensing data.
structing landslide inventories. We define rapid response
landslide detection as the period of time within 2 weeks of

Nat. Hazards Earth Syst. Sci., 22, 753–773, 2022                                   https://doi.org/10.5194/nhess-22-753-2022
A. L. Handwerger et al.: Generating landslide density heatmaps for rapid detection                                                755

Figure 1. Google terrain map showing the location of landslide case studies. © Google Maps 2021.

2     Methods                                                         sentinel-1/observation-scenario last access: 4 March 2022).
                                                                      Currently, S1 data are the only SAR data available in GEE.
The main goals of our work are to provide open-access tools              GEE provides Level-1 S1 Ground Range Detected (GRD)
in GEE that will enable users to utilize freely available SAR         backscatter intensity coefficient (σ ◦ ) images. The backscat-
data to (1) detect areas that have likely experienced land-           ter coefficient is defined as the target backscattering area
slides as fast as possible after triggering events (i.e., rapid de-   (radar cross-section) per unit ground area. All scenes are
tection) and (2) identify landslides for event inventory map-         processed to remove thermal noise, have undergone radio-
ping. We define “detection” and “mapping” using the frame-            metric calibration (but not radiometric terrain flattening), and
work described by Mondini et al. (2021), where detection is           are orthorectified using the Shuttle Radar Topography Mis-
“the action of noticing or discovering single or multiple land-       sion (SRTM) digital elevation model (DEM) (Farr et al.,
slide failures in the same general area” and mapping “refers          2007) or the Advanced Spaceborne Thermal Emission and
to the action of delineating the geometry of a landslide”.            Reflection Radiometer (ASTER) DEM for areas above 60◦
   The use of SAR data is particularly important when optical         latitude. All S1 GRD data values are provided in logarith-
data are limited due to cloud cover. Our methodology is de-           mic units of decibels (dB) calculated as 10 × log10 (σ ◦ ). The
veloped in the GEE “playground” (browser-based graphical              backscatter coefficient is a measure that can be used to de-
user interface) using the JavaScript application programming          termine if the radar signal is scattered towards or away from
interface (API) (Gorelick et al., 2017). This interface allows        the SAR sensor. The direction of scattering is primarily con-
for coding, mapping/visualization, documentation, and more,           trolled by the geometry of the landscape relative to the radar
and the products can be easily exported for offline analyses.         look direction and the electromagnetic properties of the land
The GEE codes developed here are published on GitHub and              cover. The GEE S1 GRD collection is updated daily and new
as shared GEE script links (see “Code and data availability”).        data are uploaded to GEE within 2 d of them becoming avail-
                                                                      able. GEE ingests all of the available ascending and/or de-
2.1    SAR backscatter in Google Earth Engine                         scending images on the fly.
                                                                         GEE provides GRD images with 10 m pixel spacing
We analyzed changes in the SAR backscatter from the                   and up to four polarization modes: (1) vertical trans-
S1 satellite constellation to detect ground surface changes           mit/vertical receive (VV), (2) horizontal transmit/horizontal
associated with landslides. The S1 constellation currently            receive (HH), (3) vertical transmit/horizontal receive
consists of two satellites, S1A and S1B, launched in                  (VV + VH), and (4) horizontal transmit/vertical receive
March 2014 and April 2016, respectively. Each satellite               (HH + HV). HH and HV polarizations are mostly acquired in
has a minimum 12 d revisit time for a given area. Us-                 polar regions, which are thus unlikely to be useful for land-
ing data from both satellites provides a minimum 6 d re-              slide detection. For this study we only used SAR data in the
visit time. The S1 satellites carry a C-band radar sen-               VH polarization. Cross-polarizations, such as VH and HV,
sor with a wavelength of ∼ 5.6 cm. Depending on the                   are sensitive to forest biomass structure (Le Toan et al., 1992)
location of the AOI, both ascending (asc) and descend-                and are therefore useful to identifying landslides in vegetated
ing (desc) S1 data may be available (see worldwide acquisi-           areas. We encourage users of our methods to explore the use
tion coverage, https://sentinel.esa.int/web/sentinel/missions/        of other polarizations.

https://doi.org/10.5194/nhess-22-753-2022                                       Nat. Hazards Earth Syst. Sci., 22, 753–773, 2022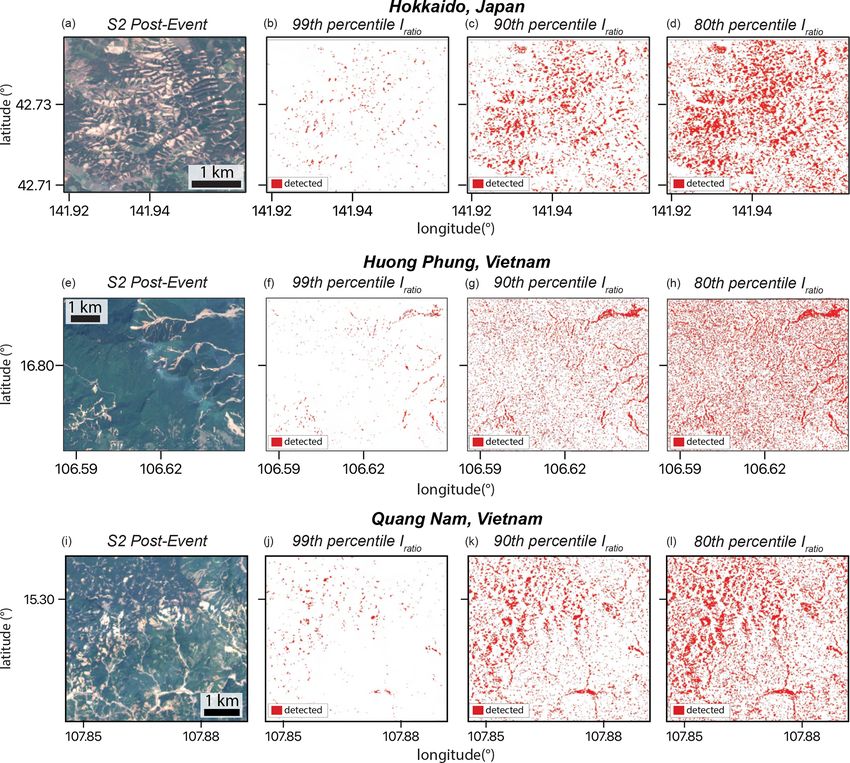
756                                     A. L. Handwerger et al.: Generating landslide density heatmaps for rapid detection

2.2   Landslide detection approach                                  generally correspond to non-landslide locations. However,
                                                                    slope thresholds will vary in different regions. Additionally,
Our landslide detection approach requires the user to select        it is common for landslides to run out into lower-slope areas;
an AOI and time period before (Tpre ) and after (Tpost ) the        therefore it is important to initially consider a wide range
event of interest (EOI). The AOI can be a small region or           of slope values when searching for landslide deposits. We
a large mountain range, and the EOI can last from seconds           also mask out larger water bodies, including oceans and some
(e.g., earthquakes) to several days (e.g., storms). Thus, it is     lakes and river shorelines, using the water body data stored
important to consider the spatial and temporal scale of the         in the NASADEM layer.
EOI when selecting the AOI, Tpre , and Tpost . Furthermore,
Tpre and Tpost will vary depending on the goal of the project       2.3   SAR change detection performance and
(i.e., rapid detection or constructing full event inventories).           determination of most effective detection strategies
    To reduce noise from poor-quality data, we removed all
pixels with values ≤ −30 dB (based on a recommendation              To determine the performance and most effective strate-
from the GEE S1 Data Catalog). We also reduce transient             gies of our SAR backscatter change detection for land-
noise and error by stacking images to create pre-event (Ipre )      slides, we performed both quantitative and qualitative com-
and post-event (Ipost ) backscatter intensity stacks. SAR data      parisons with mapped landslide inventories and satellite op-
stacking has been shown to significantly improve the signal-        tical imagery. We quantitatively evaluated our results with
to-noise ratio in SAR data (e.g., Cavalié et al., 2008; Zebker      a previously published landslide inventory for the 2018 Hi-
et al., 1997). Thus, the SAR image stacks provide backscat-         roshima landslide event using receiver operating characteris-
ter data that are more representative of the pre- or post-event     tic (ROC) curves (Fan et al., 2006). We provide a qualitative
ground surface properties. Each stack was calculated as the         visual comparison with published landslide inventories for
temporal median of the pre-event and post-event SAR data.           the 2018 Hiroshima, 2018 Hokkaidō, and 2021 Haiti land-
We constructed image stacks using ascending data, descend-          slide events and qualitative visual comparisons with S2 op-
ing data, and combined ascending and descending data. The           tical images for the 2018 Hiroshima, 2018 Hokkaidō, and
combined ascending and descending data (also referred to            2020 Vietnam events. We note that in most cases, especially
here as “asc and desc”) were calculated as the mean of the          for rapid response, neither cloud-free optical images nor an
ascending and descending stacks.                                    external landslide inventory is likely to be available prior to
    We detected potential landslides by examining the change        investigation. In some cases, partial-cloud-cover optical im-
in the backscatter coefficient using the standard SAR in-           ages can be used to reveal some parts of landslides and help
tensity log ratio approach, Iratio , defined as Iratio = 10 ×       constrain identification of landslides from SAR data. There-
log10 (Ipre /Ipost ) (e.g., Jung and Yun, 2020; Mondini et al.,     fore, we also include S2 imagery in our GEE tools.
2019, 2021). Because GEE provides the backscatter coeffi-              We quantified the success of our SAR backscatter change
cient data in dB, Ipre − Ipost is equivalent to the Iratio (loga-   approach to identify true landslides for an extreme rain-
rithm quotient rule). The Iratio can be either positive or neg-     fall event that caused widespread landsliding in Hiroshima,
ative, with positive values corresponding to a decrease in          Japan, in 2018. In this case study, we determined the de-
the post-event SAR backscatter intensity. SAR backscatter           tection performance using ROC curves, which measures our
changes following landslide events occur because landslides         detection compared to an external landslide inventory under
cause major changes in ground surface properties that alter         a variety of thresholds for discriminating between landslide
the radar reflectance, hillslope geometry, roughness, and di-       and non-landslide pixels. We compared our SAR change de-
electric properties (Adriano et al., 2020; Mondini et al., 2021;    tection to the landslide inventory made by the Geospatial
Rignot and Van Zyl, 1993).                                          Information Authority of Japan (GSI) and Association of
    We also note that other ground surface change, for instance     Japanese Geographers (AJG) (see “Code and data availabil-
due to flooding, agriculture, mining, deforestation, and more,      ity”). To make a better comparison between our SAR change
can also be detected by examining Iratio (e.g., Jung and Yun,       detection approach and the published landslide inventory, we
2020; Tay et al., 2020) and may cause false positives. To           manually removed landslides with an area < 100 m2 from
help reduce false positives, we removed areas that are un-          the GSI–AJG inventory for a better match with the minimum
likely to correspond to landslides (e.g., small lakes, rivers,      size of a 10 m × 10 m S1 SAR pixel. The ROC analyses were
flat surfaces, hilltops) by using threshold-based masks made        performed outside of the GEE platform using the MATLAB
from the topographic slope and curvature calculated from the        software package. We computed the ROC curves for all pix-
1 arcsec (∼ 30 m) resolution NASADEM, which comprises               els within the ∼ 277 km2 Hiroshima AOI shown in Fig. 2a.
reprocessed SRTM data with improved height accuracy and             For these analyses, each pixel in the SAR intensity change
filled missing elevation data (NASA JPL, 2020). We refer to         raster was classified as a landslide if the Iratio pixel value
this mask throughout this paper as the “DEM mask”. Since            was greater than a threshold value or as non-landslide if it
landslides typically initiate on steep hillslopes, slopes of less   was less than the threshold value. The ROC curve is calcu-
than a few degrees can be masked, as these are the areas that       lated by varying the Iratio threshold values (ITR ). The initial

Nat. Hazards Earth Syst. Sci., 22, 753–773, 2022                                     https://doi.org/10.5194/nhess-22-753-2022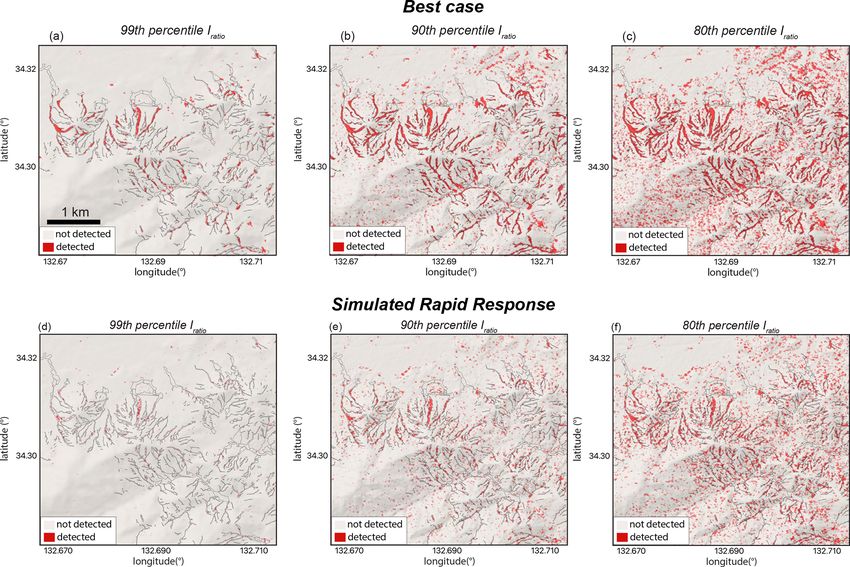
A. L. Handwerger et al.: Generating landslide density heatmaps for rapid detection                                                      757

Figure 2. Rainfall-triggered landslides in 2018 in Hiroshima Prefecture. (a) NASADEM hillshade map with black polygons showing the
GSI–AJG landslide inventory and the black box highlighting a sub-area of the AOI for plots (b)–(d). (b) Sentinel-2 optical image show-
ing landslide scars. (c) SAR backscatter intensity change for combined ascending and descending stacks. SAR backscatter change maps
were created from stacks made from 142 combined ascending and descending pre-event SAR images collected between 1 May 2015 and
29 June 2018 and 133 post-event SAR images collected between 9 July 2018 and 29 May 2020 and represent our best-case landslide iden-
tification. (d) SAR backscatter intensity change for simulated rapid response consisting of stacks made from the same 142 pre-event SAR
images and 5 post-event SAR images collected between 9–24 July 2021. Red colors correspond to a decrease in post-event backscatter
intensity (positive Iratio values). Black polygons in (c) and (d) show the GSI–AJG landslide inventory. No DEM mask is applied to (c) or (d).

ITR,ROC is set as the minimum Iratio value in the dataset and is         and the thresholds used for slope angle and curvature for the
increased until reaching the maximum value (thus we explore              DEM mask. We then apply these lessons learned for optimal
the entire range of Iratio values). We then compared these               landslide detection strategies within the other case studies.
classified pixels to the true landslides in the GSI–AJG inven-              The main goal of our SAR change detection performance
tory. For each threshold, the false positive rate, defined as the        analysis was to determine the most effective detection strate-
ratio of false positives to true non-landslide pixels, is com-           gies for landslide identification. While we validated and re-
pared to the true positive rate, defined as the ratio of true pos-       fined our landslide detection approach with external inven-
itives to true landslide pixels. The best performance is deter-          tories and optical data in this study, it is important to em-
mined by maximizing the area under the ROC curve (AUC)                   phasize that these external data are not required for landslide
(Fan et al., 2006). An AUC of 1 corresponds to a perfect clas-           detection, and our tools are specifically designed to be used
sifier, while an AUC of 0.5 is equivalent to a random selec-             without an external landslide inventory and without optical
tion (50 % true positive rate and 50 % false positive rate). To          data.
maximize the AUC, we performed a sensitivity analysis by
varying the pre-event and post-event time periods, the satel-
lite acquisition geometry (i.e., asc, desc, or asc and desc),

https://doi.org/10.5194/nhess-22-753-2022                                          Nat. Hazards Earth Syst. Sci., 22, 753–773, 2022
758                                    A. L. Handwerger et al.: Generating landslide density heatmaps for rapid detection

2.4    Landslide density heatmaps                                  in widespread floods and landslides. There were more than
                                                                   200 fatalities, 20 000 damaged buildings, and 8500 dam-
To identify areas that have likely experienced landslides,         aged houses caused by these natural disasters. Hiroshima
which is particularly useful for rapid response, we imple-         Prefecture had an especially high 108 fatalities, 14 862 dam-
mented a landslide density heatmap approach. The heatmap           aged buildings, and 689 destroyed houses, significantly more
is a data visualization technique that consists of a raster made   than other prefectures, which was primarily due to the
by calculating the density of potential landslide pixels in a      ∼ 8000 triggered landslides (Adriano et al., 2020; Hirota et
location over a given radius using a kernel density estima-        al., 2019; Miura, 2019). Between 1–7 July 2018 there was
tion. In this way, the landslide density heatmap is a proxy        approximately 500 mm of rainfall in Hiroshima Prefecture.
for potential landslide occurrence and not a heatmap of ob-        Cloud cover prevented full landslide detection from optical
served landslides classified using other methods. Several re-      images during the event period, and partial cloud cover re-
cent studies have applied a landslide density map approach         mained for the month following the event.
to identify critically damaged areas, rather than focusing on         The study AOI (Fig. 1) has a mixture of land cover includ-
the location of individual landslides (e.g., Bessette-Kirton       ing dense forest with little infrastructure in the mountains
et al., 2019; Burrows et al., 2020; Rosi et al., 2018). Our        and farmlands and with residential areas and cities in the val-
landslide density heatmaps are similar to these other density      leys. Within our ∼ 277 km2 AOI, there were 3370 landslides
maps; however instead of counting individual landslides, we        mapped by the GSI–AJG. The minimum, mean, and maxi-
calculate the density of individually detected pixels over a       mum elevation is 0, 210, and 850 m, respectively. The mean
fixed area. We define the pixels used in the heatmap by se-        slope angle is 14◦ ± 11◦ (± SD – standard deviation) with a
lecting an Iratio threshold for heatmaps (ITR,H ). We manu-        maximum slope of 64◦ . Adriano et al. (2020) also used SAR
ally explored ITR,H using Iratio percentiles to find the thresh-   intensity change with data from Advanced Land Observing
old value that visually highlights true landslides and reduces     Satellite-2 (ALOS-2) to successfully identify landslides for
noise and false positives (see Sect. 4.2 for further expla-        the same EOI.
nation). All pixels ≥ ITR,H are classified as potential land-
slide pixels, and all pixels below the threshold are excluded
from the analyses. By using percentile-based thresholds, we        3.2   Earthquake-triggered landslides, 2018, Hokkaidō,
are able to determine thresholds that correspond to land-                Japan
slides in different regions around the world. The ITR,H is
different from the thresholds used in the ROC–AUC analy-           From 3–5 September, Typhoon Jebi passed over Japan,
ses (ITR,ROC ) because ITR,H must be defined without the use       which brought about 100 mm of precipitation. A Mw 6.7
of an external landslide inventory.                                earthquake struck the Iburi–Tobu area of Hokkaidō Prefec-
   We construct heatmaps using both GEE and QGIS. We use           ture located in north Japan on 6 September 2018. The pow-
GEE to identify the potential landslide pixel locations and        erful ground motion (station HKD126 records up to 0.67 g;
then export these as a KML file for heatmap construction in        or 153 cm s−1 peak ground velocity) caused liquefaction and
QGIS. Once in QGIS, the pixel locations are converted to a         triggered ∼ 6000 landslides, which destroyed and buried 394
local UTM coordinate system, and then the heatmap is made          buildings and killed 41 people (Yamagishi and Yamazaki,
using the Heatmap (Kernel Density Estimation) processing           2018; Zhang et al., 2019a). Most of the coseismic landslides
toolbox. The Heatmap toolbox requires selection of a radius,       were classified as coherent shallow debris slides (Zhang et
output raster size, and a kernel shape. We found good results      al., 2019a). Due to cloud cover, full landslide detection from
with an output pixel size of 100 m and either a quartic or         optical images was not available until 5 d later. Thus, opti-
an Epanechnikov kernel shape. We did not identify a single         cal imagery would have also been viable for rapid response
best value to define the radius but generally found that radius    for this event. Nonetheless, we use this EOI to test our GEE
values between ∼ 1–3 km were appropriate. We encourage             SAR-based detection tools.
users of our tools to explore the heatmap radius as it may            We defined our study AOI (Fig. 1) as a 1170 km2 region
vary depending on the AOI and EOI. In addition, we include         with a high landslide density (Zhang et al., 2019a). The land
an option to generate heatmaps directly in GEE.                    cover in our AOI includes dense forests in the mountains and
                                                                   farmlands and cities in the valleys. The minimum, mean, and
                                                                   maximum elevation is 0, 129, and 625 m, respectively. The
3     Test sites                                                   mean slope angle is 10◦ ±8◦ (±1 SD) with a maximum slope
                                                                   of 84◦ . This EOI was also previously investigated using SAR
3.1    Rainfall-triggered landslides, 2018, Hiroshima,             change detection methods by Adriano et al. (2020), Burrows
       Japan                                                       et al. (2020), and Jung and Yun (2020). These studies showed
                                                                   that both coherence change and backscatter intensity change
A record-breaking rainfall event occurred between 28 June          detection methods work to characterize the landslides; how-
and 8 July 2018 in west and central Japan that resulted            ever the backscatter-based methods outperform SAR coher-

Nat. Hazards Earth Syst. Sci., 22, 753–773, 2022                                   https://doi.org/10.5194/nhess-22-753-2022
A. L. Handwerger et al.: Generating landslide density heatmaps for rapid detection                                            759

ence change detection in the vegetated mountains (Jung and       4.1   Determining effective strategies for detecting
Yun, 2020).                                                            landslides

3.3    Rainfall-triggered landslides, 2020, Huong Phung          To determine the most effective strategies for landslide de-
       and Quang Nam, Vietnam                                    tection with SAR backscatter change and to quantify de-
                                                                 tection success, we explored several different strategies and
There were several major landslide events in Vietnam in Oc-      compared our findings with the GSI–AJG inventory for the
tober 2020 that were related to a particularly wet period        2018 Hiroshima event using the AUC scores computed from
between 6–28 October as the country was hit by six tropi-        the ROC curves. These different strategies included chang-
cal cyclones (Van Tien et al., 2021). We examined landslide      ing the total number of SAR images used in the pre-event
events from Huong Phung Commune on 18 October 2020               and post-event stacks; applying slope and curvature thresh-
and Quang Nam Province on 28 October 2020 (Van Tien              olds (i.e., DEM mask); applying Iratio thresholds to highlight
et al., 2021). We selected a 1080 km2 AOI in Huong Phung         landslides and construct heatmaps; and using ascending, de-
and a 416 km2 AOI in Quang Nam (Fig. 1). Cloud cover pre-        scending, or combined ascending and descending data. We
vented full landslide detection from optical images during the   define the “best-case” strategy as the approach that maxi-
event period, and partial cloud cover remained until Febru-      mizes the AUC score.
ary 2021.                                                           First, we calculated the SAR backscatter change for the
   The landslides in Huong Phung occurred in an area that        2018 Hiroshima event using all of the SAR data that were
had a mean slope angle of 17◦ ± 10◦ (±1 SD) with a max-          available as of 29 May 2020 (when we began this study) to
imum slope of 70◦ . The landslides in Quang Nam occurred         construct pre- and post-event stacks. The pre-event stack con-
in an area that had a mean slope angle of 21◦ ± 9◦ with a        sisted of 142 images (100 ascending and 42 descending) with
maximum slope of 71◦ . Both landslide areas in Vietnam are       the first image collected 1152 d before the EOI and the last
covered with dense forested vegetation and farmlands.            image collected 12 d before the EOI. The post-event stack
                                                                 consisted of 133 images (74 ascending and 59 descending)
3.4    Earthquake-triggered landslides, 2021, Haiti
                                                                 with the first image collected 1 d after the EOI and the last
While writing this paper, a major Mw 7.2 earthquake struck       image collected 684 d after the EOI. Figure 2 shows the SAR-
on 14 August 2021 in Haiti and caused widespread land-           based backscatter change for a sub-area of our AOI. The
sliding in the southwestern part of the country (Martinez        SAR-based backscatter change shows many localized areas
et al., 2021a). The earthquake epicenter was near Nippes,        with Iratio > 2 that correspond to true landslides (Fig. 2c).
Haiti (∼ 120 km west of Port-au-Prince) (https://earthquake.     These relatively high Iratio areas have planform geometries
usgs.gov/earthquakes/eventpage/us6000f65h/executive, last        typical of the debris flow type landslides (long, narrow, and
access: 4 March 2022). Heavy rainfall from Tropical Storm        channelized) that occurred during the 2018 rainfall event. We
Grace further contributed to the disaster 2 d after the earth-   find most landslides have a positive Iratio , i.e., Ipost < Ipre ,
quake by triggering additional landslides and flooding and       but there were also some places with negative Iratio values
hindering the earthquake response (https://appliedsciences.      within landslide scars as discussed in Adriano et al. (2020).
nasa.gov/what-we-do/disasters/disasters-activations/             Direct comparison with the cloud-free S2 optical imagery
haiti-earthquake-landslides-flooding-2021, last access:          and the GSI–AJG inventory provided initial validation that
4 March 2022). We were able to test our landslide detection      SAR backscatter change can successfully detect landslides.
approach in real time to support the response effort. We used       By comparing our change detection result with the GSI–
our GEE tools to generate a landslide density heatmap for a      AJG inventory, we found AUC scores of 0.7363, 0.7409,
∼ 6500 km2 region.                                               and 0.7712 for ascending, descending, and ascending and
                                                                 descending, respectively, using the complete pre- and post-
                                                                 event stacks. We repeated these analyses by changing the
4     Results                                                    time duration for images included in Tpre and Tpost to 12, 6,
                                                                 3, and 1 months (Fig. 3). We varied the time span to simulate
We consider five independent landslide events to evaluate our    the impact of different quantities of available data for future
method within Japan, Vietnam, and Haiti. We use the Hi-          studies. The highest AUC occurred when using all available
roshima EOI to determine the most effective landslide detec-     pre-event and post-event data and by combining asc and desc
tion strategies. We then apply our findings to the other test    data. We found that stacking large numbers of SAR images
cases and make qualitative comparisons with cloud-free op-       improves the signal-to-noise ratio.
tical imagery and published landslide inventories (Hokkaidō        Next we used topographic data to help reduce false posi-
and Haiti) to help assess the landslide detection performance.   tives (Fig. 3b). To determine the slope and curvature thresh-
                                                                 olds, we used our most effective landslide identification
                                                                 strategy from the previous analyses (i.e., all available pre-
                                                                 event and post-event data) and found the slope and curvature

https://doi.org/10.5194/nhess-22-753-2022                                  Nat. Hazards Earth Syst. Sci., 22, 753–773, 2022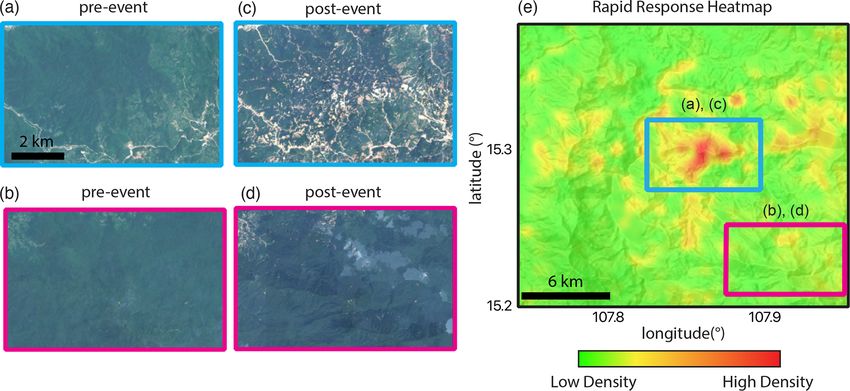
760                                      A. L. Handwerger et al.: Generating landslide density heatmaps for rapid detection

Figure 3. Receiver operating characteristic (ROC) analyses to determine the most effective strategy for landslide identification. (a) Colored
lines show ROC curves as a function of the pre-event stack time period (Tpre ) and post-event stack time period (Tpost ). (b) ROC curves
using all available pre- and post-event data (highest AUC in a). Dashed colored lines correspond to ascending (asc), descending (desc), and
ascending and descending data. Solid colored lines show the same data with the addition of the DEM mask slope and curvature thresholds.
(c) ROC curves with DEM mask for rapid response detection using all pre-event SAR data and post-event data acquired 1 d and 1 week
following the landslide event.

thresholds that maximized the AUC. We found that we can                  improved the landslide signals and increased the AUC to
further improve the AUC to 0.8101, 0.8041, and 0.8342 (best              0.6787. Examination of the Iratio within the landslides’ areas
case) for asc, desc, and asc and desc, respectively, by using            shows some elongated debris flow shapes (Fig. 2d) but with
a DEM mask to exclude areas with low topographic slopes                  a considerably lower signal-to-noise ratio when compared to
(< 5◦ ) and convex curvature (> −0.005 m−1 ). These areas                using post-event stacks with many more images (Fig. 2c).
of very low slope correspond to flat regions, such as cities             Importantly, the AUC improves rapidly over the first week
and valley bottoms, and areas of relatively high positive cur-           with the transition from two to four post-event images, indi-
vature correspond to hilltops, where landslides are less likely          cating that the images immediately following the event pro-
to occur. Importantly, applying slope- and curvature-based               vide key information on the location of damage for rapid re-
masks makes a large improvement in landslide detection, but              sponse. While the AUC scores are relatively low for the rapid
the specific slope and curvature threshold values will vary for          response analyses due to the low signal-to-noise ratio of the
other locations.                                                         post-event images and it is challenging to identify individual
                                                                         landslides from the Iratio , the SAR-based backscatter inten-
4.2   Determining effective strategies for rapid response                sity change still provides key information that can be used to
                                                                         identify the critically damaged areas.
To identify landslides for rapid response (i.e., within 2 weeks
of the landslide event), we applied the DEM mask from                    4.3   Landslide detection with SAR-based-change
Sect. 4.1 and explored landslide detection scenarios where                     landslide density heatmaps
we have limited post-event data. Ideally, for rapid response,
the first available image or first few available images fol-             To rapidly detect areas with high landslide density, we de-
lowing a catastrophic event will provide key information for             veloped a landslide density heatmap approach in GEE. As
identifying damaged areas. Thus, our methodology was de-                 described above, the heatmap is a data visualization tool
signed with the goal of being able to provide information                that uses the density of potential landslide pixels in a lo-
to responders on the location of critically damaged areas as             cation over a given radius to generate a raster. A key step
quickly as possible.                                                     in generating a heatmap is to define the ITR,H that classi-
   For the 2018 Hiroshima simulated rapid response, we cal-              fies true landslide pixels. To select the best Iratio threshold
culated the SAR backscatter change for a stack consisting of             that corresponds primarily to true landslides, we examined
all of the available pre-event imagery and post-event imagery            data for the 2018 Hiroshima landslide event. We found that
collected within 2 weeks of the EOI. The first post-event im-            an ITR,H value that includes all pixels ≥ the 99th-percentile
ages were acquired on 10 July 2018 on both ascending and                 value over the full AOI best highlights the true landslides
descending tracks, less than 1 d after the rainfall ended. By            and removes most of the false positives (Fig. 4; see Fig. A1
making comparison with the GSI–AJG inventory, we found                   for other case studies). For both the simulated rapid re-
an AUC of 0.6212 (Fig. 3c). The second set of post-event                 sponse and the data stack that includes years of post-event
images was acquired on 16 July 2018 on both ascending and                data, the 99th percentile highlights true landslides while
descending tracks. Incorporating four total post-event images            greatly reducing the false positives. Comparison with the

Nat. Hazards Earth Syst. Sci., 22, 753–773, 2022                                           https://doi.org/10.5194/nhess-22-753-2022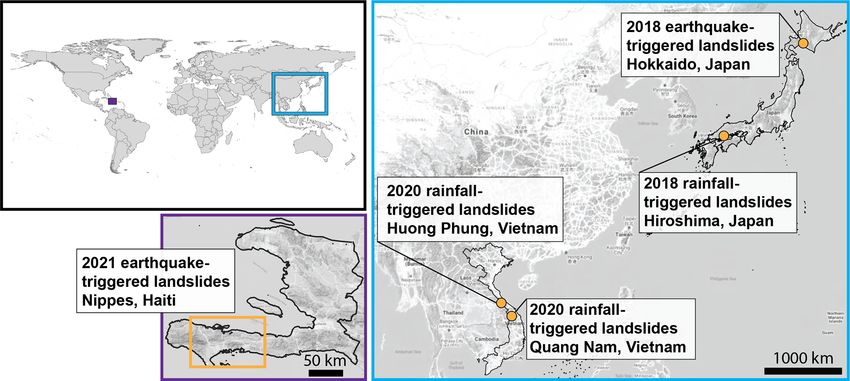
A. L. Handwerger et al.: Generating landslide density heatmaps for rapid detection 761
90th-percentile and 80th-percentile thresholds shows how 4.4.2 Simulated rapid response for
the number of false positives increases rapidly by including 2020 rainfall-triggered landslides, Huong Phung
a larger range of Iratio values. We will use the 99th percentile and Quang Nam, Vietnam
as our Iratio threshold for the remainder of the study.
Figure 5 shows our landslide density heatmap for the sim- We constructed landslide density heatmaps for simulated
ulated rapid response scenario for the 2018 Hiroshima EOI. rapid response for the October 2020 landslide events in AOIs
The heatmap highlights that the areas critically damaged by in Huong Phung (Fig. 7) and Quang Nam (Fig. 8), Vietnam.
landslides, as shown by comparison with the GSI–AJG in- There were hundreds of landslides triggered during this un-
ventory, can be located within 2 weeks of the landslide- usually wet period, but no published inventory of them is cur-
triggering event. Areas with bright red colors correspond to rently available (to our knowledge). For the Huong Phung
the areas with the highest potential landslide density and/or event, we defined the pre-event period as between 1 Octo-
the largest landslides. ber 2016 and 17 October 2020 and the post-event period as
between 19 October and 1 November 2020. This resulted
4.4 Other case studies in 229 combined ascending and descending pre-event SAR
images and 4 post-event SAR images. For the Quang Nam
Our analyses of the 2018 Hiroshima event provide us with event, we defined the pre-event period as between 1 Octo-
useful guidelines for landslide detection and rapid response. ber 2016 and 27 October 2020 and the post-event period as
To further test our approach, we applied our most effective between 29 October and 7 November 2020. This resulted in
strategies for rapid response to the 2018 earthquake-triggered 253 combined ascending and descending pre-event SAR im-
landslides in Hokkaidō, Japan, and 2020 rainfall-triggered ages and 4 post-event SAR images. The heatmaps for both
landslides in Huong Phung and Quang Nam, Vietnam. Our events clearly show areas with high density of detected land-
most effective strategies include using a DEM mask and a slides. We checked areas on the heatmaps that showed high
large pre-event stack of combined ascending and descending landslide density by comparing pre- and post-event S2 opti-
data. We note that the specific values for the DEM mask will cal imagery (Figs. 7 and 8). The optical imagery shows that
vary from location to location, so we recommend exploring the heatmaps successfully highlighted areas with high land-
a range of values. For these case studies, we simulated rapid slide density. We also observed some false positives in the
response scenarios by limiting Tpost to 2 weeks of the EOI. heatmap for the Huong Phung area. We observed apparent
high landslide density that appeared to correspond to false
4.4.1 Simulated rapid response for the
positives related to clearcutting of trees (Fig. 7e).
2018 earthquake-triggered landslides,
Hokkaidō, Japan
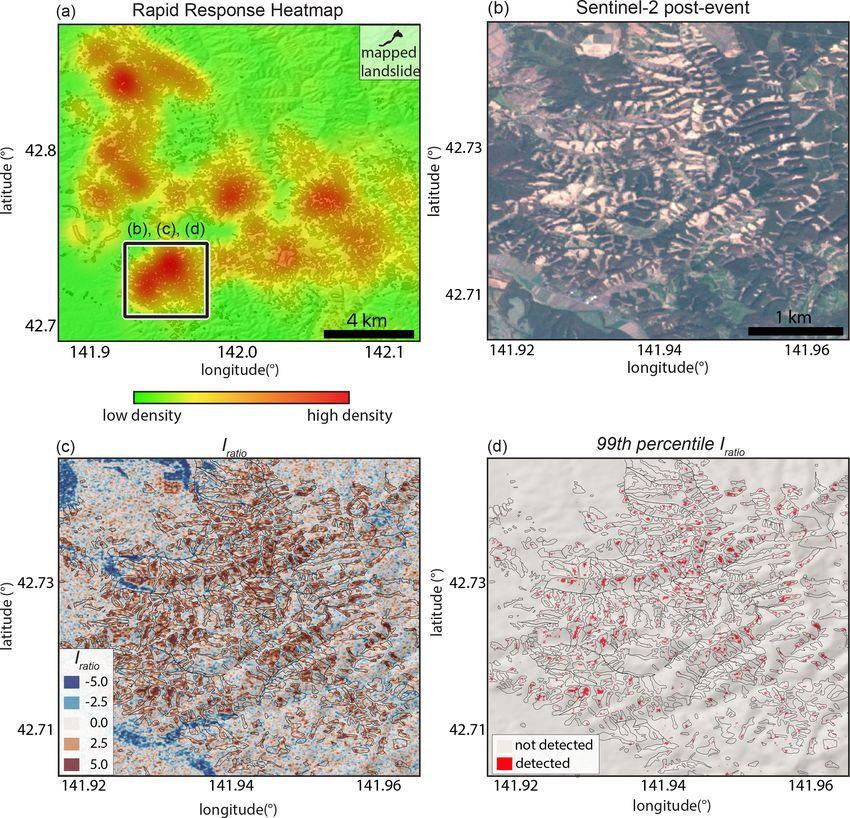
4.5 Application of landslide density heatmaps to
We defined the simulated rapid response scenario pre-event support rapid response for 2021 Haiti earthquake
time period between 1 August 2015 and 5 September 2018
and the post-event time period between 6–21 Septem- On 15 August 2021, just 1 d after the 2021 Nippes, Haiti,
ber 2018 for the Hokkaidō event. These time periods resulted Mw 7.2 earthquake, we used our GEE tools to generate
in a pre-event stack with 150 combined ascending and de- a landslide density heatmap. Our heatmap only includes
scending images and a post-event stack with 3 combined as- the landslides triggered by the earthquake and not those
cending and descending images. We found that the rapid re- triggered by Tropical Storm Grace 2 d later. We defined
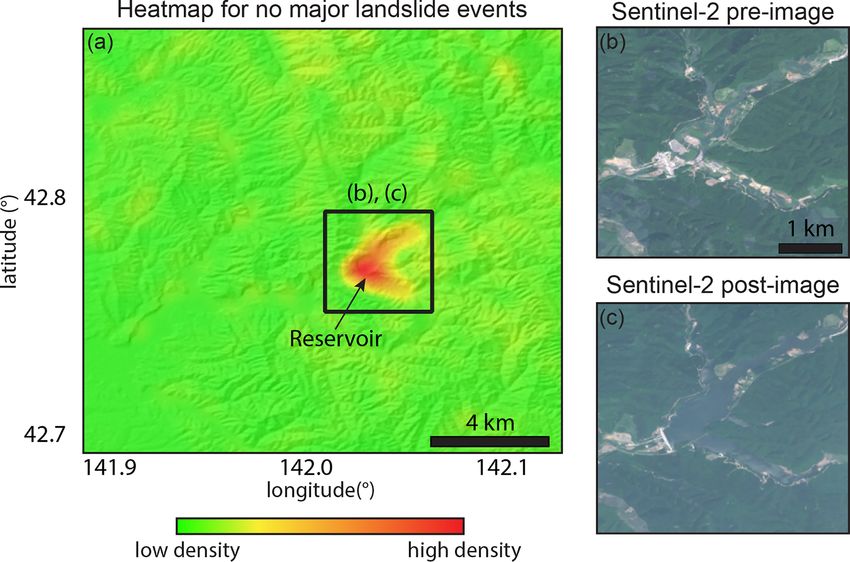
sponse heatmap characterized the areas with high landslide the pre-event period as between 1 August 2017 and
density (Fig. 6a). Direct visual comparison with the pub- 13 August 2021 and the post-event period as between
lished inventory from Zhang et al. (2019a) shows good agree- 14–15 August 2021. This resulted in 104 descending
ment between the areas detected by our SAR backscatter pre-event SAR images and 1 descending post-event SAR
change heatmap and the true landslides. Figure 6b–d show a image. Note that because there was only a single de-
close-up of an area with a particularly high landslide density. scending image collected immediately after the event, we
The Iratio values and the Iratio ≥ the 99th percentile show used a descending-only stack to create the heatmap. We
strong and clear signals that correspond to true landslides. In found an area of high landslide density located ∼ 56 km
addition, the Iratio values ≥ the 99th percentile appear to cor- west of the epicenter (Fig. 9a). We posted our landslide
respond almost entirely to true landslides, and examination heatmap on the NASA Disasters Mapping Portal (https:
of the 99th-percentile map and heatmap allows for straight- //maps.disasters.nasa.gov/arcgis/apps/MinimalGallery/
forward landslide detection. index.html?appid=3b785d8e1ff943e59a9810f67181b8d3,
last access: 4 March 2022) on 17 August 2021, where
numerous other remote sensing datasets were hosted includ-
ing the SAR coherence-based damage proxy map (DPM)
and coseismic S1 interferogram that were produced by the
Advanced Rapid Imaging and Analysis (ARIA) team at
https://doi.org/10.5194/nhess-22-753-2022 Nat. Hazards Earth Syst. Sci., 22, 753–773, 2022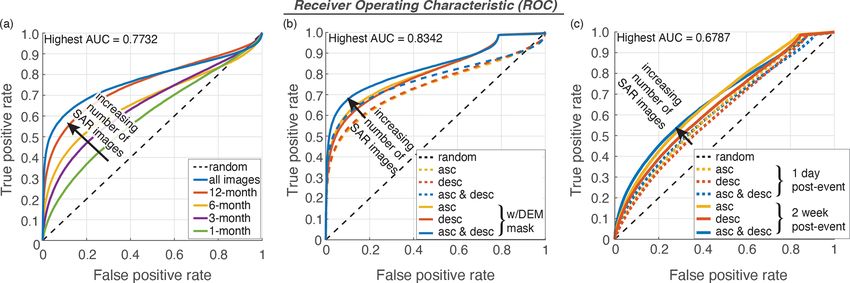
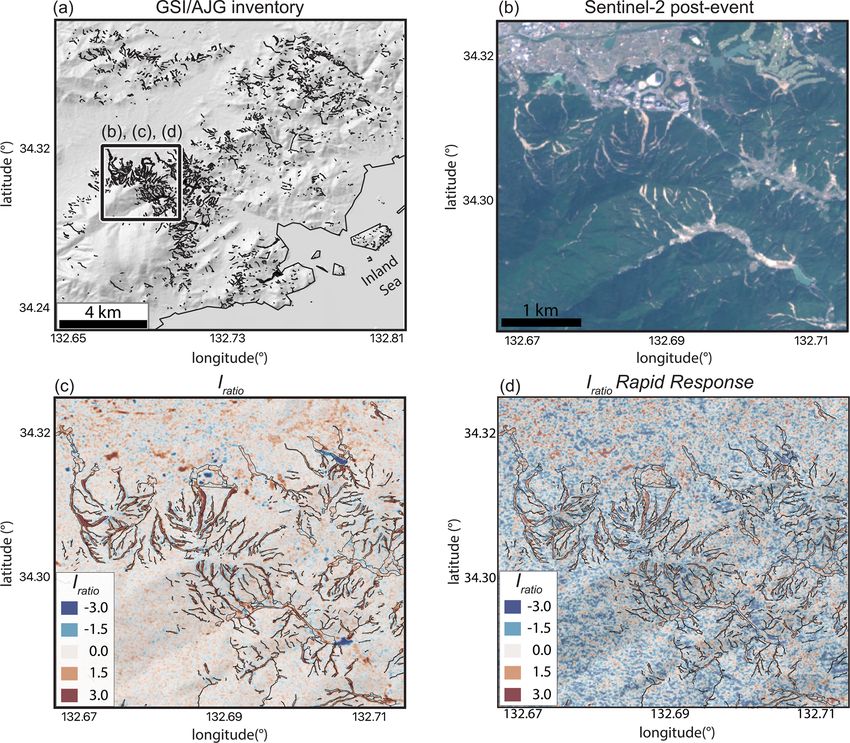
762                                     A. L. Handwerger et al.: Generating landslide density heatmaps for rapid detection

Figure 4. Detected landslides based on Iratio threshold values (ITR,H ) for the 2018 Hiroshima landslide event. (a–c) The 99th-, 90th-
, and 80th-percentile thresholds for detecting landslides for the best-case landslide detection strategy that consists of stacks made from
142 combined ascending and descending pre-event SAR images collected between 1 May 2015 and 29 June 2018 and 133 post-event SAR
images collected between 9 July 2018 and 29 May 2020. (d–f) The 99th-, 90th-, and 80th-percentile thresholds for detecting landslides for
the simulated rapid response that consists of stacks made from the same 142 pre-event SAR images and 5 post-event SAR images collected
between 9–24 July 2021. Images are draped over NASADEM hillshade. DEM mask is used to remove low topographic slopes (< 5◦ ) and
convex curvature (> −0.005 m−1 ). Thin black polygons show the GSI–AJG landslide inventory.

NASA’s Jet Propulsion Laboratory and California Institute              3625 landslides over a ∼ 5000 km2 area between 17–
of Technology in collaboration with the Earth Observatory of           23 August 2021 made from Planet and Maxar optical
Singapore (EOS). The SAR-based products are particularly               imagery and published a final inventory of 4893 landslides
important because cloud cover prevented full optical-based             made from Sentinel-2, WorldView, and Planet imagery in
landslide mapping for weeks after the earthquake (Martinez             December 2021 (Martinez et al., 2021a; see “Code and
et al., 2021a).                                                        data availability”). We found good agreement between
   The first available optical-based landslide inventory               our SAR-based landslide heatmap and the area of highest
was produced on the day of the earthquake (14 Au-                      landslide density mapped with optical imagery, providing
gust 2021) using a heavily cloud covered S2 image                      further evidence that our SAR-based approach is well suited
(Fig. 9b) with the Semi-Automatic Landslide Detec-                     for rapid response following major catastrophic landslide
tion (SALaD) approach (Amatya et al., 2021). Due                       events (Fig. 9a). A comparison of different landslide datasets
to the cloud cover, only a ∼ 300 km2 area had partial                  and methodologies to support the response and recovery
visibility, and ∼ 525 landslides were mapped (https:                   effort is ongoing and will be the topic of future work.
//maps.disasters.nasa.gov/arcgis/apps/MinimalGallery/
index.html?appid=3b785d8e1ff943e59a9810f67181b8d3,
last access: 4 March 2022). The USGS then released a
larger preliminary rapid landslide inventory that included

Nat. Hazards Earth Syst. Sci., 22, 753–773, 2022                                         https://doi.org/10.5194/nhess-22-753-2022
A. L. Handwerger et al.: Generating landslide density heatmaps for rapid detection                                             763

                                                                   descending data individually (Fig. 3). Combining ascending
                                                                   and descending data into a single stack helps reduce bias
                                                                   introduced from the acquisition geometry (e.g., radar shad-
                                                                   ows, foreshortening, layover). The combined effect of stack-
                                                                   ing hundreds of images with both geometries can improve
                                                                   the ability to detect landslides. Our findings indicate that fu-
                                                                   ture catastrophic events will benefit from a large number of
                                                                   pre-event images (S1 data have been collected since 2014).
                                                                   However, there is likely a point at which there are dimin-
                                                                   ished returns on adding additional pre-event data because
                                                                   of increased computation time. Additionally, we expect fur-
                                                                   ther improvements in landslide detection as more advanced
                                                                   SAR processing methods are incorporated into GEE. A re-
                                                                   cent GEE toolset by Mullissa et al. (2021) implements bor-
                                                                   der noise correction, speckle filtering, and radiometric terrain
Figure 5. Simulated rapid response heatmap for the 2018 Hi-        normalization into the S1 data that may improve our land-
roshima landslide event. Heatmap with red colors showing a high    slide detection capability, but these methods are not yet in-
density of potential landslides draped over NASADEM hillshade.     corporated into our GEE tools.
Black polygons are from the GSI–AJG inventory. Pre-event stack
                                                                      The landslide type and size also appear to impact our land-
created from 142 combined ascending and descending SAR im-
ages collected between 1 May 2015 and 29 June 2018 and post-
                                                                   slide detection performance. The minimum pixel size of the
event stack created from 5 SAR images collected between 9–         S1 GRD data is 10 m, with a pixel resolution of ∼ 3 and
24 July 2021. Heatmap radius set to 1 km. DEM mask is used         22 m. This resolution limits our ability to detect small land-
to remove low topographic slopes (< 5◦ ) and convex curvature      slides with lengths or widths < 20 m, and as a result larger
(> −0.005 m−1 ).                                                   landslides are more likely to be detected. Furthermore, users
                                                                   should exercise caution interpreting individual pixels that
                                                                   are isolated in space as landslides. Landslides are most of-
5     Discussion                                                   ten constituted by clusters of nearby pixels. Therefore, SAR
                                                                   change detection with S1 data will work better in areas with
5.1    Landslide detection using SAR backscatter change            larger landslides, such as the 2018 Hokkaidō landslide event.
                                                                   The type of landslide also impacts the detection success and
Our results show that SAR-based backscatter intensity              must be considered when setting slope and curvature thresh-
change in GEE can be used to detect landslides over large          olds. Detection of channelized landslides, such as debris
areas. The main goal of this study was to develop a method-        flows, benefits from curvature thresholds that remove convex
ology for those without SAR expertise or specialty process-        hillslopes from the analyses, while rockslides or translational
ing software that can be used to create landslide density          landslides may initially occur along convex hillslopes (e.g.,
heatmaps that can aid in rapid response to catastrophic land-      2018 Hokkaidō landslide event). Additionally, removing ar-
slide events. We performed sensitivity tests and quantitative      eas with low slope angles may remove the landslide deposit
analysis for the 2018 Hiroshima landslide event in order to        from the detection analyses. Therefore, we suggest perform-
help guide future investigations that do not have an external      ing landslide detection with a range of slope and curvature
landslide inventory to help refine their approach. We demon-       thresholds for each specific field area.
strated that the landslides in Hiroshima Prefecture, as well as       The next step after identifying landslide areas is to con-
the other case studies, caused an overall decrease in the SAR      struct landslide inventories. The ability to construct accurate
backscatter coefficient, which resulted in a relatively large      landslide inventories generally improves with time when ad-
positive Iratio (Figs. 2 and A2). Furthermore, we found that       ditional post-event SAR images are collected. GEE has draw-
the true landslides are well characterized by Iratio values that   ing tools that can be used to add a marker (i.e., point location)
are ≥ the 99th percentile (Figs. 4 and 6d).                        or draw a line, polygon, or rectangle. Data from GEE, such
   We found that increasing the total number of SAR images         as SAR backscatter change maps, can also be easily exported
used in the SAR backscatter intensity stacks improved land-        as GeoTIFF files for mapping in GIS software. Although not
slide detection performance (Fig. 3). Our study also confirms      fully explored in this work, we have added a threshold-based
findings of previous work (e.g., Adriano et al., 2020) that the    approach that classifies pixels with certain Iratio values as
detection performance was further improved by applying a           landslides and can be used for mapping. This is the same
DEM mask to remove areas where landslides were unlikely            Iratio threshold used to make the heatmaps (ITH,H ). This ap-
to occur. Additionally, combining ascending and descending         proach is included in our GEE toolset (see “Code and data
geometry SAR data into a single stack together improved            availability”). We also note that GEE has machine learning
landslide detection when compared to using ascending or            capabilities that can be used to help identify landslides.

https://doi.org/10.5194/nhess-22-753-2022                                   Nat. Hazards Earth Syst. Sci., 22, 753–773, 2022
764 A. L. Handwerger et al.: Generating landslide density heatmaps for rapid detection
Figure 6. Simulated rapid response heatmap for the 2018 Hokkaidō landslide event. (a) Heatmap with red colors showing a high density
of detected landslides draped over the NASADEM hillshade. Heatmap radius set to 1 km. (b) Post-event Sentinel-2 optical image for sub-
area shown in (a). (c) Iratio map for sub-area draped over the NASADEM hillshade. (d) Iratio threshold map with red pixels that are ≥ the
99th-percentile Iratio draped over the NASADEM hillshade. Black landslide polygons in (a), (c), and (d) are from Zhang et al. (2019a). SAR
images are made from stacks consisting of 150 pre-event SAR images collected between 1 August 2015 and 5 September 2018 and 3 post-
event SAR images collected between 6–21 September 2018. DEM mask is used to remove low topographic slopes < 10◦ in (a) and (d). No
curvature mask is used because the landslides appear to have been sourced from hilltops.
5.2 Landslide density maps no landslides for landslides triggered during Hurricane Maria
in Puerto Rico, USA. Burrows et al. (2020) used SAR coher-
Landslide density maps have been used to identify spatial ence change with S1 and ALOS-2 data at a ∼ 200 × 220 m
trends in landslide occurrence and to identify areas that were resolution to generate coherence change density maps for
critically damaged during landslide events (e.g., Bessette- landslides triggered by the 2015 Mw 7.8 Gorkha, Nepal,
Kirton et al., 2019; Burrows et al., 2020; Rosi et al., 2018). earthquake; the 2018 Mw 6.7 Hokkaidō, Japan earthquake;
These density maps are also well suited for rapid response and two 2018 Lombok, Indonesia, earthquakes of Mw 6.8
because they do not require detailed and time-consuming and 6.9.
mapping. Additionally, landslide density maps can also be Our landslide density heatmap approach is similar to other
compared or combined with empirical landslide susceptibil- density maps; however instead of counting individual land-
ity models, which typically operate with a coarse resolution slides, we calculate the density of individually detected pix-
(kilometer-scale pixels), to further refine landslide detection els over a fixed area. That means that the landslide density is
capabilities (Burrows et al., 2021). calculated at the sub-landslide scale. One major advantage of
Landslide density maps are typically made by counting our heatmap approach with SAR change detection in GEE is
the number of landslides within a fixed area. For example, that the processing can be done within a short period of time
Bessette-Kirton et al. (2019) used a 2 × 2 km grid with op- (normally within a few minutes) once the post-event SAR
tical satellite imagery and assigned high landslide density to imagery is available in GEE. The results can be easily in-
> 25 landslides, low landslide density to 1–25 landslides, or terpreted and can highlight areas with the highest amount of
Nat. Hazards Earth Syst. Sci., 22, 753–773, 2022 https://doi.org/10.5194/nhess-22-753-2022A. L. Handwerger et al.: Generating landslide density heatmaps for rapid detection 765
Figure 7. Simulated rapid response heatmap for Huong Phung, Vietnam. (a) Heatmap draped over the NASADEM hillshade of the topogra-
phy with red colors corresponding to areas with high potential landslide density. Heatmap made from stacks consisting of 229 pre-event SAR
images collected between 1 October 2016 and 17 October 2020 and 4 post-event SAR images collected between 19 October and 1 Novem-
ber 2020. Heatmap radius set to 1 km. DEM mask is used to remove low topographic slopes < 10◦ and convex curvature > −0.005 m−1 .
Blue and magenta rectangles show zoomed-in areas in figures (b)–(e). Pre-event (b, c) and post-event (d, e) Sentinel-2 optical images for
high–landslide-density and low-landslide-density zones identified with the heatmap. High-density zones in (c) and (e) appear to correspond
to deforestation.
Figure 8. Simulated rapid response heatmap for Quang Nam, Vietnam. (a–d) Pre- and post-event Sentinel-2 optical images for high-
landslide-density and low-landslide-density zones identified with the heatmap. (e) Heatmap draped over the NASADEM hillshade of the
topography with red colors corresponding to areas with high potential landslide density. Heatmap made from stacks consisting of 253 pre-
event SAR images collected between 1 October 2016 and 27 October 2020 and 4 post-event SAR images collected between 29 October
and 7 November 2020. Heatmap radius set to 1 km. DEM mask is used to remove low topographic slopes < 10◦ and convex curvature
> −0.005 m−1 . Blue and magenta rectangles show zoomed-in areas in (a)–(d).
change detection. Furthermore, this method can be easily in- 5.3 Challenges with rapid response landslide detection
tegrated with population density or land use maps to further
prioritize rescue missions after a significant landslide event.
For the landslide EOIs we examined, we found our heatmap Despite the overall success of our case studies, we acknowl-
approach was able to highlight areas with high landslide den- edge there are many challenges when attempting to detect
sity for the real-time (Haiti) and simulated (Japan and Viet- landslides for rapid response. In this section, we focus on the
nam) rapid response scenarios. challenges and possible sources of error in the rapid response
products. The main challenges of rapid response include the
https://doi.org/10.5194/nhess-22-753-2022 Nat. Hazards Earth Syst. Sci., 22, 753–773, 2022You can also read