Genetic diversity and differentiation in south-western Australian bloodwoods (Corymbia section Calophyllae, Myrtaceae) with different ranges and ...
←
→
Page content transcription
If your browser does not render page correctly, please read the page content below

RESEARCH PAPER
                                                                                                                           https://doi.org/10.1071/BT21081

Genetic diversity and differentiation in south-western
Australian bloodwoods (Corymbia section Calophyllae,
Myrtaceae) with different ranges and abundance
Jane Sampson A, Sarah Tapper A, David Coates A, Margaret Hankinson A, Shelley McArthur A and
Margaret Byrne A,*

                                                 ABSTRACT
 For full list of author affiliations and
 declarations see end of paper
                                                 An understanding of how variation is shared within and among closely related species is important
                                                 for understanding evolutionary processes and managing biological diversity. We studied genetic
 *Correspondence to:
 Margaret Byrne
                                                 structure in the three species occurring in south-western Australia that form the small and
 Biodiversity and Conservation Science,          distinct monophyletic section Calophyllae of the genus Corymbia. We compared diversity in
 Department of Biodiversity, Conservation        nuclear microsatellites and chloroplast DNA sequences in two species with patchy distributions,
 and Attractions, Locked Bag 104, Bentley
                                                 namely, Corymbia haematoxylon (Maiden) K.D. Hill & L.A.S. Johnson and Corymbia ficifolia (F. Muell.)
 Delivery Centre, Perth, WA 6983, Australia
 Email: margaret.byrne@dbca.wa.gov.au            K.D. Hill & L.A.S. Johnson, with that in the widespread congener, C. calophylla (Lindl.) K.D. Hill &
                                                 L.A.S. Johnson. Consistent with predictions for the influence of range and abundance on genetic
 Handling Editor:                                structure in the Australian flora, population differentiation was higher in the two restricted
 Susan Hoebee                                    patchy species than in the widespread, semicontinuous C. calophylla. Genetic diversity in
                                                 C. haematoxylon was similar to that in C. calophylla, but diversity was lower in the highly localised
                                                 C. ficifolia, likely owing to genetic bottlenecks. All three species were distinguished by nuclear
                                                 SSR variation, but C. haematoxylon and C. ficifolia each shared chloroplast haplotypes with
                                                 C. calophylla from incomplete lineage sorting of ancestral variation and introgression. Limited
                                                 evidence of recent hybridisation in two populations of C. haematoxylon was also present.

                                                 Keywords: bottleneck, differentiation, diversity, expansion, forest tree, hybridisation, inbreeding,
                                                 lineage sorting, localised range, patchy abundance.

                                                 Introduction

                                                 Corymbia K.D.Hill & L.A.S.Johnson is a sister lineage to Eucalyptus and Angophora
                                                 (Bayly et al. 2013) and one of the three ecologically and economically important
 Received: 4 July 2021
 Accepted: 20 December 2021                      sclerophyll genera commonly known as eucalypts. The southern lineage of Corymbia on
 Published: 16 February 2022                     the western side of the Australian continent is separated from other taxa in the genus by
                                                 a large geographic disjunction. There are three closely related species that comprise the
 Cite this:                                      ‘south-western bloodwoods’ in section Calophyllae (Bayly et al. 2013), namely, Corymbia
 Sampson J et al. (2022)                         haematoxylon (Maiden) K.D.Hill & L.A.S.Johnson, Corymbia ficilfolia (F.Muell.) K.D.Hill &
 Australian Journal of Botany, 70(2), 146–157.   L.A.S.Johnson, and Corymbia calophylla (Lindl.) K.D.Hill & L.A.S.Johnson. Nicolle (2019)
 doi:10.1071/BT21081
                                                 also included the taxon Corymbia chlorolampra K.D.Hill & L.A.S.Johnson in section
                                                 Calophyllae; however, the name is not generally accepted for use in the Western
 © 2022 The Author(s) (or their
                                                 Australian Flora.
 employer(s)). Published by
 CSIRO Publishing.                                  Morphologically, C. haematoxylon, C. ficifolia and C. calophylla are distinct tree
 This is an open access article distributed      species that generally occupy different habitats in the mesic (6 001 500 mm of rainfall
 under the Creative Commons Attribution-         per annum) area of the south-western corner of Western Australia (Fig. 1). There is
 NonCommercial-NoDerivatives 4.0                 strong morphological and molecular evidence that section Calophyllae forms a
 International License (CC BY-NC-ND).
                                                 monophyletic group (Parra-O et al. 2009; González-Orozco et al. 2016) with the nearest
                                                 closest relative, Corymbia gummifera (Gaertn.) K.D.Hill & L.A.S.Johnson, being found in
 OPEN ACCESS
                                                 eastern Australia. A recent phylogenetic analysis of eucalypts (González-Orozco et al. 2016)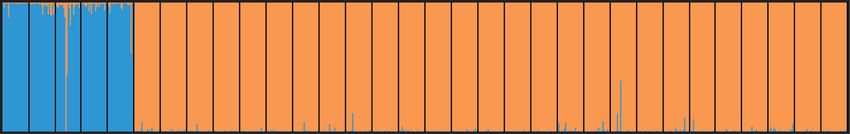
www.publish.csiro.au/bt                                                                                           Australian Journal of Botany

                                                                             The widespread, semi-continuous distribution of
                                                                          C. calophylla extends over the forest and wetter woodland
–30.00

                                                                          regions (800–1300 mm) of south-western Australia (Churchill
                        LES                             Western           1968), with some isolated populations that extend north into
                                                        Australia         the transitional rainfall zone (300–600 mm) on wetter patches
                                                                          of clay soils. In contrast, C. haematoxylon and C. ficifolia
                                                                          have restricted allopatric distributions within the range of
                                MOO
                                                                          C. calophylla. Corymbia haematoxylon occurs in sporadic
                                                                          patches on and near the crest of the Darling Escarpment,
                                                                          with a disjunct population ~270 km north at Mount
                                            JUL                           Lesueur. Hill and Johnson (1995) described the Mount
                                                                          Lesueur population as Corymbia chlorolampra K.D.Hill &
                               LAK
                                       HEL                                L.A.S.Johnson, describing the taxon as a sharply
         Indian Ocean
                                       DAL                                distinguished northern variant, that is now relictual, rare
                                      SER                                 and somewhat displaced by hybrids with C. calophylla. The
                        GOB
–32.50

                                             WEA                          distribution of C. haematoxylon is largely parapatric with
                        PEE     KER
                                           PID                            C. calophylla; however, the species are sympatric in some
                                             SAD
                                                                          populations. Corymbia ficifolia occurs in small, patchy
                       KOR                                                populations in a very restricted area on the southern coast
                                                  GOD
                        EAT                                               of Western Australia in the high-rainfall region and is
                                            YOU
                   WHI          LEN                                       occasionally sympatric with C. calophylla. Genetic analysis in
                                                                          C. calophylla found high nuclear diversity within populations
             MEE
                                     GRI                                  and low differentiation among populations, indicating that
             BRA                                                          the nuclear genetic structure of this widespread, semi-
                       MOW
                                            KIN                           continuous species reflects significant associations with range
                              MIL
                                                                          and abundance (Sampson et al. 2018). This observation is
                                CAR                                       consistent with the findings of a recent review of the
                                                 BOR                      Australian flora by Broadhurst et al. (2017). On the basis of
                              BOO
–35.00

                                       BEA                                these associations, species closely related to C. calophylla but
              N
         0         50
                                                                          with patchy abundance and regional or localised distributions
             km                            PEA                            would be expected to have greater nuclear genetic structure.
                                                                             Here, we report a study of the distinct monophyletic south-
              115.00                                         117.50       western Australian section Calophyllae by using population
                                                                          genetic and phylogenetic analyses of cpDNA sequences and
Fig. 1. Distribution of haplotypes of Corymbia haematoxylon and           nSSR variation in C. haematoxylon and C. ficifolia, in combi-
Corymbia ficifolia in south-western Australia, inferred from analysis of   nation with data reported for C. calophylla by Sampson
cpDNA (psbA–trnH, trnQ–rps16, trnG) sequences, overlaid on
                                                                          et al. (2018). We examine diversity and differentiation to
geographical map of sampling sites. Large pie chart shows proportion
                                                                          determine the contemporary and historical relationships
of individuals with a given haplotype. Small pie charts show sampling
locations of C. calophylla from Sampson et al. (2018) and are             among the species, and to compare the genetic structure of
coloured for populations that share a haplotype with C. haematoxylon      patchy, restricted species and semi-continuous, widespread
or C. ficifolia. The geographic range of C. calophylla is shown by a       species.
dashed line, and those of C. haematoxylon and C. ficifolia as red and
green areas respectively.
                                                                          Materials and methods
based on nuclear (internal transcribed spacer, ITS, and
external transcribed spacer, ETS) and chloroplast sequences               Sampling and genotyping
(matK and psbA–trnH) proposed a temporal sequence of                      Leaves of individuals identified by morphology as
species divergence in section Calophyllae, beginning with                 C. haematoxylon or C. ficifolia were sampled from 24 well
divergence of C. haematoxylon, followed by C. calophylla                  dispersed adult plants in each of three C. haematoxylon and
and C. ficifolia. A detailed study of the evolutionary history of          two C. ficifolia populations (Table 1, Fig. 1). We were not able
C. calophylla on the basis of chloroplast haplotype variation             to sample the northern outlier population of C. haematoxylon
(Sampson et al. 2018) proposed an origin in the northern                  because it had been recently burned. Genomic DNA was
part of the distribution and a predominantly southward                    extracted from lysed, freeze-dried leaf material, following
episodic spatial expansion from the early Pleistocene.                    the methods in Byrne et al. (2016).

                                                                                                                                         147
J. Sampson et al. Australian Journal of Botany
Table 1. Locations and nuclear microsatellite diversity estimates of three Corymbia haematoxylon and two Corymbia ficifolia populations from
south-western Australia.
Species Code Latitude Longitude n A Ho UHe F
Population
Corymbia haematoxylon
Gobby Road GOBA −32.43305600 116.00027800 24 8.13 (0.76) 0.661 (0.058) 0.756 (0.024) 0.136* (0.068)
Koryekup KOR A
−33.08802800 115.92166700 23 7.75 (0.67) 0.647 (0.043) 0.765 (0.021) 0.162* (0.045)
Whicher WHI −33.77191700 115.42400000 23 9.19 (0.70) 0.659 (0.048) 0.777 (0.026) 0.150* (0.053)
Mean 23 8.35 (0.41) 0.656 (0.028) 0.766 (0.014) 0.149* (0.032)
Corymbia ficifolia
Boronia Road BORA −34.80747200 116.86841700 23 4.69 (0.39) 0.618 (0.071) 0.621 (0.029) 0.020 (0.100)
Peaceful Bay PEA −35.02302800 116.93025000 24 7.50 (0.96) 0.710 (0.046) 0.720 (0.031) 0.017 (0.042)
Mean 24 6.09 (0.57) 0.664 (0.042) 0.671 (0.023) 0.019 (0.053)
Corymbia calophylla Mean 23 8.66 (0.18) 0.661 (0.010) 0.711 (0.009) 0.068 (0.008)
Standard errors in parentheses.
*Significantly different from zero, P < 0.05.
A
Corymbia calophylla present at this location.
n, mean sample size per locus; A, mean number of alleles per locus; Ho, observed heterozygosity; UHe, unbiased expected heterozygosity; F, Wright’s Inbreeding
coefficient. Standard errors in parentheses.
The chloroplast psbA–trnH and trnQ–rps16 intergenic Table 2. List of GenBank accessions for haplotypes uncovered in two
spacer regions and the trnG intron were selected for Corymbia ficifolia and three Corymbia haematoxylon populations in south-
amplification and sequencing in eight random samples from western Australia by sequencing of psbA–trnH, trnG and trnQ–rps16
each of the five study populations. Sequence amplification chloroplast intergenic spacers regions.
and analysis were conducted according to Byrne and Item Samples psbA–trnH trnG trnQ–rps16
Hankinson (2012) and sequenced by Macrogen Inc. (Seoul, C. ficifolia
South Korea). SEQUENCHER (ver. 5.0, Genecodes Corp.,
H01 (H01) Peax8, Borx8 KY000369 KY000373 KY000376
Ann Arbor, MI, USA) was used to edit miscalls and to align (navy)
and trim sequences. All three cpDNA regions were
C. haematoxylon
concatenated in MESQUITE (ver. 3.04, see http://www.
mesquiteproject.org; Maddison and Maddison 2016) H01 (H29) Gobx8 KY000371 KY000374 KY000377
(dark red)
to a total sequence length of 2453 bp. One 21-bp inversion
was uncovered in the psbA–trnH region. Following Whitlock H02 (H24) Korx7 KY000370 KY000375 KY000378
(turquoise)
et al. (2010), one configuration of the inversion was
replaced with its reverse-complement and coded as a single H03 (pink) Korx1 KY000372 KY000375 KY000379
transversion. Chloroplast haplotypes were identified using Numbers used by Sampson et al. (2018) for the same haplotype when found in
DNAsp (ver. 5.1.1, see http://www.ub.edu/dnasp/index_v5. C. calophylla are given in parentheses. Colours listed after haplotypes correspond
html; Librado and Rozas 2009; Table 2). to colours used in Fig. 1.
Microsatellite loci developed for section Calophyllae
(Sampson et al. 2018) were amplified using the Multiplex60 using Free NA (see https://www1.montpellier.inra.fr/
PCR program of the Qiagen Multiplex kit (Qiagen, Germany), CBGP/software/FreeNA/; Chapuis and Estoup 2007).
separated on an Applied Biosystems 3730 capillary sequencer To enable comparisons of C. haematoxylon and C. ficifolia
(Foster City, CA, USA), and 120 individuals (24 per with the widespread congener C. calophylla, we obtained
population) were genotyped at 16 loci using GENEMAPPER comparable data for C. calophylla from a previous study for
(ver. 5.0, Applied Biosystems, Foster City, CA, USA). Tests cpDNA sequences from the same gene regions and nSSR
for stutter bands and large allele dropout were conducted data from the same loci (Sampson et al. 2018).
using MICROCHECKER (ver. 2.2.3, see http://www.nrp.
ac.uk/nrp-strategic-alliances/elsa/software/microchecker/;
Chloroplast DNA diversity and divergence
Van Oosterhout et al. 2004). Tests of linkage disequilibrium
among pairs of loci were performed with GENEPOP (ver. 4.2, We measured genetic diversity for cpDNA sequences in
see https://kimura.univ-montp2.fr/~rousset/Genepop.htm; C. haematoxylon and C. ficifolia as nucleotide (π), haplotype
Rousset 2008). The frequency of null alleles was estimated (HD), and within-population haplotype (hs) diversity using
148www.publish.csiro.au/bt Australian Journal of Botany
ARLEQUIN (ver. 3.5.2.2, see http://cmpg.unibe.ch/software/ absence of a 95% confidence interval for the TMRCA, dating
arlequin35/; Excoffier and Lischer 2010). We estimated was conducted using three different hypothetical confidence
population genetic differentiation within species for cpDNA intervals applied to the root age calibration, namely, 2–4, 1–
as GST and NST using PERMUT (ver. 2.0, see https://hal.inrae.fr/ 5 and 0–6 Ma, with four independent runs of 10 million
hal-02810373; Pons and Petit 1996). These measures are generations performed for each of the three scenarios,
analogous to FST except that NST also takes the genetic sampling every 1000 generations. Convergence was assessed
distances between alleles (ordered analysis) into account as in Tracer (ver. 1.6, see https://github.com/beast-dev/tracer/
well as frequency. We estimated global and pairwise differ- releases/latest; Drummond and Rambaut 2007) and trees
entiation between species as FST using pooled data and were combined using LogCombiner (ver. 1.6.2, see https://
ARLEQUIN (Excoffier and Lischer 2010). The partitioning of www.beast2.org) and TREEANNOTATOR (ver. 1.6.2, see
cpDNA genetic variation between species, among populations https://www.beast2.org; Drummond and Rambaut 2007)
within species and within populations was examined by was used to identify a maximum clade credibility tree.
analysis of molecular variance (AMOVA) in ARLEQUIN
(Excoffier and Lischer 2010) with significance tests being Nuclear SSR diversity
based on 1000 permutations based on distance matrices.
Tests for neutrality and population expansion were We measured nSSR genetic variation for each species as mean
calculated with Tajima’s D (Tajima 1989) and Fu’s Fs multilocus parameters per population (number of alleles per
(Fu 1997) in ARLEQUIN, and R2 (Ramos-Onsins and locus, A; observed heterozygosity, Ho, unbiased expected
Rozas 2002), and F and D (Fu and Li 1993) in DNASP by heterozygosity, UHe; Wright’s inbreeding coefficient, F )
using C. gummifera as an outgroup. To infer spatial and by using GENALEX (ver. V6.501, see https://biology-assets.
demographic history, we used mismatch distribution analyses anu.edu.au/GenAlEx/Welcome.html; Peakall and Smouse
in ARLEQUIN. Mismatch analyses test for deviation from the 2012). We compared parameters between species using
distribution of variation expected under spatial or demo- ANOVA and Fisher’s least significant difference (l.s.d.) post
graphic expansion models and, therefore, when P < 0.05, hoc test with data transformation for Ho and UHe.
there is no support for expansion. Goodness-of-fit to models We measured overall differentiation among populations
of spatial or demographic expansion were tested with within species (FST) by using FREENA with and without the
Harpending’s raggedness index (HRag) and the sum of excluding null alleles (ENA) method that corrects for null
squared differences (SSD). alleles, with 1000 bootstraps to generate 95% confidence
To examine the evolutionary relationships of chloroplast intervals (Chapuis and Estoup 2007). We also estimated
haplotypes in section Calophyllae, we constructed a median- global and pairwise differentiation between populations and
joining maximum parsimony (MJMP) network in NETWORK between species as FST, by using GENALEX with statistical
(ver. 5.0, see https://www.fluxus-engineering.com/sharenet. testing by random permutations. If interspecific gene flow
htm; Bandelt et al. 1999). To estimate the divergence date occurs between geographically close populations of two
of haplotypes, molecular dating and phylogeny recon- species, this may be reflected as a significant relationship
struction were simultaneously completed using a strict clock between genetic and geographic distances for the species in
Bayesian analysis in BEAST (ver. 2.4.7, see https://www. parapatric or sympatric parts of their ranges. To test for this
beast2.org; Drummond and Rambaut 2007). All but one possibility in sympatric and parapatric populations of
haplotype of C. haematoxylon and C. ficifolia were represented C. haematoxylon (GOB, KOR, WHI) and C calophylla (SER,
in the C. calophylla network (Sampson et al. 2018) and, KER, PEE, EAT, LEN, MEE), we used a Mantel procedure in
therefore, so as to avoid repetition, we present only the GENALEX to calculate a correlation between log10 pairwise
analysis made using samples from C. haematoxylon and geographic distances and linearised pairwise genetic distances.
C. ficifolia, with C. gummifera as an outgroup. The substitution Similar tests were not undertaken for C. ficifolia with
model was set to the GTR model as inferred as the best fit to the C. calophylla because of the small number of populations.
data by jModelTest (ver. 2.1.7, see https://github.com/
ddarriba/jmodeltest2; Posada 2008). Divergence times were Nuclear DNA structure
estimated under a strict clock model (i.e. with uniform
rates across branches). Date estimates were constrained by We used both phenetic and Bayesian analyses to examine
the inclusion of a root calibration using the estimated genetic structure and whether species boundaries based on
time since most recent common ancestor (TMRCA) of morphology corresponded with genetic differentiation.
C. haematoxylon, C. ficifolia and C. gummifera of 3.0 Ma. Phenetic analyses in PHYLIP (ver. 3.69, see https://
This calibration date was based on an unpublished dated evolution.genetics.washington.edu/phylip.html; Felsenstein
version of the González-Orozco et al. (2016) eucalypt 1989) were used to construct an unrooted neighbour-joining
phylogeny that was calibrated by Andrew Thornhill (pers. (NJ) tree based on CS chord genetic distance calculated
comm.) by using the same eucalypt fossils as previously in MSA: MicroSatellite Analyzer (ver. 4.05, see https://
defined and used in Thornhill and Macphail (2012). In the www.softpedia.com/get/Science-CAD/MSAnalyzer.shtml;
149J. Sampson et al. Australian Journal of Botany
Dieringer and Schlötterer 2003), with clustering patterns promote reproducibility of analyses using STRUCTURE,
validated with 1000 bootstraps. We used Bayesian methods we ran hierarchical analyses with the combined species as
implemented in the program STRUCTURE (ver. 2.3.4, see the highest level. This showed two clusters (q1, q2) that
https://web.stanford.edu/group/pritchardlab/structure.html; corresponded almost entirely to C. calophylla (97.3% of
Pritchard et al. 2000) to identify genetic clusters (K) and their individuals with q1 ≥ 0.95), and a second cluster (q2 ≥ 0.95)
distribution in individuals. To assess the optimum number containing both C. haematoxylon and C. ficifolia (Fig. 2a). We
of clusters and the presence of subclusters in STRUCTURE analysed C. haematoxylon and C. ficifolia as the lower level of
analyses, we used the ΔK statistic of Evanno et al. (2005) the hierarchy. We ran 20 replicates with a burn-in of 100 000
estimated in CLUMPAK (see http://clumpak.tau.ac.il; with 300 000 iterations for Markov-chain Monte Carlo
Kopelman et al. 2015), which tends to identify the parameters for K = 1–20 or K = 1–10 possible clusters for
uppermost level of structure. Two or more optimal K may upper or lower levels of the hierarchy respectively.
be found if samples are taken, as they were in this study, In a recent review of studies using STRUCTURE, Wang
from hierarchically structured samples (section Calophyllae, (2017) concluded that when the sample sizes from groups
species, population; Evanno et al. 2005; Wang 2017). are highly unbalanced, as was the case in this study,
Following the recommendations of (Gilbert et al. 2012) to STRUCTURE tends to merge populations represented by
(a)
MOW
MOO
GOD
WEA
GOB
BOO
BOR
KOR
MEE
YOU
DEN
CAR
BRA
SAD
KER
SER
PEA
BEA
PEE
LEN
EAT
DAL
HEL
WHI
LAK
LES
MUI
GRI
JUL
MIL
KIN
PID
1
K=2
0
(b)
1
K=3
0
BEA
(c)
DE I
MU
CAR
W
BO
N
MO
O
KIN
A
BR
I
E
GR
573
BO
R ME
51
PE
LEN
8
A
4
54
67
2 MIL
6
WHI
998 53
995 1000
KOR 709
796 GOD
GOB EAT
LA
R PE K
550
KE L
JU E
PI
SA U
D
YO
D LES
HEL
MOO
W
DA
600.0
SER
EA
L
Fig. 2. The genetic structure of sampled populations of Corymbia haematoxylon, Corymbia ficifolia
and Corymbia calophylla [from Sampson et al. (2018)] in south-western Australia inferred using
Bayesian assignment of individual nuclear microsatellite genotypes and STRUCTURE (ver. 2.3.4).
(a) Structure at K = 2 and (b) structure at K = 3. Each individual is represented as a single line,
with coloured segments representing the proportion of ancestry from k clusters (q). Results are
optimal alignment of replicates. (c) Genetic structure shown as a neighbour-joining (NJ) tree of
CS chord distance. Support is shown on the branches as the number of bootstraps of 1000.
Values >500 are shown.
150www.publish.csiro.au/bt Australian Journal of Botany
smaller samples. In this situation, Wang (2017) recommends (a) H01H
use of a specific parameter combination to avoid misiden-
tification of structure and to estimate admixture. We
adopted these recommendations and used the parameters
of no prior knowledge, the alternative ancestry prior of
separate alphas for each population, an initial ALPHA value 15 mutations
of 0.1, and the correlated allele frequency models.
31mutations
18 mutations
Results
Chloroplast diversity and divergence
Haplotypes from each species are denoted by subscripts
(e.g. H01H, C. haematoxylon; H01F, C. ficifolia; H01C,
C. calophylla). No cpDNA diversity was found in C. ficifolia
because it had only one haplotype. The single C. ficifolia
haplotype (H01F; Table 2) was also the most common and H02H H03H
H04H
one of the two more widely distributed haplotypes found in
C. calophylla by Sampson et al. (2018) (H01C; Fig. 1).
Chloroplast DNA diversity was low in C. haematoxylon,
(π = 0.009, s.d. = 0.005; HD = 0.721, s.d. = 0.036; H01F
hS = 0.083, s.d. = 0.083) with four haplotypes being detected,
but differentiation among populations was high (GST = 0.917, (b)
Corymbia gummifera
s.d. = 0.083, NST = 0.976, s.d. = 0.032), with no haplotypes
shared among populations. There was one haplotype specific H01F
to C. haematoxylon (H03H), and three haplotypes (H01H,
H02H, H04H) that were shared with C. calophylla (H29C, 2.680 Ma (1.013 – 5.998) H03H
H24C, H15C; Sampson et al. 2018). The shared haplotypes
were found in populations within 50 km of each other (Fig. 1). 1
H04H
In the haplotype network, the C. ficifolia haplotype and 0.413 Ma (0.071 – 0.999)
three of the four C. haematoxylon haplotypes were located 1
2.152 Ma (1.000 – 4.821) H02H
at one end of the network with weakly diverged haplotypes
from C. calophylla (H01F, H02H, H03H, H04H; Fig. 3a). In
H01H
contrast, the divergent H01H haplotype, which was also
found in C. calophylla (H29C), was located at the opposite 30,0000.0 years
end of the network among highly divergent haplotypes of
Fig. 3. Genetic structure of sampled populations of Corymbia
C. calophylla.
haematoxylon and Corymbia ficifolia in south-western Australia,
Overall, cpDNA genetic differentiation among taxa was
inferred from analysis of cpDNA (psbA–trnH, trnQ–rps16, trnG)
moderate (FST = 0.335; Table 3), but C. ficifolia was more haplotypes. (a) Median-joining maximum parsimony (MJMP) haplotype
highly differentiated from C. haematoxylon (FST = 0.780) network. Corymbia haematoxylon and C. ficifolia haplotypes are shown as
and C. calophylla (FST = 0.464) than C. haematoxylon was coloured segments in a network including haplotypes of C. calophylla.
from C. calophylla (FST = 0.133). AMOVA analyses of the Circle size in the network is relative to haplotype frequency and
combined species showed more cpDNA genetic diversity boxes on the network branches represent mutations. (b) Maximum
among populations within species (67.21%; Table 4) than clade-credibility tree from Bayesian phylogenetic analyses with the
among species (22.66%). outgroup C. gummifera, calibrated using 0–6-Ma CI calibration
We found evidence of spatial expansion in chloroplast applied to a known root age from eucalypt fossils.
DNA sequence data from C. haematoxylon as deviation from
neutral expectations [(SSD) = 0.112, P > 0.05 (HRag) = 0.342, In the BEAST (ver. 2.4.7) phylogenetic reconstruction
P > 0.05)]. However, there was no significant evidence to analysis using the 0–6-Ma CI (Fig. 3b), divergence dates for
support demographic expansion (Tajima’s D = 2.504; Ramos- haplotypes shared with C. calophylla were similar to those
Onsins and Rozas R2 = 0.159, Fu’s FS = 20.929, Fu and Li’s obtained by Sampson et al. (2018), although confidence
D = 1.624, Fu and Li’s F = 2.327). Mismatch analyses did intervals were larger owing to the smaller sample size. In
not conform to a model of demographic expansion this analysis, the H01H (=H29C) haplotype, placed at one
(SSD = 0.178, P < 0.05; HRag = 0.343, P < 0.05). end of the haplotype network (Fig. 3a), diverged in the
151J. Sampson et al. Australian Journal of Botany
Table 3. Global and pairwise differentiation (FST) among Corymbia in each species and is unlikely to indicate chromosomal
haematoxylon, Corymbia ficifolia and Corymbia calophylla. linkage. We detected 24 and 7 frequencies of null alleles
cpDNA nSSR significantly greater than 0.05 in C. haematoxylon and
Group FST FST
C. ficifolia respectively (data not shown). Comparison of
FST (95% CI) estimates with and without ENA adjustment
Global 0.335 0.207
(reported here) showed that null alleles did not cause
C. haematoxylon–C. ficifolia 0.780 0.183
significant bias and, therefore, loci were not excluded from
C. haematoxylon–C. calophylla 0.133 0.154 analyses.
C. ficifolia–C. calophylla 0.464 0.193 Nuclear microsatellite diversity in C. ficifolia was
moderate (A = 6.09, Ho = 0.664, UHe = 0.671; Table 1)
Data for C. calophylla from Sampson et al. (2018).
and in C. haematoxylon it was high (A = 8.35, Ho = 0.656,
UHe = 0.766), similar to that in C. calophylla (A = 8.66,
early Pleistocene c. 2.152 Ma. All other haplotypes, found at Ho = 0.661, UHe = 0.711; Sampson et al. 2018). When all
the opposite end of the network with weakly diverged three species were compared, diversity was lowest in
C. calophylla haplotypes, were estimated to have diverged C. ficifolia, with A and UHe values significantly lower than
later (c. 0.413 Ma). The unique C. haematoxylon haplotype in both C. calophylla and C. haematoxylon (F2,29 = 16.80,
(H03H) diverged most recently (c. 0.122 Ma). Trees and P < 0.01; F2,29 = 13.34, P < 0.01). Inbreeding coefficients
dates derived from the 0–6-, 1–5- and 2–4-Ma CI applied to were significantly positive for all populations of
the root age calibration were similar. C. haematoxylon (F = 0.136–0.142; Table 1), but significant
inbreeding was not detected in C. ficifolia.
Nuclear diversity and structure All species were delimited by patterns of nSSR variation
We identified 18 species-specific alleles in C. haematoxylon as shown by moderately high interspecific FST (Table 3), a
and seven in C. ficifolia among 347 alleles found in greater proportion of diversity among species than among
section Calophyllae. No evidence of stutter or large allele populations (Table 4), and by individuals and populations
dropout was detected for nSSR loci in C. haematoxylon and grouping as species in the STRUCTURE and NJ tree analyses
C. ficifolia. The overall frequency of missing data was low (Fig. 2b, c). Genetic differentiation of populations within
(2.28% missing single-locus genotypes), with a very low species was significantly higher in C. ficifolia (FST = 0.119,
number of single-locus genotypes missing per individual CI 0.086–0.152) than in C. haematoxylon (FST = 0.064, CI
(mean = 0.023). Two individuals were excluded from 0.048–0.081) or C. calophylla (FST = 0.032, CI 0.029–0.037;
STRUCTURE analyses because of the frequency of missing Sampson et al. 2018), and also higher in C. haematoxylon
single-locus genotypes (>50%), which can result in poor than in C. calophylla. Within the geographic range of
assignment. The frequency of significant composite genotypic C. haematoxylon, there was no significant association of
disequilibrium among loci was high in one C. haematoxylon pairwise geographic and genetic distances between
population (WHI) and very high in one C. ficifolia popula- C. haematoxylon and C. calophylla populations (r2 = −0.017,
tion (BOR); 28 instances of a possible 360 in C. haematoxylon P > 0.05). Differentiation of species based on nSSRs
where 18 were expected by chance (P < 0.05; 1XGOB, 1XKOR, was lowest between C. haematoxylon and C. calophylla
26XWHI), and 73 instances of a possible 240 in C. ficifolia (FST = 0.154; Table 3). Differentiation of C. ficifolia and
where 12 were expected by chance (P < 0.05; 72XBOR, C. haematoxylon, and of C. ficifolia and C. calophylla was
1XPEA). Disequilibrium was concentrated in one population higher, although similar. In contrast to cpDNA, more nSSR
Table 4. Analysis of molecular variance (AMOVA) of Corymbia haematoxylon, Corymbia ficifolia, and Corymbia calophylla (data from Sampson et al.
2018) on the basis of chloroplast haplotypes and nuclear microsatellite loci.
Source of variation d.f. SS Variance component Percenteage variation
Chloroplast haplotypes
Among species 2 529.5 4.455 22.66
Among populations within species 29 3123.5 13.214 67.21
Within populations 224 446.3 1.992 10.31
Nuclear microsatellites
Among species 2 335.1 0.734 14.20
Among populations within species 29 358.3 0.169 3.26
Within populations 1504 6416.9 4.267 82.54
152www.publish.csiro.au/bt Australian Journal of Botany
variation was found among species (14.20%; Table 4) than Australia that have differences in range and abundance.
among populations within species (3.26%). Patterns of higher diversity in regional or widespread v.
Species were clearly separated in the consensus NJ tree of highly localised species, and greater differentiation among
CS chord genetic distance, with populations clustering as patchy v. semi-continuous species were consistent with the
species with strong (>99%) bootstrap support and with no predictions of population genetic theory and the associa-
other significant groupings (Fig. 2c). In the STRUCTURE tions identified in a meta-analysis of the Australian flora
analysis, the three species were identified using two levels (Broadhurst et al. 2017). Species were clearly differentiated
of hierarchical analyses (Fig. 2a for the higher level, in the nuclear genome but chloroplast haplotypes were
and Supplementary Material Fig. S1a for the lower level). shared across species. Incomplete lineage sorting, that is
The lower level is not presented separately here because it the retention of genetic variation from common ancestors,
is largely replicated in Fig. 2b showing all species. At the may be the most parsimonious explanation for shared
highest level (Fig. 2a), the optimal number of clusters haplotypes between C. ficifolia and C. calophylla, whereas
identified was K = 2 by using ΔK (see Supplementary both incomplete lineage sorting and ancient hybridisation
Material Fig. S1b), with high similarity of the program runs have probably influenced the pattern of shared haplotypes
(h 0 = 0.999). At K = 2, one cluster (q1) comprised in C. haematoxylon and C. calophylla. Admixture in nuclear
predominantly C. calophylla individuals (97.3%, q1 ≥ 0.95) variation in a few individuals also suggests some more recent
and a second cluster (q2) comprised all C. haematoxylon hybridisation between C. calophylla and C. haematoxylon.
and C. ficifolia individuals (100%, q2 ≥ 0.95). At the lower
level of analysis (Fig. S1a), the q2 cluster was subdivided Relationships among species
into two subclusters by optimal ΔK (Supplementary
All three species were separated by nuclear variation;
Material Fig. S1c; h 0 = 0.999), corresponding largely to C.
however, although cpDNA sequence variation clearly
haematoxylon and C. ficifolia. Admixture of the two
delimited C. haematoxylon from C. ficifolia, neither of these
subclusters above 5% was found in 1.4 and 10.4% of
two species were delimited from C. calophylla. The presence
individuals respectively. Overall, the three species could be
of shared haplotypes in cpDNA despite clear distinction of
identified with high accuracy using two levels of
species on the basis of nuclear variation has been noted
hierarchical analysis. This pattern was also supported by
previously in other eucalypts (McKinnon et al. 2010), as
the clustering pattern of the entire dataset (Fig. 2b), for
well as in other angiosperms (Kikuchi et al. 2010; Ley and
which there was a minor change in the rate of ΔK at 3
Hardy 2010; Wang et al. 2011). Shared haplotypes can
(Supplementary Material Fig. S1b). A further peak at K = 5
arise as a result of retention of variation from a common
showed three clusters corresponding to the species, with
ancestor because of the slower rate of lineage sorting in the
additional clusters indicating substructure within C.
maternally inherited chloroplast genome (Currat et al.
calophylla (see Sampson et al. 2018 for a description of this 2008). It can also indicate past hybridisation in areas of
substructure). past or present sympatry owing to chloroplast capture or
When the entire dataset was anaysed at K = 3, admixture seed dispersal (Dixon et al. 2007; Kikuchi et al. 2010).
levels were low with 8.5, 2.1 and 0.8% of individuals in The lack of shared haplotypes and clear differentiation
C. haematoxylon, C. ficifolia and C. calophylla respectively in the nuclear genome between C. haematoxylon and
showing total admixture of ≥10%. Although low overall, C. ficifolia is likely to reflect complete lineage sorting in
C. haematoxylon showed the most admixture with 17.5% cpDNA, a lack of gene flow between allopatric populations
of WHI and 8.4% of GOB, with individuals showing of C. haematoxylon and C. ficifolia, and the timing of diver-
≥10% admixture from C. calophylla. The only C. ficifolia gence of C. haematoxylon and C. ficifolia from a common
individual with admixture ≥10% was from PEA population ancestor. This would be consistent with the phylogeny
and had ~5% admixture from both parapatric C. calophylla proposed by González-Orozco et al. (2016) in which
and allopatric C. haematoxylon clusters. Two individuals C. haematoxylon diverged first, followed by C. calophylla
in the KER population of C. calophylla that is sympatric and, most recently, C. ficifolia.
with C. haematoxylon showed combined admixture to For C. ficifolia, the southern location, low diversity and
C. haematoxylon and C. ficifolia of more than 10%, and one strong nSSR delineation of C. ficifolia from C. calophylla,
individual in the MOW population showed admixture from together with a shared recently diverged haplotype,
C. ficifolia. suggest that incomplete lineage sorting may be the more
parsimonious explanation for shared variation between
these species. Corymbia ficifolia is found in the wetter
Discussion southern extremity of the distribution of C. calophylla. In
the expansion scenario proposed by Sampson et al. (2018),
Different patterns of diversity and differentiation were the range of C. calophylla is proposed to have expanded
evident among the three Corymbia species of south-western southward, beginning c. 0.426 million years ago, into the
153J. Sampson et al. Australian Journal of Botany
area where C. ficifolia now occurs, following the southward in two individuals in the KER population of C. calophylla
progress of increasing aridity. The shared recently diverged was from both C. haematoxylon and C. ficifolia, suggesting
haplotype in C. ficifolia and divergence in the late Pleistocene secondary genomic admixture rather than recent gene flow
are consistent with the proposed recent divergence of because this population is 275 km distant from the range of
C. ficifolia from C. calophylla on the basis of the phylogeny C. ficifolia. Other populations of C. calophylla within the
of González-Orozco et al. (2016). distribution of C. haematoxylon did not show evidence of
The relationship of C. haematoxylon and C. calophylla recent hybridisation.
is probably more complex. The distribution of shared Some historic and recent hybridisation may also be an
chloroplast haplotypes reflects some influence of the broad explanation for the relatively lower level of differentiation
geographic distribution of populations, but haplotypes are between C. haematoxlyon and C. calophylla compared with
not shared by the geographically closest populations, C. ficifolia and C. calophylla, which is not consistent
suggesting historical introgression and incomplete lineage with the phylogenetic relationships and species divergence
sorting rather than recent hybridisation through seed- proposed by González-Orozco et al. (2016), in which
mediated gene flow. A geographic pattern of cpDNA variation C. haematoxylon diverged earlier and C. ficifolia later.
has previously been interpreted as evidence of historical
introgression in other Eucalyptus and Corymbia species Species’ range and abundance and patterns of
(McKinnon et al. 2004; Pollock et al. 2013; Healey et al. diversity
2018). Similarly, shared ancestral polymorphism is inferred
when cpDNA haplotype sharing occurs among haplotypes Many reviews of nuclear genetic variation have found that
internal to network rather than at the tips (Schaal and genetic structure is influenced by the interaction of mating
Leverich 2001) and for populations in close geographic systems, life-history traits, chromosomal variation, popula-
proximity (Muir and Schlötterer 2005). This is the general tion distribution, and other ecological traits related to gene
pattern found in C. haematoxylon and C. calophylla for flow (Loveless and Hamrick 1984; Gitzendanner and Soltis
three of the four haplotypes. The other haplotype is highly 2000; Nybom 2004; Duminil et al. 2007; Ellstrand 2014). In
divergent (separated by c. 1.5 million years ago from the a review focussed on the Australian flora, Broadhurst et al.
three haplotypes) tip haplotype that suggests introgression (2017) found that the most important attributes influencing
rather than incomplete lineage sorting, although that nuclear DNA differentiation were range disjunctions and
haplotype is not common in C. caloplhylla. abundance (patchy v. semi-continuous), whereas range
Current hybridisation has been observed in many size (localised v. regional or widespread) and abundance
eucalypts (e.g. Field et al. 2011; Bradbury et al. 2016; Robins (localised or patchy v. semi-continuous) had greater influence
et al. 2021) and also in species of Corymbia (Shepherd et al. on diversity. There are no significant range disjunctions in
2008; Ochieng et al. 2010). Even though hybridisation any of these three Corymbia species, but comparison of the
between C. haematoxylon and C. calophylla, and between patterns of differentiation reflected the predicted influence of
C. ficifolia and C. calophylla, has been noted anecdotally in abundance in the semi-continuously distributed C. calophylla
localised situations, we did not seek to test this explicitly compared with the patchily distributed C. haematoxylon and
and rather sought to determine species-level relationships C. ficifolia. As predicted by population genetic theory, nuclear
separate from any localised recent hybridisation. As population differentiation was higher in C. haematoxylon and
expected, we did not see evidence of extensive hybridisation C. ficifolia than in C. calophylla. This can be attributed to
among the species because we observed a pattern of high lower gene flow among patchily distributed populations than
differentiation and identified structure among species in the among semi-continuous populations, because lower gene
nuclear genome, and limited instances of admixture unrelated flow reduces the immigration of new variants and increases
to geographic proximity. This is contrary to expectations genetic divergence among populations. Identification of
when hybridisation is extensive where one might expect the influence of abundance and distribution is somewhat
to find low differentiation and structure in nSSRs among the unexpected because gene flow through pollen dispersal
genetically distinct species, a significant association between can be extensive in eucalypts over long distances in open
geographical proximity and relatedness, and extensive woodlands and in fragmented landscapes (Byrne et al.
admixture of individuals in geographically proximal 2008; Sampson and Byrne 2008; Mimura et al. 2009),
populations of the different species (Edwards et al. 2008). whereas it is generally localised in more continuous forest
The levels of genetic differentiation among species populations (Barbour et al. 2008; Jones et al. 2008). Seed-
(FST = 0.154–0.193) are as expected for closely related taxa mediated dispersal is likely to be low in all three species
of eucalypts (Byrne 2008; Bradbury et al. 2021), indicating because seeds are primarily gravity dispersed in eucalypts
little introgression at the species level. Some admixture was (Booth 2017) and thus unaffected by abundance or popula-
evident in a few individuals in the WHI population of tion distribution.
C. haematoxylon, suggesting a small level of recent hybridisa- Comparisons within section Calophyllae also illustrated
tion with C. calophylla in this population. Admixture identified the influence of range and abundance on genetic diversity
154www.publish.csiro.au/bt Australian Journal of Botany
as well as differentiation. Abundance can influence diversity Conclusions
because patchily distributed populations are often smaller
than semi-continuous populations, making them more prone Analysis of genetic relationships among the three species of
to genetic drift and inbreeding that can reduce genetic Corymbia in south-western Australia confirmed distinction
variation (Loveless and Hamrick 1984; Ellstrand and of the species, with greater differentiation between the
Elam 1993). Wider-ranging and more abundant species geographically disjunct C. haematoxylon and C. ficifolia,
should be buffered against loss of genetic diversity by their and closer relationships between each of these with the
larger effective population size. The lower levels of widespread C. calophylla. As expected in closely related
diversity in the localised C. ficifolia than in both the regional eucalypt species, some incomplete lineage sorting, introgres-
C. haematoxylon and the widespread C. calophylla suggest sion and ancient hybridisation was evident because cpDNA
that a threshold effect from range size has a stronger effect haplotypes in the two restricted species were shared with
than abundance in these species. We did find evidence of the widespread species. There was some evidence of limited
significant inbreeding in populations of C. haematoxylon, recent hybridisation with admixture in a few individuals in
although levels were low and not associated with reduced a population of C. haematoxylon and in a population of
diversity. Overall, Wright’s F-values indicated mixed mating C. calophylla within the distribution of C. haematoxylon.
systems in all three species. This type of mating system is The genetic structure in C. haematoxylon and C. ficifolia
commonly found in eucalypts and considered to contribute reflects the influence of geographic range and abundance
to maintaining diversity (Byrne 2008; Barrett and Harder on nuclear DNA diversity and differentiation. Greater
2017), and we found no evidence that the observed signifi- differentiation within C. haematoxylon and C. ficifolia than
cant inbreeding led to loss of diversity in patchy v. semi- within C. calophylla is probably due to a lower gene flow
continuous species, suggesting that the influence of range between small and patchy populations, despite the potential
on diversity may be more important in these species. for extensive gene flow through pollen dispersal in eucalypt
Species such as C. ficifolia that are distributed as small, taxa. Lower diversity in C. ficifolia is likely to reflect the
patchy populations within highly localised ranges, might vulnerability of highly localised small populations to loss of
be expected to be more prone to loss of diversity through diversity through stochastic events.
drift and stochastic processes such as genetic bottlenecks.
We found evidence of a bottleneck in one population of
C. ficifolia (BOR) as a very high frequency of composite Supplementary material
genotypic diseqilibrium, resulting in significantly lower
diversity but without inbreeding. Bottlenecks might occur Supplementary material is available online.
following recurrent severe fires that characterise the south-
western landscape (Pickett 1997; Prideaux et al. 2010) and References
there was evidence of recent fires in BOR at the time of
collection. The wider range and larger effective population Bandelt HJ, Forster P, Röhl A (1999) Median-joining networks for
inferring intraspecific phylogenies. Molecular Biology and Evolution
size in C. haematoxylon probably buffers this species 16, 37–48. doi:10.1093/oxfordjournals.molbev.a026036
against the loss of diversity apparent in the more localised Barbour RC, Otahal Y, Vaillancourt RE, Potts BM (2008) Assessing the risk
C. ficifolia. of pollen-mediated gene flow from exotic Eucalyptus globulus
plantations into native eucalypt populations of Australia. Biological
The relatively low haplotype diversity we found in the Conservation 141, 896–907. doi:10.1016/j.biocon.2007.12.016
patchy populations of regional C. haematoxylon and localised Barrett SCH, Harder LD (2017) The ecology of mating and its evolutionary
consequences in seed plants. Annual Review of Ecology, Evolution, and
C. ficifolia when compared with high diversity in widespread
Systematics 48, 135–157. doi:10.1146/annurev-ecolsys-110316-
C. calophylla was expected because the chloroplast genome 023021
generally maintains lower diversity than does the nuclear Bayly MJ, Rigault P, Spokevicius A, Ladiges PY, Ades PK, Anderson C,
Bossinger G, Merchant A, Udovicic F, Woodrow IE, Tibbits J (2013)
genome and is more influenced by abundance because of Chloroplast genome analysis of Australian eucalypts – Eucalyptus,
its lower effective population size. However, as yet, there Corymbia, Angophora, Allosyncarpia and Stockwellia (Myrtaceae).
are few comparative studies of closely related species Molecular Phylogenetics and Evolution 69, 704–716. doi:10.1016/
j.ympev.2013.07.006
with different distribution and abundance. In Western Booth TH (2017) Going nowhere fast: a review of seed dispersal in
Australia, where patchy distributions are common, low eucalypts. Australian Journal of Botany 65, 401–410. doi:10.1071/
levels of chloroplast nucleotide and haplotype diversity BT17019
Bradbury D, Grayling PM, MacDonald B, Hankinson M, Byrne M (2016)
have also been reported by several studies of species Clonality, interspecific hybridisation and inbreeding in a rare
with regional or localised patchy distributions (Kunzea mallee eucalypt, Eucalyptus absita (Myrtaceae), and implications for
pulchella, Tapper et al. 2014; Hakea oldfieldii, Sampson conservation. Conservation Genetics 17, 193–205. doi:10.1007/
s10592-015-0771-8
et al. 2015; Acacia atkinsiana, Levy et al. 2016), supporting Bradbury D, Binks RM, Byrne M (2021) Genomic data inform
this association. conservation of rare tree species: clonality, diversity and hybridity
155J. Sampson et al. Australian Journal of Botany
in Eucalyptus series in a global biodiversity hotspot. Biodiversity and Fu Y-X (1997) Statistical tests of neutrality of mutations against
Conservation 30, 619–641. doi:10.1007/s10531-020-02106-2 population growth, hitchhiking and background selection. Genetics
Broadhurst L, Breed M, Lowe A, Bragg J, Catullo R, Coates D, Encinas-Viso 147, 915–925. doi:10.1093/genetics/147.2.915
F, Gellie N, James E, Krauss S, Potts B, Rossetto M, Shepherd M, Byrne Fu YX, Li WH (1993) Statistical tests of neutrality of mutations. Genetics
M (2017) Genetic diversity and structure of the Australian flora. 133, 693–709. doi:10.1093/genetics/133.3.693
Diversity and Distributions 23, 41–52. doi:10.1111/ddi.12505 Gilbert KJ, Andrew RL, Bock DG, Franklin MT, Kane NC, Moore JS,
Byrne M (2008) Eucalypt phylogeny, diversity and evolution. In ‘Plant Moyers BT, Renaut S, Rennison DJ, Veen T, Vines TH (2012)
genome: biodiversity and evolution. 1E: phanerogam – angiosperm’. Recommendations for utilizing and reporting population genetic
(Eds AK Sharma, A Sharma) pp. 303–346. (Science Publishers: analyses: the reproducibility of genetic clustering using the program
Enfield, NH, USA) structure. Molecular Ecology 21, 4925–4930. doi:10.1111/j.1365-
Byrne M, Hankinson M (2012) Testing the variability of chloroplast 294X.2012.05754.x
sequences for plant phylogeography. Molecular Ecology Resources 60, Gitzendanner MA, Soltis PS (2000) Patterns of genetic variation in rare
569–574. doi:10.1071/BT12146 and widespread plant congeners. American Journal of Botany 87,
Byrne M, Elliott CP, Yates CJ, Coates DJ (2008) Maintenance of high 783–792. doi:10.2307/2656886
pollen dispersal in Eucalyptus wandoo, a dominant tree of the González-Orozco CE, Pollock LJ, Thornhill AH, Mishler BD, Knerr N,
fragmented agricultural region in Western Australia. Conservation Laffan SW, Miller JT, Rosauer DF, Faith DP, Nipperess DA, Kujala
Genetics 9, 97–105. doi:10.1007/s10592-007-9311-5 H, Linke S, Butt N, Külheim C, Crisp MD, Gruber B (2016)
Byrne M, Coates DJ, Macdonald BM, Hankinson M, McArthur SM, Phylogenetic approaches reveal biodiversity threats under climate
van Leeuwen S (2016) High nuclear genetic differentiation, but low change. Nature Climate Change 6(12), 1110–1114. doi:10.1038/
chloroplast diversity in a rare species, Aluta quadrata (Myrtaceae), nclimate3126
with a disjunct distribution in the Pilbara, Western Australia. Healey A, Lee DJ, Furtado A, Henry RJ (2018) Evidence of inter-sectional
Australian Journal of Botany 64, 687–695. doi:10.1071/BT16128 chloroplast capture in Corymbia among sections Torellianae and
Chapuis M-P, Estoup A (2007) Microsatellite null alleles and estimation Maculatae. Australian Journal of Botany 66, 369–378. doi:10.1071/
of population differentiation. Molecular Biology and Evolution 24, BT18028
621–631. doi:10.1093/molbev/msl191 Hill K, Johnson L (1995) Systematic studies in the eucalypts 7. A revision
Churchill DM (1968) The distribution and prehistory of Eucalyptus of the bloodwoods, genus Corymbia (Myrtaceae). Telopea 6, 185–504.
diversicolor F.Muell., E. marginata Donn ex SM., and E. calophylla doi:10.7751/telopea19953017
R.Br. in relation to rainfall. Australian Journal of Botany 16, 125–151. Jones ME, Shepherd M, Henry R, Delves A (2008) Pollen flow in
doi:10.1071/BT9680125 Eucalyptus grandis determined by paternity analysis using micro-
Currat M, Ruedi M, Petit RJ, Excoffier L (2008) The hidden side satellite markers. Tree Genetics & Genomes 4, 37–47. doi:10.1007/
of invasions: massive introgression by local genes. Evolution 62, s11295-007-0086-0
1908–1920. doi:10.1111/j.1558-5646.2008.00413.x Kikuchi R, Jae-Hong P, Takahashi H, Maki M (2010) Disjunct distribution
Dieringer D, Schlötterer C (2003) MICROSATELLITE ANALYSER: a of chloroplast DNA haplotypes in the understory perennial Veratrum
platform independent analysis tool for large microsatellite data sets. album ssp. oxysepalum (Melanthiaceae) in Japan as a result of
Molecular Ecology Notes 3, 167–169. doi:10.1046/j.1471-8286.2003. ancient introgression. New Phytologist 188, 879–891. doi:10.1111/
00351.x j.1469-8137.2010.03398.x
Dixon CJ, Schönswetter P, Schneeweiss GM (2007) Traces of ancient Kopelman NM, Mayzel J, Jakobsson M, Rosenberg NA, Mayrose I (2015)
range shifts in a mountain plant group (Androsace halleri complex, Clumpak: a program for identifying clustering modes and packaging
Primulaceae). Molecular Ecology 16, 3890–3901. doi:10.1111/ population structure inferences across K. Molecular Ecology Resources
j.1365-294X.2007.03342.x 15, 1179–1191. doi:10.1111/1755-0998.12387
Drummond AJ, Rambaut A (2007) BEAST: Bayesian evolutionary analysis Levy E, Byrne M, Coates DJ, Macdonald BM, McArthur S, van Leeuwen S
by sampling trees. BMC Evolutionary Biology 7, 214. doi:10.1186/ (2016) Contrasting influences of geographic range and distribution of
1471-2148-7-214 populations on patterns of genetic diversity in two sympatric Pilbara
Duminil J, Fineschi S, Hampe A, Jordano P, Salvini D, Vendramin GG, acacias. PLoS ONE 11, e0163995. doi:10.1371/journal.pone.0163995
Petit RJ (2007) Can population genetic structure be predicted Ley AC, Hardy OJ (2010) Species delimitation in the Central African herbs
from life-history traits? The American Naturalist 169, 662–672. Haumania (Marantaceae) using georeferenced nuclear and
doi:10.1086/513490 chloroplastic DNA sequences. Molecular Phylogenetics and Evolution
Edwards CE, Soltis DE, Soltis PS (2008) Using patterns of genetic 57, 859–867. doi:10.1016/j.ympev.2010.08.027
structure based on microsatellite loci to test hypotheses of current Librado P, Rozas J (2009) DnaSP v.5: a software for comprehensive
hybridization, ancient hybridization and incomplete lineage sorting analysis of DNA polymorphism data. Bioinformatics 25, 1451–1452.
in Conradina (Lamiaceae). Molecular Ecology 17, 5157–5174. doi:10.1093/bioinformatics/btp187
doi:10.1111/j.1365-294X.2008.03985.x Loveless MD, Hamrick JL (1984) Ecological determinants of genetic
Ellstrand NC (2014) Is gene flow the most important evolutionary force in structure in plant populations. Annual Review of Ecology and
plants? American Journal of Botany 101, 737–753. doi:10.3732/ajb. Systematics 15, 65–95. doi:10.1146/annurev.es.15.110184.000433
1400024 Maddison WP, Maddison DR (2016) Mesquite: a modular system for
Ellstrand NC, Elam DR (1993) Population genetic consequences of small evolutionary analysis. Available at http://mesquiteproject.org.
population size: implications for plant conservation. Annual Review of McKinnon GE, Jordan GJ, Vaillancourt RE, Steane DA, Potts BM (2004)
Ecology and Systematics 24, 217–242. doi:10.1146/annurev.es.24. Glacial refugia and reticulate evolution: the case of the Tasmanian
110193.001245 eucalypts. Philosophical Transactions of the Royal Society of London.
Evanno G, Regnaut S, Goudet J (2005) Detecting the number of clusters of Series B, Biological Sciences 359, 275–284. doi:10.1098/rstb.2003.
individuals using the software STRUCTURE: a simulation study. 1391
Molecular Ecology 14, 2611–2620. doi:10.1111/j.1365-294X.2005. McKinnon GE, Smith JJ, Potts BM (2010) Recurrent nuclear DNA
02553.x introgression accompanies chloroplast DNA exchange between two
Excoffier L, Lischer H (2010) Arlequin suite ver 3.5: a new series of eucalypt species. Molecular Ecology 19, 1367–1380. doi:10.1111/
programs to perform population genetics analyses under Linux and j.1365-294X.2010.04579.x
Windows. Molecular Ecology Resources 10, 564–567. doi:10.1111/ Mimura M, Barbour RC, Potts BM, Vaillancourt RE, Watanabe KN (2009)
j.1755-0998.2010.02847.x Comparison of contemporary mating patterns in continuous and
Felsenstein J (1989) PHYLIP – phylogeny inference package (version 3.2). fragmented Eucalyptus globulus native forests. Molecular Ecology 18,
Cladistics 5, 164–166. doi:10.1086/416571 4180–4192. doi:10.1111/j.1365-294X.2009.04350.x
Field DL, Ayre DJ, Whelan RJ, Young AG (2011) Patterns of hybridization Muir G, Schlötterer C (2005) Evidence for shared ancestral polymorphism
and asymmetrical gene flow in hybrid zones of the rare Eucalyptus rather than recurrent gene flow at microsatellite loci differentiating
aggregata and common E. rubida. Heredity 106, 841–853. two hybridizing oaks (Quercus spp.). Molecular Ecology 14, 549–561.
doi:10.1038/hdy.2010.127 doi:10.1111/j.1365-294X.2004.02418.x
156You can also read


