Geospatial tools for the identification of a malaria corridor in Estado Sucre, a Venezuelan north-eastern state
←
→
Page content transcription
If your browser does not render page correctly, please read the page content below

Geospatial Health 5(2), 2011, pp. 169-176

Geospatial tools for the identification of a malaria corridor in
Estado Sucre, a Venezuelan north-eastern state

Laura Delgado-Petrocelli1, Alberto Camardiel2, Víctor Hugo Aguilar3, Néstor Martinez4,
Karenia Córdova3, Santiago Ramos1
1
 Ecological Information Systems and Environmental Modelling Laboratory (SIMEA), Institute of Tropical
Zoology, Central University of Caracas, Venezuela; 2Postgraduate Area in Statistics and Actuarial Sciences,
Faculty of Economy and Social Sciences, Central University of Caracas, Venezuela; 3Institute of Geography and
Regional Development, Faculty of Humanities and Education, Central University of Caracas, Venezuela;
4
 School of Geography, Faculty of Humanities and Education, Central University of Caracas, Venezuela

Abstract. Landscape ecology research relies on frameworks based on geographical information systems (GIS), geostatistics
and spatial-feature relationships. With regard to health, the approach consists of systems analysis using a set of powerful
tools aimed at the reduction of community vulnerability through improved public policies. The north-oriental malaria focus,
one of five such foci in Venezuela, situated in the north-eastern part of the Estado Sucre state, unites several social and envi-
ronmental features and functions as an epidemiological corridor, i.e. an endemic zone characterised by permanent interac-
tion between the mosquito vector and the human host allowing a continuous persistence of the malaria lifecycle. A GIS was
developed based on official cartography with thematic overlays depicting malaria distribution, socio-economic conditions,
basic environmental information and specific features associated with the natural wetlands present in the area. Generally,
malaria foci are continuously active but when the malaria situation was modelled in the north-oriental focus, a differential,
spatio-temporal distribution pattern situation was found, i.e. a situation oscillating between very active and dormant trans-
mission. This pattern was displayed by spatial and statistical analysis based on the model generated in this study and the
results were confirmed by municipal and county malaria records. Control of malaria, keeping the incidence at a permanently
low level within the regional population, should be possible if these results are taken into account when designing and imple-
menting epidemiological surveillance policies.

Keywords: malaria, geographical information system, remote sensing, spatial analysis, landscape ecology, epidemiological
corridor, Venezuela.

Introduction                                                      technologies such as digital terrain models (DTM),
                                                                  remote sensing, digital image processing and global
   Climate pattern change, natural disasters, cumula-             positioning systems (GPS) is called for. These applica-
tive environmental impact and the emergence and re-               tions produce superior spatial analysis through inte-
emergence of infectious diseases exert an increasing              grated approaches based on geographical information
impact on the world of today. Examples of vulnerable              systems (GIS) and open new possibilities to solve exist-
communities with humans living under critical condi-              ing health problems. Advances in informatics and
tions due to poverty include localities ravished by               computational power, storage and handling of large
malaria and/or other tropical diseases, and where the             volumes of data, have exploded during the latest
environment is negatively influenced by anthropogenic             decades and contributed to the development of new,
activity. In such places, a systemic approach is more             powerful GIS approaches, capable of initiating novel
than ever needed if we are to efficiently manage pub-             ways and means to deal with diseases such as malaria,
lic health issues. The implementation of an effective             Chagas disease, dengue, leishmaniasis and other trop-
environmental strategy based on the use of geospatial             ical diseases.
                                                                     Early on, Kitron (1998) recognised the need for sys-
                                                                  temic approaches to study the epidemiology of para-
Corresponding author:
Santiago Ramos                                                    sitic diseases. In the People’s Republic of China, the
Ecological Information Systems and                                genetic discontinuity of the intermediate host snails of
Environmental Modeling Laboratory (SIMEA)                         schistosomiasis was shown to be ultimately influ-
Caracas, Venezuela
Tel. +58 212 605 1311; Fax +58 212 605 1204                       enced by landscape ecology (Li et al., 2009), while
E-mail: santiago.ramos@ciens.ucv.ve                               Dongus et al. (2009) expose how agricultural and
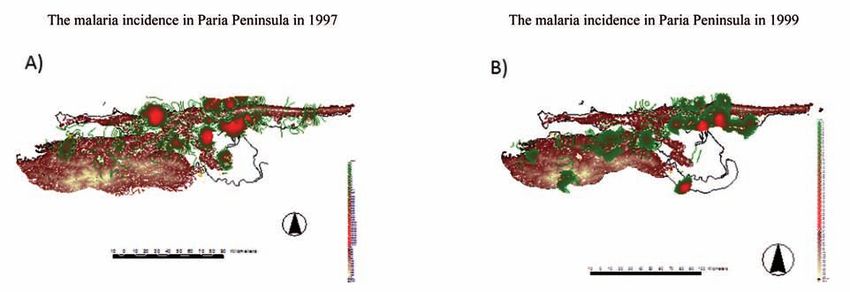
170                    L. Delgado-Petrocelli et al. - Geospatial Health 5(2), 2011, pp. 169-176

geographical features influence the presence of             Material and methods
Anopheles larvae in urban areas in Dar es Salam,
Tanzania. Some authors (Beck et al., 2000; Kitron,          Study area
2000) recommend spatial analysis and utilisation of
the potential of GIS for infectious disease manage-           Paria Peninsula has a surface of 11,800 km2 and is
ment, while others (Romaña et al., 2003) have con-          located between latitudes 10°13’10” and 10°44’10”
ceptualised the epidemiological landscape notion in a       north and longitudes 61°50’44” and 64°30’00” west
way that underlines the importance of ecology. The          (Fig. 1). The Estado Sucre state is divided into 15
idea of epidemic foci as part of landscape ecology is       municipalities, in turn subdivided into 55 smaller,
of paramount interest for our approach, as it holds         administrative units called “parroquias”.
that persistence of endemicity in a geographical local-
ity is supported, indeed ensured, by environmental          Spatial and epidemiological data
and edaphic (soil characteristic) conditions furthering
the coexistence of parasite, vector and host (Romaña          The study was conducted using malaria incidence
et al., 2003). Barrera et al., (1998) studied a malaria     data gathered from records for the 28 parroquias that
hotspot with strong transmission in Venezuela from          make up Paria Peninsula. The parroquia was taken as
that point of view, and this research group also            the spatial unit for the statistical analyses of the
applied this approach to characterise an epidemic of        monthly records of the number of malaria cases
hemorrhagic dengue fever in this country (Barrera et        reported to the local health centres between 1986 and
al., 2000). Subsequently, Delgado and Ramos (2007)          1999. These data were gathered from the malaria divi-
developed a systemic framework derived from the             sion of the former Ministry for Sanitation and Social
concept of landscape ecology by combining various           Assistance (SAS) and the current state office in charge
technologies. This perspective not only provides a          of regional public health (FUNDASALUD-SUCRE).
superior comprehension of the dynamics of rural             The total number of cases included in the investigation
malaria endemicity, but also highlights the relation-       was 4,704.
ship between spatial variables such as height and
slope with malaria risk. The work presented here con-
siders the malaria incidence in the Paria Peninsula, a
region of the Estado Sucre state in Venezuela, in the
light of geographical factors. Here, elementary land-
scape components such as the north-south variation
between highland and lowland and the topographical
coast-to-inland gradients are treated as a matrix dis-
playing patches and corridor patterns with respect to
this disease.
   The hypothesis put forward holds that sequentially
located malaria foci promote the establishment of con-
ditions that support persistent disease, each focus gen-
erating/contributing to an epidemiological, endemic
corridor by spatially relaying the disease along one or
more geographical features. This important compo-
nent of the ecological landscape concept provides a
perspective that we have named “panoramic epidemi-
ology” (Delgado et al., 2007), an approach capable of
pinpointing environmental factors which could be
decisive when designing effective policies for the con-
trol and surveillance of parasitic diseases. Our objec-
tive is to show, through the combination of spatial and
statistical analyses, the presence and dynamics of an
epidemiological malaria corridor in the Paria
Peninsula part of Estado Sucre in the north-eastern
part of Venezuela.                                          Fig. 1. Geographical location of the study area in Venezuela.
L. Delgado-Petrocelli et al. - Geospatial Health 5(2), 2011, pp. 169-176                      171

   The meteorological variables related to the El Niño             emphasises the exploratory point of view, while retain-
Southern Oscillation (ENSO) phenomenon for each                    ing the traditional methods of least-squares estima-
parroquia included in the study, were considered.                  tion. In addition to the ANOVA table, numerical and
Criteria from the National Oceanographic and                       graphical displays were added to gain insight into the
Atmospheric Administration (NOAA) of the United                    data structure. This technique facilitates the explana-
States of America were used and the data correspon-                tion of the effects of spatial and climatic variability
ding to climatic variability came from registers pub-              produced by ENSO events taking intensity and fre-
lished in reports by the NOAA Earth System Research                quency into account.
Laboratory (ESRL; http://www.esrl. noaa.gov/). For                    In order to confirm whether or not there is a statis-
the GIS approach we relied on basic vectorial covers               tically significant association between the number of
(overlays) which include roads, main hydrographic                  malaria cases in the parroquias and the spatio-tempo-
information, human population centres as well as                   ral factors under consideration, we analysed values,
topographic information such as ground level curves                consisting of the natural logarithms + 0.5, of the num-
plus height and slope. We included information on                  ber of malaria cases as a 4-way layout without repli-
local climes including isohyets, i.e. lines drawn                  cation. The transformation of the response was done
through geographical points recording equal amounts                in order to induce a more symmetric distribution of
of precipitation during a specific period. GIS was also            the transformed variable than the original one and to
used to draw a response surface, whose line density                approximate the basic assumptions required to per-
was proportional to the number of cases per year and               form a valid ANOVA analysis (Figs. 2 and 3). Factors
place. The spatial scale was 1:100,000.                            used to investigate the response variable included
                                                                   “Month” with 12 levels, the “Time Period” with two
Methodology                                                        levels (1986-1989 and 1990-1999), the “ENSO
                                                                   Phenomenon” with seven levels (i.e. weak Niña, mod-
  The full study period was 1986-1999, but we also                 erate Niña, strong Niña, neutral, weak Niño, moder-
generated some epidemiologic scenarios from 1997 to                ate Niño, strong Niño) and the “Parroquia” unit with
1999 using the “Malaria Incidence Spatial Model”                   28 levels.
(MISM), previously developed by Delgado et al.                        Since the spatial factor presented a considerable
(2001, 2007). We used ANOVA (http://www.anova                      effect on the number of malaria cases, we further
.com/) for variance analysis to assess the overall sig-            analysed data using the multiple comparison test
nificance of sets of main effects and interactions and             based on Tukey’s honest significant difference (HSD)
side-by-side box-plots to display all the components of            according to Hoaglin et al. (1991). All comparisons
value-splitting by considering their mean squares. The             between the parroquias were done pair-wise control-
usefulness of this approach to the study of the malar-             ling for the experimental error between the levels of
ia incidence in the Paria Peninsula region was enhaced             the geographical factor. This procedure evaluates the
using a particularly robust and comprehensive version              difference between pairs of averages of the response
of ANOVA (Hoaglin et al., 1991). This approach                     variable assuring extra protection to control the over-

Fig. 2. Box-plots based on the number of malaria cases (left) and on the natural log of the case number + 0.5 (right).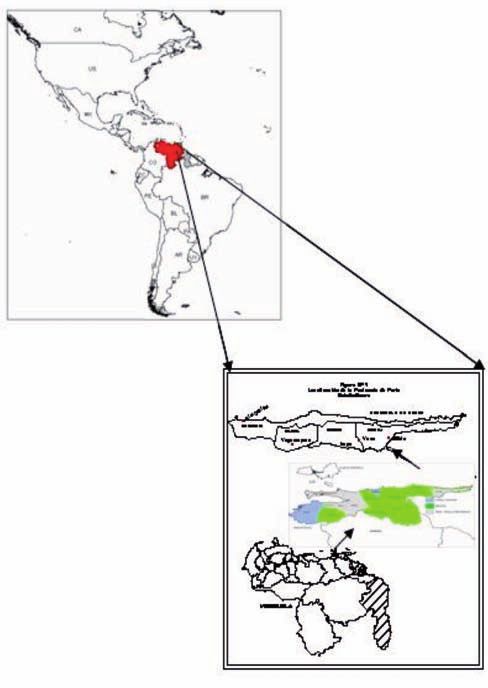
172                        L. Delgado-Petrocelli et al. - Geospatial Health 5(2), 2011, pp. 169-176

Fig. 3. Comparative box-plots of the adjusted factorial effects.

all error rate under the null hypothesis of no difference               Phenomenon” and “Parroquia” ones, and was there-
in the set of effects. The error rate is the probability                fore deemed to be unimportant. Among the double-
that one or more comparisons lead to an incorrect                       factor interactions, “Period” + “ENSO” produced the
conclusion of having found a significant difference.                    largest effects. The largest values, positive or negative,
                                                                        issuing from the ANOVA analysis and the side-by-side
Results                                                                 box-plots (Fig. 3.), came from the “ENSO” and
                                                                        “Parroquia” variables, which also showed the largest
  Table 1 gives the summary of the ANOVA results                        main effects. Thus, there exists a strong statistically
and Figure 3 displays side-by-side box-plots of the fit-                significant association (P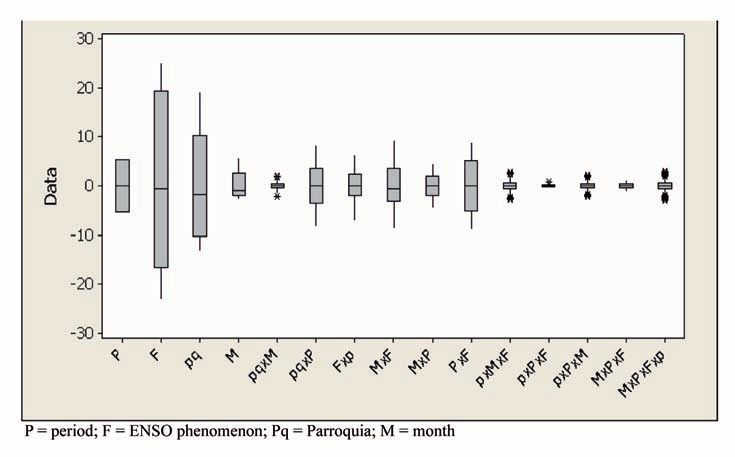
L. Delgado-Petrocelli et al. - Geospatial Health 5(2), 2011, pp. 169-176                 173

Furthermore, we found significant interactions                     of malaria cases starting with set no. 1 (G1), which
between the climatic phenomenon and the temporal                   had the highest average number of cases
dimension, and between the temporal and the spatial                (Yaguaraparo, Irapa, El Paujil and El Pilar) down to
dimensions, but they were much weaker than what                    set no. 10 (G10), which included the Guiria and
was found for the main effects. The goodness of fit of             Antonio José de Sucre parroquias. A zero set, consist-
the model given by the square multiple correlation                 ing of 13 parroquias, had the lowest number of new
coefficient (R2) was 90% and the adjusted R2 for the               malaria cases (Table 2).
number of factors in the model was 74%.                               With regard to slope, the gradient ranges between 0-
  The HSD-Tukey multiple comparison test confirmed                 2% and 2-5% showed the highest number of malaria
the presence of a true, epidemiological corridor that is           cases. Figure 4 shows the malaria intensity during
particularly evident due to the assisted effect of the             1997, when foci appeared near the Campoma Lagoon
road axis between the villages El Pilar and Guiria, sit-           in the Cariaco coastal zone as well as along the Paria
uated within their homonymous parroquias (Table 2).                Peninsula. A relationship was shown between locali-
We were able to define 11 homogeneous groups of                    ties situated in the lowlands (i.e. elevations not sur-
parroquias that did not differ in terms of the response            passing 100 m above the mean sea level). When the
variable. The existence of a series of sets with different         malaria dynamics were analysed and compared
average numbers of malaria cases was verified. The                 sequentially over the years it was possible, as
sets could be ranked according to the average number               described previously (Delgado et al., 2004; Delgado,
                                                                   2005; Delgado and Ramos, 2007), to identify locali-
Table 2. The parroquias grouped according to the main effects      ties that correspond to particular malaria foci (Fig. 4).
gradient obtained by the HSD-Tukey procedure based on the          Interestingly, the same approach also worked when
number of malaria cases (expressed as natural log + 0.5).
                                                                   attempting to correlate malaria to height and slope
                                                                   with 200 m above the mean sea level appearing as the
Number         Parroquia                         GRUPO 0
                                                                   threshold variable in an ecological interpretation for
18             Puerto Santo                         n. s.          the particular distribution of malaria in the region.
21             San Antonio de Irapa                 n. s.             Figure 4 also shows that the northern coastal foci
25             Tunapuicito                          n. s.          have diminished between 1997 and 1999, while those
3              Bideau                               n. s.          in the Paria zone persisted. When GIS overlays were
11             Francisco Antonio Vásquez            n. s.          produced, using contour lines simultaneously with the
6              Cristóbal Colón                      n. s.          MISM (Delgado et al., 2001), clearer areas correspon-
12             Guaraúnos                            n. s.          ding to higher localities appeared, most of them at the
4              Campo Claro                          n. s.          southern part of the state, in contrast to the darker
16             Marabal                              n. s.          areas that correspond to the lowlands particularly in
10             El Rincón                            n. s.          the area of the Paria Peninsula. The risk for malaria
23             Soro                                 n. s.
                                                                   transmission there is reinforced by nearby wetlands
7              El Morro de Puerto Santo             n. s.
                                                                   constitute ideal vector habitats promoting reproduc-
9              El Pilar                             n. s.
                                                                   tion and maintenance of stable mosquito populations.
n. s., not significant

Fig. 4. The “Malaria Incidence Spatial Model” (MISM) for 1997 and 1999.
174                       L. Delgado-Petrocelli et al. - Geospatial Health 5(2), 2011, pp. 169-176

  The sequential map series (Fig. 5), generated by the             Discussion
spatial models, reveals an epidemiological corridor
with permanently active foci. The existence of this epi-             The MISM explains the malaria incidence and
demiologic corridor along this alignment is supported              underlines the relevance of the spatially differential
by the malaria records from the eleven sets of parro-              pattern of new cases of the disease, at least during the
quias as seen in Table 2 and Figure 6.                             years 1997 and 1999. The application of this tech-

Fig. 5. An epidemiological corridor in Paria Peninsula, Estado Sucre, Venezuela.

Fig. 6. Average number of malaria cases per Parroquia investigated.
L. Delgado-Petrocelli et al. - Geospatial Health 5(2), 2011, pp. 169-176                175

nique confirms the association of malaria incidence           rest of the corridor. It is evident from the spatial
with foci located in lowlands with low-degree slopes          analysis that this set (G1) has a key location in the
as reported previously (Delgado, 2005). However,              region as it unites areas with environmental condi-
the lowlands were also chosen for the construction of         tions characteristic for the lowlands, including low-
the roads connecting the major human settlements in           degree slopes. Proximity to extensive wetlands which
the region. These two facts not only define the major         never completely dry out during the year plays an
axis of population distribution between the localities        important role as it provides ample breeding places
of El Pilar, Yaguaraparo and Irapa, but also under-           for the mosquito vector. This assures successful
line the predisposition of these human settlements to         breeding and maintenance of permanent populations
become active malaria foci. Thus, an epidemiologi-            of Anopheles aquasalis, the main malaria vector of
cal, endemic corridor with permanently active foci is         the zone, thus maintaining mosquito populations the
established by a string of localities permanently con-        year around with low variability. Since the lowland
nected by an active flow of people (Fig. 5).                  ecology is not only favourable for stable human habi-
   The clear statistical association between climate          tation, it also represents a tract of land within the
and spatio-temporal effect, obtained from the                 general landscape pattern that lends itself to diverse
ANOVA analysis, strengthens the validity of our               human outdoor activities. The overall effect is a high
results. There is a strong likelihood for the two levels      association between humans and mosquitoes con-
of the “Period” variable to be significantly different        firming the existence of the epidemiologic corridor as
because of their different lengths. The ecological            an important element of this ecological landscape.
interpretation of results points towards a relative              The combination of spatial and statistical analysis
spatial positioning of localities as responsible for dif-     support the development of an effective approach to
ferences of a distinct expression in terms of the num-        a serious public health problem, and the ecological
ber of malaria cases by locality. It also explains the        interpretation allows the recognition of differences
persistence of transmission over time, although each          in response of each locality in terms of occurring
locality suffered the same effect of climatic events          malaria cases that does not depend on annual cli-
along the annual cycle, i.e. all localities fell within the   matic fluctuations. The differences observed point
same pattern of weather fluctuation. The variable             towards the existence of different rates of infection
responses by locality suggest that the rates of malar-        in the human population in certain areas, explained
ia incidence are due to the geographical location             by the spatial position of habitats in relation to areas
within the landscape pattern structure. Thus, the             with permanent mosquito populations. An intrinsic
characteristics of each locality are different with           ecological relationship has been shown between the
respect to the continuum of physic-environmental              biotic component and the natural environmental
matrixes with variously adapted biotic components             landscape matrix, the responses of the biotic factors
as suggested in the landscape ecosystem context.              determining the seriousness of the malaria situation.
Thus, differences in the number of malaria cases              This relation can be spatially expressed within an
(intensity), as well as persistence of infection in the       area by connectivity factors or spatial proximity fac-
human population, depend of a connectivity deter-             tors, favouring both persistence and intensity of the
mined by the distance between settlements and areas           disease. This configuration may appear in the form
suitable to maintain permanent vector populations.            of a continuous, elongated pattern as in an epidemi-
   The results of the analysis shown in Table 2 con-          ological corridor, but when the area is small and rel-
firm the presence of an epidemiological corridor, a           atively isolated, we talk about it as a hotspot
fact which is further strengthened by the existence of        response. Such configurations may be associated
the road between El Pilar and Guiria, located within          with ecological system features, first as a resilient,
of their homonymous parroquias. The finding of 11             resistant area providing the backdrop for the estab-
homogeneous groups of parroquias without differ-              lishment of an endemic zone. On the other hand,
ences in terms of the response variable within them,          this presents malaria as an ecological subsystem
although clearly so between them, is particularly             nested inside a greater ecosystem with high sustain-
interesting because it shows the existence of sets of         ability. Then, both features may be considered in the
parroquias with stable differences with respect to the        design of surveillance and control policies, consider-
average number of malaria cases. The set with the             ing non-equal measures as strategies for action,
highest average number (Yaguaraparo, Irapa, El                especially with respect to early warning systems for
Paujil and El Pilar) may act as the main focus for the        susceptible areas.
176                        L. Delgado-Petrocelli et al. - Geospatial Health 5(2), 2011, pp. 169-176

Conclusions                                                          Infect Dis 6, 217-227.
                                                                    Delgado L, 2005. La dinámica espacio-temporal del sistema
  The settlement units (parroquias), based on territo-               malaria en el foco nor-oriental de Venezuela. Acta Biol Venez
rial, socio-political divisions, can be ranked according             25, 57-66.
to the average number of malaria cases in a way,                    Delgado L, Ramos S, 2007. The remote sensing perspective to
which is consistent with the existence of a malaria epi-             focus landscape ecology, the anthropogenic action and the
demiological corridor in the Paria Peninsula. The exis-              malaria disease. In: Space Technology for E-health. Space
tence of this endemic corridor, which can be under-                  Technology-based Telehealth project initiatives in Latin
stood as the outcome of particular, ecological charac-               America and the Caribbean. Edited by United Nations
teristics present in the landscape, was confirmed by                 Programme on Space Applications, United Nations, New
statistical analysis. Although effects caused by the                 York, USA.
change of global clime patters, conspicuous arrange-                Delgado L, Ramos S, Camardiel A, 2007. La Malaria y su
ments and functions of local ecosystems determine the                Contexto Espacial. El Caso Particular del Estado Sucre en
expression of malaria in a region.                                   Venezuela. XI Conferencia Iberoamericana de Sistemas de
  The design of surveillance and control measures                    Información Geográfica (XI CONFIBSIG).
should consider factors related to human mobility                   Delgado L, Ramos S, Martínez N, 2004. Antropogénesis y per-
between settlements located in geographical areas of                 sistencia de malaria, estado Sucre-Venezuela. XI Simposio
certain ecological characteristics and the spatial coin-             Latinoamericano en Percepción Remota y Sistemas de
cidence between human settlements and malaria vec-                   Información Espacial (SELPER), Chile.
tor mosquito’s habitats.                                            Delgado L, Ramos S, Rodríguez R, Liberal L, 2001. Modelo
                                                                     espacial de riesgo malárico para el estado Sucre, Venezuela.
Acknowledgements                                                     Rev Ing Fac Ing UCV 16, 15-26.
                                                                    Dongus S, Nyika D, Kannady K, Mtasiwa D, Mshinda H,
  The authors would like to express their gratitude for financial    Gosoniu L, Drescher AW, Fillinger U, Tanner M, Killeen GF,
support in project CDCH 03-31-3981-2005 to Consejo de                Castro MC, 2009. Urban agriculture and Anopheles habitats
Desarrollo Científico y Humanístico (CDCH), project UCV-             in Dar es Salaam, Tanzania. Geospat Health 3, 189-210.
2001001850 to FONACIT, and project Hidroclimático G-                Hoaglin D, Mosteller F, Tukey J, 1991. Exploratory Analysis of
2005000184 to BID-FONACITII. Our thanks to all personnel             Variance, John Wiley and Sons (eds), New York, USA.
from Zone 11, Malariología, Carúpano (Fundasalud-Sucre),            Kitron U, 1998. Landscape ecology and epidemiology of vector-
and from the many sanitary dependencies for their support.           borne diseases: tools for spatial analysis. J Med Entomol 35,
Special thanks to Ing. Luis Díaz and Dr. Darío González.             435-445.
                                                                    Kitron U, 2000. Risk maps: transmission and burden of vector-
References                                                           borne diseases. Parasitol Today 16, 324-325.
                                                                    Li SZ, Wang YX, Yang K, Liu Q, Wang Q, Zhang Y, Wu XH,
Barrera R, Delgado N, Jiménez Villalobos, Romero I, 2000.            Guo JG, Bergquist R, Zhou XN, 2009. Landscape genetics:
 Stratification of a city with hyperendemic dengue hemorrhag-        the correlation of spatial and genetic distances of
 ic fever. Rev Pan Sal Púb 8, 4.                                     Oncomelania hupensis, the snail intermediate host of
Barrera R, Grillet ME, Rangel Y, Berti J, Aché A, 1998. Estudio      Schistosoma japonicum in mainland China. Geospat Health 3,
 eco-epidemiológico de la reintroducción de la malaria en el         221-231.
 nororiente de Venezuela, mediante sistemas de información          Romaña C, Emperaire L, Janssen AM, 2003. Enfoques concep-
 geográfica y sensores remotos. Boletín de la Dirección de           tuales y propuestas metodológicas para el estudio de las inter-
 Malariología y Saniamiento Ambiental 38, 14-30.                     acciones entre el medio ambiente y la salud: aplicación de un
Beck LR, Lobitz BM, Wood BL, 2000. Remote sensing and                programa de investigación sobre la tripanosomiasis america-
 human health: new sensors and new opportunities. Emerg              na. Cad Saú Púb 19, 945-953.
You can also read