PLANET CHAMPIONING THE - Christchurch Airport
←
→
Page content transcription
If your browser does not render page correctly, please read the page content below
CHAMPIONING THE
    Greatest P lace
    ON THE
             PLANET

SUSTAINABILITY REPORT
FY17
                            CEO STATEMENT   1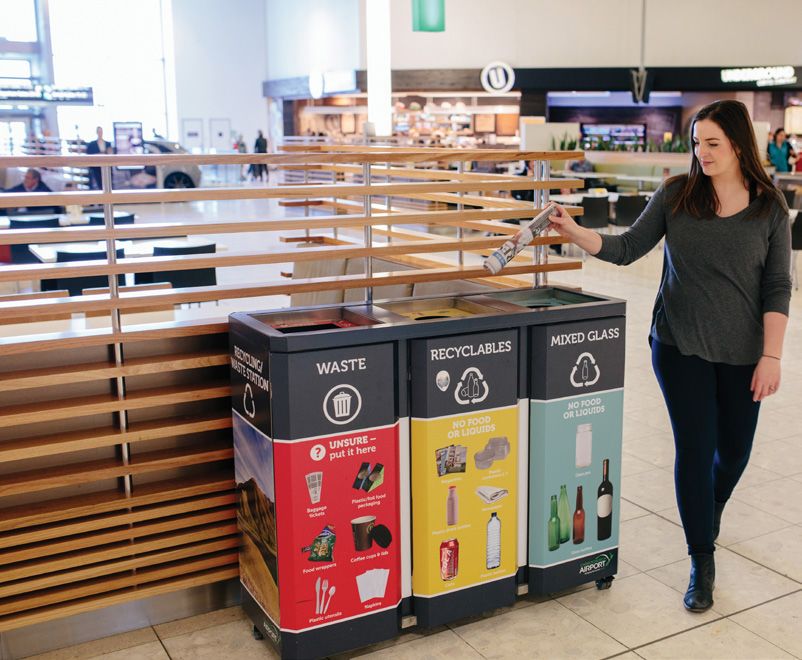
SUSTAINABILITY REPORT FY17

                                                                                                                         TABLE
                                                                                                                         OF CONTENTS
                                                                                                                         1. CHIEF EXECUTIVE STATEMENT			           4
                                                                                                                         2. FY17 SUSTAINABILITY HIGHLIGHTS 			     5
                                                                                                                         3. EXECUTIVE SUMMARY			                   6
                                                                                                                         4. GUIDING PHILOSOPHY			                  8
                                                                                                                         5. OUR COMMITMENT			                      9
                                                                                                                         6. OUR ACHIEVEMENTS			                    11
    As the official gateway to the South Island and a major contributor to its economy,
                                                                                                                           6.1 WATER
    Christchurch Airport has a role as kaitiaki – a guardian of this special place. We work hard to
                                                                                                                           6.2 ENERGY
    protect and, where possible improve, this precious environment
                                                                                                                           6.3 WASTE
    for future generations.
                                                                                                                           6.4 LAND
    This Sustainability Report FY17 contains an overview of the work we have done                                          6.5 NOISE
    in this area during the period from 1 July 2016 to 30 June 2017.
                                                                                                                         7. HOW WE MEASURE AGAINST OTHERS		        38
    It is work we undertake with pride, knowing our success makes a difference
    to this very special part of the world.                                                                              8. SUPPORTING THE GLOBAL EFFORT			        40

    © Christchurch International Airport Ltd 2017
    All rights reserved

    No part of this document may be copied, photocopied or reproduced in any form
    or by any means without permission in writing from Christchurch International Airport Ltd.

    Photographic contributions by: Waynne Williams, Kelly Shakespeare, Julian Apse, Miles Holden and Charlotte Sowman.

2   CHRISTCHURCH AIRPORT SUSTAINABILITY REPORT FY17                                                                                                       CEO STATEMENT   3
FY17
                                                                                                                               SUSTAINABILITY
                                                                                                                               HIGHLIGHTS

    CHIEF EXECUTIVE                                                                                                                  6%                           10.38
                                                                                                                                                                  LITRES OF WATER USED
                                                                                                                                                                                                       55% 44.3%
                                                                                                                                                                                                      OF WASTE RECYCLED                    OF WASTE RECYCLED
                                                                                                                                  DROP IN OVERALL                                                                                            – UP FROM 41%
                                                                                                                                                                     PER PASSENGER                       IN JUNE 2017
                                                                                                                                    ENERGY USE*

    STATEMENT
                                                                                                                                                                                                          – A RECORD                             IN FY16

    Kia Ora Tatou!                                                                                                                            A NEW METERING SYSTEM LETS US MEASURE THE TERMINAL’S WATER USE IN REAL TIME

    It is an absolute pleasure to be able to pen the foreword to Christchurch International Airport Limited’s (CIAL) annual
    Sustainability Report for FY17 (financial year 2017).

    This report reflects a number of things. Firstly, that the people at Christchurch Airport are committed to continuously

                                                                                                                                    8%                                                                                                        1.7
                                                                                                                                                                      APPROXIMATELY

                                                                                                                                                                                                     5.9%
    working to improve sustainable practices at the airport and around our campus. Our overarching philosophy has three
    core elements to Build a Stronger Business & Enhance Customer Journeys & Be Great Kaitiaki (safety, society and
    sustainability). Our Board wants us to be ambitious in our pursuit of all three!
                                                                                                                                DROP IN THE AMOUNT
                                                                                                                                                                          15                                                                NOISE COMPLAINTS
    Secondly, our people are up for making an enduring impact on our business, growing its outcomes in this area and helping                                           HECTARES OF                      DROP IN CARBON
                                                                                                                                 OF WASTE SENT TO                     CONTAMINATED                                                         PER 10,000 AIRCRAFT
    support the more than 250 companies who call Christchurch Airport home to be more sustainable going forward.                                                                                          EMISSIONS*
                                                                                                                                     LANDFILL*                       LAND REMEDIATED                                                          MOVEMENTS**

    Thirdly, and most importantly, our people have grown the confidence to open themselves and our organisation up
    to external challenge (our critical friends) and multi-stakeholder input. This embraces scalable learning to ensure we
    continually reach further each year, lift our ambition and increase our efforts as we continue our journey. We have a
    broad group of interested parties when it comes to sustainability and we recognise there will always be many points of
    view on our activity and achievements, but our people have thrown themselves into this with passion, commitment and
    relentless drive, to make the next step bigger than the last one.                                                                                                      ONLY 1 REPEAT NOISE COMPLAINANT

    These are awesome people doing some really cool stuff and they have my full support!

    Thanks for reading about what they’ve been up to. I’m incredibly proud of them all.

    Regards
    Malcolm Johns                                                                                                              *Compared to FY16
    Chief Executive                                                                                                            ** This is well below the 10 complaints per 10,000 aircraft movements set by the Sustainability Strategy.

4   CHRISTCHURCH AIRPORT SUSTAINABILITY REPORT FY17                                                                                                                                                                      FY17 SUSTAINABILITY HIGHLIGHTS          5
EXECUTIVE
                                                                                                                              CARBON
                                                                                                                              We have continued and will continue to cut carbon emissions from Christchurch Airport activities and we are working
                                                                                                                              with our airline partners to reduce theirs.

    SUMMARY
                                                                                                                              We reduced the carbon emissions from its terminal and campus by 5.2% on FY16 levels in FY17. Our KPI for the year
                                                                                                                              sought a 3% reduction.

                                                                                                                              We will continue measuring and reporting our carbon levels under our energy strategy so that we can help
                                                                                                                              New Zealand to reach its obligations to cut greenhouse gas emissions under the targets set by the Paris Agreement.

                                                                                                                              Note: Around 85% of the electricity Christchurch Airport currently uses is renewable.

    Achievements have been made for every pillar (water, energy, waste, land and noise) of our Sustainability Strategy.

    Despite setting new records in recycling and being named a leader in waste minimisation for the Asia Pacific region,
    we fell just short of our waste KPI. This reflects how ambitious our targets are.
                                                                                                                                                 WASTE

                                                                                                                              While we just missed our KPI to reach a 52.5% diversion from landfill rate across the whole year, we are confident

                        WATER                                                                                                 that we are on track to meet it in FY18 and that FY17 has been a successful year for our efforts in this area.

    		                                                                                                                        We established two new records during FY17, recycling an unprecedented 55.1% of all of our waste in June 2017
                                                                                                                              and, in March 2017, recycling 45.4 tonnes of waste – our largest volume ever.
    The main KPI was to establish a benchmark for the water we use in the airport terminal. That has been achieved
    and initial data indicates the usage levels are approximately 10-11 litres per passenger.                                 We were also benchmarked as the regional leader of businesses in South East Asia and Australasia for waste diversion
                                                                                                                              from landfill as part of our EarthCheck certification (see Chapter 7).
    Our goal is to have reduced that by 10% by FY20 while continuing to do all we can to protect Canterbury’s pure
    aquifer supply.

                                                                                                                                                 LAND

                        ENERGY (AND CARBON)                                                                                   The key achievement for this pillar has been the remediation of 14.75 hectares of land that was zoned as contaminated.
    		                                                                                                                        This is land that was contaminated prior to Christchurch Airport ownership. It is enormously gratifying to be able to
                                                                                                                              improve its condition for future generations.
    The results for this pillar are the strongest we have achieved.
                                                                                                                              We have also been successful in having rules included in the Christchurch City Plan that limit activities that may increase
    The Sustainability Strategy established three KPIs for energy use at Christchurch Airport. These were:                    the risk of birdstrike from happening near the Airport. Mitigating that risk is crucial to keeping people safe as they fly
      • Achieving 10% energy efficiency (on the FY15 baseline) by January 2018                                                in and out of the city.
      • FY17 reducing total energy use for the terminal to 24 kWh/m2 per month
      • FY20 reducing total energy use for the terminal to 23.5 kWh/m2 per month
      • FY25 reducing total energy use for the terminal to 22.5 kWh/m2 per month

    We surpassed all of these – 8 years ahead of schedule, surprising even ourselves!
                                                                                                                                                 NOISE

    Monthly terminal energy use is now 19.33 kWh/m2.

    This has been attributed to our Continuous Commissioning Programme, which is saving us 3,640,000 kWh of electricity       As well as establishing our Airport Noise Liaison Committee, we have continued to measure, manage and mitigate noise
    and 1,360,000 kWh of thermal fuels every year.                                                                            levels at the airport.

    The focus for FY18 will be on pushing hard to reduce our vehicle fuel use, continuing our migration to renewable energy   Noise complaints for FY17 were significantly down on FY16, totalling 12 for the reporting period. This equates to 1.7
    sources and ensuring the terminal stays at (or below) its current monthly use.                                            complaints per 10,000 aircraft movements and is well under the KPI set for the period (of 10 complaints per 10,000
                                                                                                                              movements).

                                                                                                                              Our focus will be on continuing to ensure we respond and investigate every noise complaint received and keeping
                                                                                                                              the rate of such complaints at low levels.

6   CHRISTCHURCH AIRPORT SUSTAINABILITY REPORT FY17                                                                                                                                                                             EXECUTIVE SUMMARY           7
GUIDING                                                                                                                       OUR
    PHILOSOPHY                                                                                                                    COMMITMENT
    We are a land and transport infrastructure business set on 1,000 hectares of airport campus, hosting a wide range
                                                                                                                                  As a business, we want to help our city, our country and the world reach their sustainability goals. So, we take care
    of businesses that together employ around 6,000 people.
                                                                                                                                  to align our actions with national and global priorities.

    Our approach to sustainability is centred in the Maori concept of kaitiakitanga (responsibility, care and guardianship).
                                                                                                                                  Our thinking is influenced by the targets set by the United Nations’ Sustainable Development Goals. We cannot
    We continually challenge ourselves to seek out, develop and implement new processes that make our business
                                                                                                                                  contribute to all of them but Chapter 8 provides a summary of our early efforts to meet these targets.
    more sustainable.
                                                                                                                                  Christchurch International Airport Limited launched its Sustainability Strategy in March 2016. The Strategy
    As a business, we understand that if an initiative is ‘green’ but puts us in the ‘red’ it is unlikely to become a permanent
                                                                                                                                  is centred around the Maori concept of kaitiakitanga – responsibility, care and guardianship.
    part of our business and therefore is not truly sustainable.
                                                                                                                                  We understand we have a duty to take responsible and prudent steps to protect the environment for future
    That means the investments and changes we make become enduring features of our business and the airport campus.
                                                                                                                                  generations. That means we do all we can to minimise our use of natural resources and the impact our business
                                                                                                                                  has on the environment, whilst recognising the limitations that currently exist in the aviation industry.

                                                                                                                                  We strive to go beyond what is required by law and regulation, to enhance our part of the world … not because
                                                                                                                                  we have to, but because we want to. And because a “do minimum” approach would see us missing opportunities that:
                                                                                                                                   • are good for our people
                                                                                                                                   • are good for the environment
                                                                                                                                   • help us build better relationships with key stakeholders
                                                                                                                                   • inspire others to become more sustainable.

                                                                                                                                  Our Sustainability Strategy identifies five key areas we focus our sustainability efforts on; water, energy, waste, land
                                                                                                                                  and noise. Clear goals have been established for each area.

       Christchurch Airport is now conducting on-road trials of New Zealand's
       first 100% autonomous electric Smart Shuttle.

8   CHRISTCHURCH AIRPORT SUSTAINABILITY REPORT FY17                                                                                                                                                                                      OUR COMMITMENT      9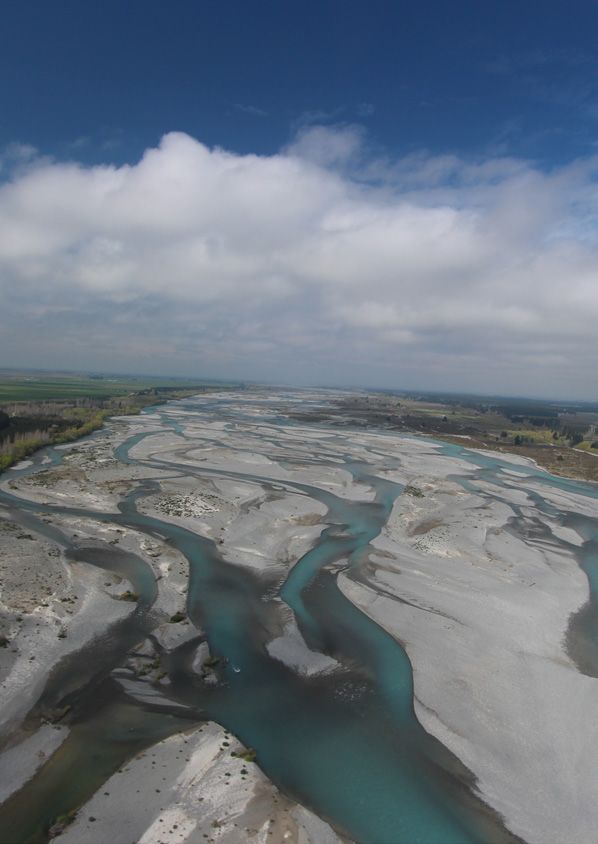
We have established an Internal Sustainability Working Group made up of Christchurch Airport team members in each
     focus area. These are people who are either responsible for our record in this area or who have a passion for it.        OUR ACHIEVEMENTS

                                                                                                                              WATER
     To push us even further, we have established an external panel of experts that reviews the efforts of our
     Internal Working Groups. The panel consists of:

       Lisa Daniell - Head of Sustainability, Air New Zealand
       Jodi Litzenberger - Sustainability Advisor, Virgin Australia
       Matt Morris - Sustainability Advocate, University of Canterbury
                                                                                                                              Reduce per pax water consumption
       Jonathan Pooch - Managing Director, DETA consulting
       Sam Chapman - Operations Manager, HMS Host

     This panel offers advice and, most importantly, challenges our thinking to help ensure we are doing all we can
     to become even more sustainable.

     We focus on enduring sustainability. That means the actions we take or investments we make to improve our
     sustainability must have long-term and measurable benefits. This approach ensures our work in this area has a positive
     impact on the overall financial performance of our business and is truly sustainable.

10   CHRISTCHURCH AIRPORT SUSTAINABILITY REPORT FY17                                                                                                             OUR ACHIEVEMENTS   11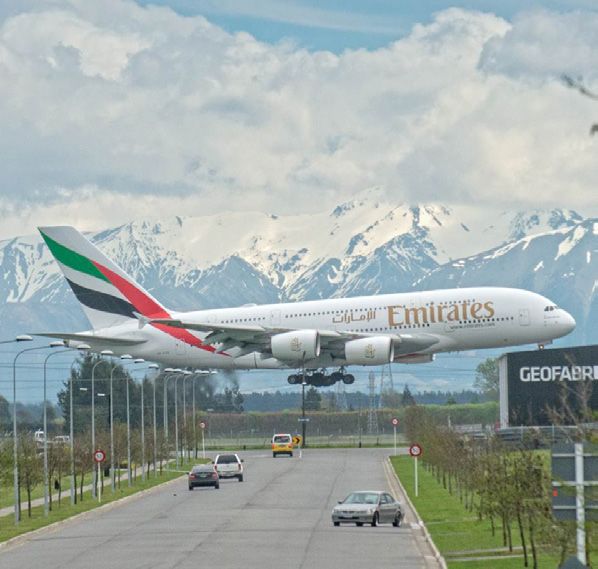
Canterbury enjoys some of the purest drinking water in the world, a precious resource that Cantabrians are
     understandably proud of. We share this passion.                                                                                   FUTURE KEY PERFORMANCE INDICATORS (KPIs)
     Christchurch Airport sits atop an unconfined aquifer that enables us to supply our terminal with 100% pure, naturally-
     filtered water that does not require any treatment for drinking. Few places in New Zealand, or indeed the world, have
     this luxury.

                                                                                                                                                           FY20                  FY25
     We are passionate about maintaining the supply’s integrity by reducing our water use and doing what we can to protect
     the aquifers that supply Christchurch and Canterbury.

                                                                                                                                                        have achieved a        have achieved a
                                                                                                                                                      10% reduction on our   20% reduction on our
     ACHIEVEMENTS FOR FY17                                                                                                                              FY17 benchmark.        FY17 benchmark.
     Our most important focus for the water pillar of our Sustainability Strategy FY17 was establishing a benchmark for water
     usage at the Christchurch Airport terminal.

     Previously we could measure the volume of water being used by the entire airport campus, and while that data was
     useful in assessing overall use, we had no way of accurately measuring the terminal’s use.

     Canterbury enjoys some of the purest drinking water in the world, a precious resource that Cantabrians are
     understandably proud of. We share this passion.

     We are passionate about maintaining the supply’s integrity by reducing our water use and doing what we can to protect
     the aquifers that supply Christchurch and Canterbury.

                          Meter B9*          Meter G4*          Meter ITB*            Total                              Litres Per/
                                                                                                         Litres
                            (m3)               (m3)               (m3)                (m3)                                   PAX

         Jun-17              1,580               2,187             1,270             5,037.5          5,037,500             10.38

     * B9 measures use in the Regional Terminal, G4 measures use in the Integrated Terminal Building and ITB measures use in the
     International Terminal.

     HOW DO WE COMPARE WITH OTHERS?
     These results were discussed with the Airport Council International and an infrastructure engineering consultant in order
     to compare our operation against other airports. These discussions suggest our facility is a leader in the Asia Pacific
     region in efficient water consumption.

     AREAS OF FOCUS FOR FY18
        • To continue monitoring results against passenger numbers and times of day to identify trends to be used
          for future infrastructure planning.
        • Seek to calibrate additional tenant and toilet block meters to further define where in the terminal water
          is used and what efficiencies can be achieved.
        • Identify opportunities for further water reductions.
        • Build water conservation into long term infrastructure planning.

                                                                                                                                        Lake Tekapo, Mackenzie Country.

12   CHRISTCHURCH AIRPORT SUSTAINABILITY REPORT FY17                                                                                                                                           OUR ACHIEVEMENTS   13
NEW TECHNOLOGY MEASURING                                                                                                  OUR ACHIEVEMENTS
     WATER USE                                                                                                                 ENERGY
     IN REAL TIME                                                                                                              Increase energy efficiency
                                                                                                                               Continue migration to renewables

     Christchurch Airport is an outcome-focused organisation. We care about results.

     A core part of our Sustainability Strategy sees us measure our use of natural resources. Doing so means our Internal
     Working Groups and external experts can work together to ensure we are continually challenging ourselves to do even
     better, to be more innovative and create change that will make a lasting difference to our environment.

     When it came to water, we needed to upgrade our infrastructure to ensure we could accurately measure how much
     water the terminal was using instead of how much water was being used on the entire airport campus.

     This was a priority for FY17 and we are delighted to say that we have achieved this.

     We now have all of the terminal’s three water supplies metered and accurately measuring how much water different
     parts of the terminal are using at any time.

     The first month of data was collected in June 2017. It showed that, over that month, we used an average of 10.38 litres
     per passenger. The new domestic jet and regional turboprop areas of the terminal were the most water-efficient, using
     an average of around 10 litres per passenger, while the older International area used around 11 litres per passenger.

     We were delighted at how water-efficient the terminal is overall – particularly the international area, which has much
     older infrastructure than other parts of the terminal.

     Our focus now is to now monitor the data to establish trends throughout the terminal and identify opportunities
     for water savings. Already we can see that upgrading some of the infrastructure in the international terminal will
     create efficiency.

     What is great is that we’ve equipped ourselves with the right tools to do the job – now we have to use the meters
     to their full potential – it’s an opportunity we’re excited about.

14   CHRISTCHURCH AIRPORT SUSTAINABILITY REPORT FY17                                                                                                              OUR
                                                                                                                                                                    CEO STATEMENT
                                                                                                                                                                      ACHIEVEMENTS   15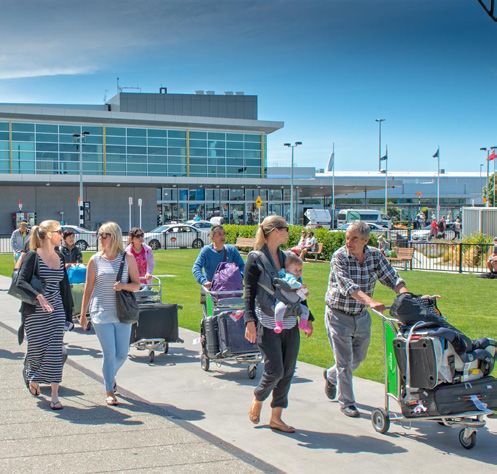
New Zealand’s Energy Efficiency Conservation Authority (EECA) describes Christchurch Airport as a leader when We entered into a Continuous Commissioning Programme (CCP) with EECA in 2016. The CCP is designed to improve
it comes to energy efficiency. on the energy savings already achieved. It involves continuously reviewing data from the building management system
(BMS) and identifying and implementing further Energy Management Opportunities (EMOs). In other words, we have a
Since our new terminal building opened in 2013, we have cut our monthly energy use by more than 20%. In FY16, created a smart terminal that drives energy efficiency.
we managed to reduce the terminal’s electricity use by 6% – despite having record growth in passenger numbers.
The EMOs we identified in FY17 include:
Our focus is on not just saving energy but on using cleaner sources. We are focused on phasing out the use of fossil • Tuning Air Handling Unit Fan speed settings to optimise efficiency.
fuels on our campus and are working with airlines to cut their use of fuel to power aircraft while they are on the ground This reduces the amount of fresh air that the artesian heating system introduces into the building. The terminal has
in Christchurch. a number of air quality sensors that measure, among other things, the level of carbon dioxide in the air. Monitoring
these levels and introducing fresh air only when it is needed, reduces the amount of energy the system uses
Our work is making a difference. Christchurch Airport’s carbon emissions* fell by 5.9% in FY17, largely due to our work (because fresh air requires heating or cooling, depending on outside temperature) while ensuring air quality
around the Energy pillar of our Sustainability Strategy. In other words, energy decisions impact emissions. is not compromised. Our terminal is a digital eco-system in this respect.
How have we done this? Our award-winning ground source heat pump system, which uses natural aquifer water to heat
and cool our terminal, has played a key part. It means we don’t need traditional energy-hungry air conditioning systems. • Water Pressure Trials
Additional gains have been made from our efforts to consistently analyse the terminal building’s performance and to We have decreased the speed at which the artesian water travels around our system, which ensures we can draw
identify opportunities for improvement. more energy from it and also decrease the amount of water the system requires. This was one of the ideas our
Internal Working Groups raised.
Our success in this area makes us proud and inspires our team to do even better.
• Chiller operation adjustments
*These calculations are based on the terminal and will be certified in FY18. This sees us more regularly and carefully using air from outside to cool the terminal. It’s an energy and cost-free
cooling solution.
ACHIEVEMENTS IN FY17 VEHICLE FLEET
Reducing the amount of non-renewable fuel we use in our vehicle fleet is another key opportunity.
ENERGY
We record every litre of fuel used and while FY16 saw a reduction in the total volume consumed, it increased
Overall, FY17 saw Christchurch Airport decrease total energy use (Electricity, Diesel and LPG) by 6%, or the equivalent
by 6% in FY17. The volume of unleaded petrol our vehicles used fell by 5% in FY17, but the amount of diesel used
of 950,000 kilowatt hours (kWh).
increased by 9.9% or 8,000 litres.
This is explained through the procurement of additional diesel vehicles which slightly increased the size of our fleet,
including a new diesel engine in our fire fleet. It is also evidence of the fact we undertook significant development
ENERGY CONSUMPTION PER UNIT AREA and remediation work on sites around our campus which increased demand on our diesel vehicle fleet.
23
22 VEHICLE FUEL USE
140,000
21
kWh/m2
120,000 VEHICLE UNLEADED
20 CONSUMPTION (L)
100,000
19
VEHICLE PREMIUM UNLEADED
80,000 CONSUMPTION (L)
18
60,000
17 AFS FIRE TRUCK DIESEL
CONSUMPTION (L)
FY15 FY16 FY17
40,000
VEHICLE DIESEL
20,000
CONSUMPTION (L)
0
FY15 FY16 FY17
16 CHRISTCHURCH AIRPORT SUSTAINABILITY REPORT FY17 OUR ACHIEVEMENTS 17
We are now working on a Vehicle Optimisation Strategy. This will review the vehicle requirements of each of our          ELECTRIC DAY PASS
     business units, including what type of vehicles each unit needs and what these are used for.
                                                                                                                              We have partnered with Europcar and Volkswagen on a popular new initiative to increase the awareness and use
     At the same time, we are trialling a 100% electric fully autonomous (driverless) smart shuttle that we expect will one   of electric vehicles (EVs) in New Zealand.
     day service the campus.
                                                                                                                              The Electric Day Pass allows business travellers flying into Auckland, Wellington or Christchurch the opportunity to book
     We have committed ourselves to migrating our airport fleet to electric or electric/hybrid where we are able to so.       a Volkswagen e-Golf to use, free of charge, on week days.
     We should have made changes to 30% of our fleet by 2020.
                                                                                                                              The keys are collected from the Europcar desk and the cars are stored at prime parking spots at the cities’ airports.

                                                                                                                              This initiative has not only raised the profile of EVs in New Zealand, but has allowed our staff to keep our footprint small
                                                                                                                              even while we visit other cities.

                                                                                                                              COMMUNITY SHARED FLEET
                                                                                                                              We have been working with the Christchurch City Council and vehicle management company Yoogo on a new scheme
                                                                                                                              that provides electric vehicles for community use. It will see a fleet of EVs based at the airport from November 2017.

                                                                                                                              KEY FOCUS AREAS FOR FY18
                                                                                                                                • Continue the implementation of the Continuous Commissioning Programme.
                                                                                                                                • Complete feasibility study for additional aircraft ground power units.
                                                                                                                                • Upgrades of street lighting to energy-efficient LEDs.
                                                                                                                                • Improve data capture of non-terminal operations’ energy use.
                                                                                                                                • Introduce electric vehicles into our fleet.
                                                                                                                                • Encourage the public to use shared EVs through on-site schemes.
                                                                                                                                • Complete Vehicle Optimisation Strategy.

                                                                                                                                KEY PERFORMANCE INDICATORS (KPIs)

                                                                                                                                                                                     FY20
                                                                                                                                         FY18                                      To have terminal
                                                                                                                                                                                energy use at or below
                                                                                                                                                                                                                                  FY25
                                                                                                                                                                                                                              Cease using the
                                                                                                                                      Introduce electric                         23.5 kWh/m2 and to                        fossil-fuel fired boilers
                                                                                                                                        vehicles to the                            have 30% of our                            to help heat the
                                                                                                                                          our fleet.                              fleet as electric or                          International
                                                                                                                                                                                    electric-hybrid                                Terminal.
                                                                                                                                                                                       vehicles.

18   CHRISTCHURCH AIRPORT SUSTAINABILITY REPORT FY17                                                                                                                                                                               OUR ACHIEVEMENTS          19
KIWI INGENUITY CARBON
Carbon is not a pillar of our Sustainability Strategy. It is a by-product of our energy and waste operations. However
we measure and report our carbon emissions to ensure they are continually decreasing.
AT WORK It is important to us that Christchurch Airport meets New Zealand’s commitment, under the Paris Agreement, to reduce
greenhouse gas emissions by 30% below 2005 levels by 2030.
Our target to reduce our emissions to 20% below 2016 levels by 2025 will see us achieve this.
We measure both Scope 1 and Scope 2 emissions. Scope 1 are those we emit directly from our site, for example, fuel
use. Scope 2 are those emitted through the generation of the electricity we purchase (noting that approximately 85%
Christchurch Airport was the first business in New Zealand to install a unique ground source heat system that borrows
of New Zealand’s electricity is renewable).
artesian water from the aquifers below the terminal to heat and cool the building. It returns all the water taken to the
aquifer unharmed and uncontaminated.
We have made some impressive gains. Since FY12 our carbon emissions have reduced by nearly 32%.
The system, designed by BECA engineers, has helped the Airport cut its energy use by more than 20% since the new
terminal opened in 2013. It’s now being rolled out in other major developments across the city.
Using artesian water like this is cost-effective, energy efficient and easy on the environment. All of the water the system ACHIEVEMENTS IN FY17
uses is returned to the aquifer untouched.
Ensuring it works as efficiently as possible has been the job of Manager Terminal Facilities, Mike Parker, who has worked
TOTAL EMISSIONS
alongside experts from the Energy Efficiency Conservation Authority to consistently improve how the system operates During FY17, we reduced the emissions from our terminal and campus by 5.2% on FY16 levels. Our KPI for the year
since it was installed. sought a 3% reduction so we are delighted to have exceeded that.
In its first year (FY13) the new terminal building used 16,992,136 kWh of electricity. Tweaking how the system operated In total, our scope 1 and 2 emissions for FY17 were 3,314.3 tCO2-e, compared with 3,494.4 tCO2-e for FY16.
cut our electricity use by 3.5% in FY14. Further changes saved another 10% in FY15 and additional changes have saved
another 9% since then.
This is an example of how measuring our performance and challenging the status quo has led to continuous
improvements in Christchurch Airport’s sustainability.
CARBON EMISSIONS
3800
3700
3600
tCO2-e
3500
3400
3300
3200
FY15 FY16 FY17
Terminal Facilities Manager Mike Parker in the Plantroom
20 CHRISTCHURCH AIRPORT SUSTAINABILITY REPORT FY17 OUR ACHIEVEMENTS 21SCOPE 1 VERSUS SCOPE 2 EMISSIONS VEHICLE EMISSIONS
We are pleased to report that both our Scope 1 and Scope 2 emissions are, on the whole, decreasing. Carbon emissions from our vehicle fleet increased by 6.4% on FY16, as illustrated below. This is predominantly from
an increase in the use of diesel vehicles in the Airport Fire Service and Propel vehicle fleets.
The figure below shows that our emissions peak in the winter quarter and, given Christchurch had its coldest July
in nearly a decade, our emissions for the final quarter of FY17 were higher than the same period 12 months ago. The Vehicle Optimisation Strategy that is currently underway and will identify opportunities to introduce electric vehicles
This reflects the increased heating requirements. to the fleet at a faster rate, reducing these emissions.
SCOPE 1 VS SCOPE 2 EMISSIONS VEHICLE RELATED EMISSIONS
650
600 FY15 SCOPE 1 320
550
FY15 SCOPE 2 310
500
300
450 FY16 SCOPE 1
tCO2-e
tCO2-e
400 290
FY16 SCOPE 2
350 280
FY17 SCOPE 1
300
270
250 FY17 SCOPE 2
260
200
Q1 FY15 FY16 FY17
Q2 Q3 Q4
TERMINAL EMISSIONS KEY OBJECTIVES FOR FY18
The terminal achieved a 5.9% reduction in emissions for FY17, compared with FY16. This exceeded the 3% target
set by the company in the Sustainability Strategy. • Undertake a formal carbon audit to verify this data.
• Obtain industry recognition through the Airport Council International – Airport Carbon Accreditation Scheme.
Overall the terminal accounts for around 91% of Christchurch Airport's total emissions and continues to offer our largest
opportunities for emission reductions.
The graph below illustrates the reduction in carbon emissions over the previous three financial years – these
can be directly attributed to the energy saving programmes implemented in the terminal.
FUTURE KEY PERFORMANCE INDICATORS (KPIs)
TERMINAL CARBON EMISSIONS
3800
3500
3000
2500
FY20 FY25
tCO2-e
200
10% reduction on 20% reduction on
1500 FY16 emission level. FY16 emission level.
1000
500
0
FY15 FY16 FY17
TOTAL EMISSIONS SCOPE 1 EMISSIONS SCOPE 2 EMISSIONS
22 CHRISTCHURCH AIRPORT SUSTAINABILITY REPORT FY17 OUR ACHIEVEMENTS 23PLUGGING OUR ACHIEVEMENTS
IN PLANES WASTE
Reduce amount of waste per pax
Increase % diverted from landfill
FY17 saw us work alongside our airline partners Air New Zealand, Jetstar and Emirates to install new electric
groundpower units (GPUs) on a number of our terminal’s aircraft stands.
As their name suggests, GPUs are units that power aircraft while they are on the ground at the terminal.
Without GPUs, planes have to run their engines or auxiliary power units, burning fuel, to run their systems.
Because these new GPUs use New Zealand’s mostly renewable electricity to power the aircraft, their use
cuts carbon emissions by up to 99%. Burning jet fuel can emit up to 630 kg CO2-e per hour, whereas using
New Zealand network electricity pegs emissions back to 6.7 kg CO2-e per hour. Now each day when the
Emirates A380 flies in, it plugs into a GPU.
This saves around 1,000 kg of fuel and 3,150 kg of carbon emissions on each turnaround.
We are now making good progress in working alongside other airlines to expand the use of GPUs
to all of our stands.
WASTE
24 CHRISTCHURCH AIRPORT SUSTAINABILITY REPORT FY17 OUR ACHIEVEMENTS 25With more than 20,000 people visiting Christchurch Airport's terminal every day, waste is always going
to be an operational by-product our business has to deal with. AIRSIDE AND TERMINAL WASTE DIVERSION %
We’re committed to ensuring we continually work to reduce the amount of waste generated in the terminal 70%
and recycling as much as possible.
60%
Most of the organic waste produced in the terminal is ‘reused’ at a Canterbury pig farm or sent to a local
50%
composting facility.
40%
Other forms of waste are weighed before being either sent to landfill or recycled. That’s important – it means RECYCLING
we can measure how well we are tracking on our waste reduction and diversion targets and keep challenging 30%
ourselves and our terminal tenants to do better. LANDFILL
20%
10%
ACHIEVEMENTS IN 2017 0%
16 16 16 16 6 16 6 16 16 7 17 7 17 17 17
-1 -1 -1 B- -1 R- -
IL- AY
- N- L- P- CT V- C- N AR AY N-
WASTE MINIMISATION AP
R M JU JU AU
G
SE O NO DE JA FE M AP M JU
Overall, we cut the amount of waste sent to landfill by 8% in FY17.
In FY17, we sent 8.85 kilograms of waste to landfill for every 100 passengers. This is down from 9.6 kg/100pax
in FY16 and a huge improvement on the 12.8 kg/100pax we recorded in 2015.
This shows us that the target is achievable and we will keep pushing to lift rates to meet the KPI we have established
for 2020 – a 55% diversion rate.
While reducing waste from all areas is a priority, we see a major opportunity to lift the level of waste being recycled
from the airside area. This will be a key focus for FY18.
14
13
WASTE DIVERSION PERFORMANCE
12
60%
11
kg/100PAX
FY15
10 50%
FY16
9
40%
8 FY17 AIRSIDE
% Diverted
30%
7
TERMINAL
6 20%
OVERALL
Y ER Y RY L AY DIVERSION RATE
UL ST ER B ER ER AR CH RI NE
J GU
EM
B O M
B
M
B
NU RUA AR AP M JU 10%
AU T CT VE CE JA EB M
SEP O NO DE F TARGET
0%
-1
6
-1
6
-1
6 -1
6
-1
6 16 16 17 17 17 17 17 17
L P V- EC- AN- B- R- PR- Y- N-
JU
N
JU AU
G
SE CT O D J F E
M
A A M
A
J U
O
WASTE DIVERSION
N
Overall, FY17 saw 44.3% of the waste from the terminal recycled; this is an increase from 41% in FY16.
This falls short of the 52.5% diversion rate we set as a target for FY17 so we are aware that, while we are improving, Results improved in the last two quarters of the year. This is due to three core actions:
we have a lot of work to do in this area.
We are pleased to report that we did hit this target in June 2017 when, for the first time, we managed to recycle more 2. Providing additional receptacles for the collection of organic (food) waste from kitchens within the terminal.
waste than we sent to landfill.
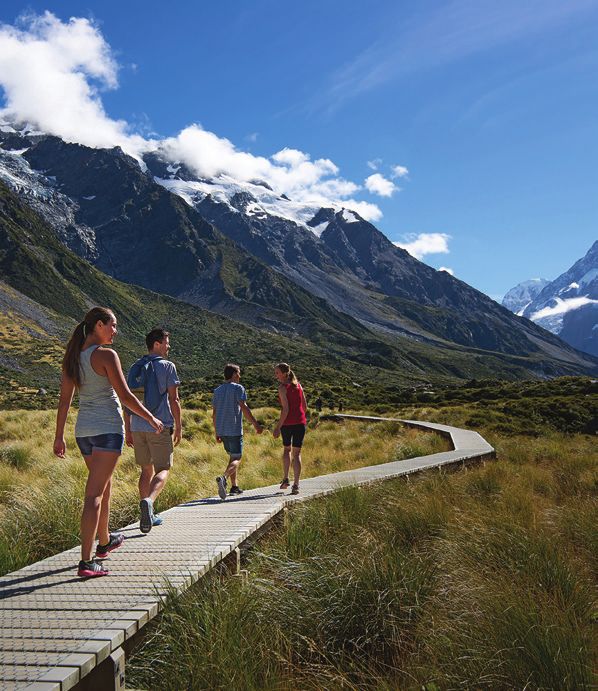
26 CHRISTCHURCH AIRPORT SUSTAINABILITY REPORT FY17 OUR ACHIEVEMENTS 27KEY OBJECTIVES FOR FY18 LIFTING RECYCLING RATES
WITH GIANT
• Review of waste room infrastructure and technology.
• Review of food court waste stations.
• Development of additional training aids for tenants.
COFFEE CUPS
• Continue to monitor and audit airside waste receptacles.
• Work with Air New Zealand to enable additional airside recycling opportunities.
FUTURE KEY PERFORMANCE INDICATORS (KPIs) FY17 saw us launch Project Coffee Cup, a two-pronged response to the use of takeaway coffee cups in the terminal.
Globally use of the cups is creating a huge amount of waste and in Christchurch there is no way for businesses
to recycle or compost these cups.
Project Coffee Cup was launched in May 2017. It had two goals:
1) To stop coffee cups being deposited in the terminal’s recycling bins (doing so can contaminate the rest of the bin,
meaning its contents can’t be recycled).
FY18
52.5% diversion rate.
FY20
55% diversion rate.
FY25
60% diversion rate.
2) Promote the use of reusable cups and, in particular, to encourage our staff to use them.
The project had a low-key launch, with bespoke coffee cups given to every staff member along with simple messages:
‘sustainability starts with you’ and ‘using this cup every day could save 3.6 kg of landfill every year’.
Our dedicated Coffee Cup disposal bins.
28 CHRISTCHURCH AIRPORT SUSTAINABILITY REPORT FY17 OUR ACHIEVEMENTS 29The key aim of this exercise was changing behaviour. We surveyed staff before and after the initiatve launched
to gauge its success. The results showed improvement. OUR ACHIEVEMENTS
TAKEAWAY COFFEE CUP USAGE LAND
BASELINE BEHAVIOUR POST IMPLEMENTATION RESULTS Maintain, improve and remediate
ANSWERED: 71 SKIPPED: 0 ANSWERED: 71 SKIPPED: 0
ALWAYS
7.0% (5)
NEVER
25.4% (18) ALWAYS
SOMETIMES
28.2% (20)
18.3% (13)
NEVER
47.9% (34)
RARELY
11.3% (8)
RARELY
26.8% (19)
SOMETIMES
35.2% (25)
At the same time, we introduced Coffee Cup Bins to the terminal – these are shaped like giant coffee cups and placed
beside the existing bins. The idea was simply to get customers to discard their cups in these instead of using the
recycling or waste bins.
It is working. The number of recycling bins being contaminated by used coffee cups is decreasing and our recycling
rates hit a new high after the Coffee Cup Bins were introduced.
Best of all, we are keeping an eye on technology and working to find a way of recycling or composting the cups.
Once we find it, we’ll already have a system that sorts these from other waste streams.
LA
We are also encouraging the use of reusable coffee cups.
ND
30 CHRISTCHURCH AIRPORT SUSTAINABILITY REPORT FY17 OUR ACHIEVEMENTS 31We are privileged to live in one of the most beautiful places in the world, a place that will one day be in the hands INTEGRATED WILDLIFE MANAGEMENT
of future generations.
Birdstrike is a very real risk at any airport and Christchurch Airport, like others around the world, acts proactively
Christchurch Airport operates on more than 1,000 hectares of land. Our approach to managing it is in line with the to mitigate this in a number of ways:
Maori concept of kaitiakitanga (responsibility, care and guardianship). • We work alongside Environment Canterbury and the Christchurch City Council to monitor large bird populations
in areas near the airport. FY17 saw the controlled removal of Black-back gulls that were not only a birdstrike risk
We have a role to ensure we protect and, where possible, improve the land we leave behind so that the next generation but also threaten a number of rare bird species.
is not left with our mistakes. • FY17 also saw Christchurch Airport successfully advocate for rules to be included in the Christchurch City Plan
to protect the airport from activities that may increase the birdstrike risk.
We have inherited some contamination (including a former landfill) from previous owners and we are doing our best
to remediate this. We also ensure that, when we develop land, we do so sustainably.
We also own some unique places – including a site of ecological significance. We are working with authorities
to preserve the unique plant and animal life there. FUTURE AREAS OF FOCUS
Our focus is also on working with key authorities to ensure that land around the airport is managed in a way that keeps • Continuing to protect significant sites.
our people and communities safe. For an airport, that means we have to limit activities that increase the risk • Creating a site-wide map of contaminated sites and looking at remediation.
of birdstrike. • Continued mitigation of birdstrike risk.
• Continuing to liaise with authorities to ensure planning rules do not compromise communities’
safety or quality of life while allowing the airport to grow.
ACHIEVEMENTS IN 2017
REMEDIATION
During this reporting period, approximately 14.75 hectares of contaminated land was remediated. This included former
landfills and former farmland.
The remediation works were varied in nature. In some cases tonnes of waste were removed and taken to landfill; in
others care was taken to carefully seal sites so that contaminants will not leach in the future.
Not only does this work undo the damage that historic hazardous activities did to the land (prior to Christchurch Airport
ownership), it enables us to turn these sites into commercial property which is now being leased to other businesses.
We also developed the ‘Mustang Park Developers Guide’ – a manual for engineers and project managers that showcases
the solutions we found to the various challenges to construction activity in the former landfill areas of Mustang Park.
CARING FOR A SPECIAL SITE
In late 2015, Christchurch Airport was made aware of a ‘site of ecological significance’ on its land near Pound Road.
The site contains old channels of the Waimakariri River – only 20% of such sites still remain and ours is part of one
of the largest remaining examples in Canterbury.
Around 35 different plant and lichen species are found at the site – five of them are at risk. There are also 15 different
invertebrates – including wolf spiders.
We are working alongside the Christchurch City Council to establish a management plan for the land. So far, this work
has involved fencing off some areas that contain remnant trees and shrubs endemic to this landscape.
Future efforts will involve managing rabbit populations which are degrading this landscape and creating a wildlife hazard
for the airport.
32 CHRISTCHURCH AIRPORT SUSTAINABILITY REPORT FY17 OUR ACHIEVEMENTS 33USING GRASS OUR ACHIEVEMENTS
TO REPEL BIRDS NOISE
Measure, manage and mitigate
One of Christchurch Airport’s best defences against birdstrike has been Avanex, a grass we worked with AgResearch
and PGG Wrightson Seeds to develop 12 years ago.
We were the first airport in the world to use Avanex. It contains a natural fungus (endophyte) that makes birds feel
sick when it is ingested, and which also reduces insect numbers. The result? Birds stop flocking on areas grassed
with Avanex.
FY17 saw us plant another 24 hectares of our airfield in Avanex. We now have around 130 hectares of the grass, which
also reduces our need to use pesticides and lawn mowers.
The natural fungus doesn’t harm birds and has reduced numbers on our airfield dramatically, making it safer for the
record numbers of passengers flying in and out of our terminal.
34 CHRISTCHURCH AIRPORT SUSTAINABILITY REPORT FY17 OUR ACHIEVEMENTS 35Noise is an environmental issue that is of great importance to airports around the world.
A WORLD FIRST
TO BALANCE
With record numbers of passengers now arriving into Christchurch Airport, we have taken great care to lessen
the effects that the increasing number of flights has on those who live and work near the airport.
That’s important to us – we are part of a community and exist to create opportunities for the South Island that improve
SAFETY & SOUND
the lives of those who live, work and visit here.
At the highest level, we work alongside authorities to ensure future developments are carefully planned and that our
laws and bylaws allow the city’s airport to grow prudently without significant negative impacts on those around us.
We respond to every noise complaint and work with the large number of organisations on our campus to ensure that
each one is doing everything they can to mitigate noise.
We also measure the number of complaints and repeat complaints we receive, to ensure they remain at low levels.
We maintain close ties with those who live and work near the airport so they know who to call if they have concerns Engine testing is a critical part of any airport – it keeps passengers safe and aircraft running on time.
and, most importantly, we will act on those concerns to ensure we do all we can to mitigate any ongoing issue.
It can also be a noisy process, but Christchurch Airport has a new tool to ensure noise is kept to acceptable levels
so those who live and work around its campus can do so more peacefully.
ACHIEVEMENTS FOR FY17 The Engine Testing Monitoring Software (ETMS) is a web-based application that was developed by global acoustic
consultancy Marshall Day Acoustics. It is the first tool of its kind in the world.
During FY17 we received a total of 12 noise complaints from 70,297 scheduled aircraft movements. This equates
The ETMS can predict how loud an engine test will be, whether it will comply with regulations and suggest the best time
to 1.7 complaints per 10,000 aircraft movements and is well below the 10 complaints per 10,000 movement KPI
to do it. It also measures how loud the test was and alerts Christchurch Airport officials if any noise is close to breaching
set by the Sustainability Strategy.
regulations.
There was only one repeat complainant for the 70,297 aircraft movements. This is well below the 10 complaints
Any operator wanting to undertake an engine test has to lodge an application to do so in the ETMS. The system then
per 10,000 movement KPI set by the Strategy.
indicates whether or not the test can occur without breaching guidelines. It reviews several factors including the exact
location of the test, wind direction, power levels, aircraft type and what other tests have previously taken place or are
scheduled at the airport that day and in the past seven days.
AIRPORT NOISE LIAISON COMMITTEE
Built into the software is the ability to produce reports. These are uploaded to the Christchurch Airport website every
In March 2017, we established the Airport Noise Liaison Committee (ANLC). day so that anyone can see how noisy the airport is at the click of a button.
The committee meets quarterly and consists of an independent chairperson; two Christchurch Airport representatives; For more information or to review the data, visit christchurchairport.co.nz/noisereporting
two airline representatives; a Christchurch City Council (CCC) environmental health officer; two representatives from
CCC Community Boards and a representative from the Isaac Conservation and Wildlife Trust.
Key responsibilities include advising on the Airport Noise Management Plan and the Acoustic Treatment Programme,
and providing a channel for community concerns regarding noise from aircraft operations and engine testing.
ANLC meeting minutes can be viewed on our website (christchurchairport.co.nz).
KEY AREAS OF FOCUS FOR FY18 AND BEYOND
• Measuring, monitoring and mitigating noise complaints.
• Keeping complaint numbers limited to 10 per 10,000 aircraft movements.
• Keeping the number of repeat complaints limited to 10 per 10,000 aircraft movements.
36 CHRISTCHURCH AIRPORT SUSTAINABILITY REPORT FY17 OUR ACHIEVEMENTS 37HOW WE MEASURE
During the reporting period, Christchurch Airport underwent our first EarthCheck benchmarking audit. The purpose
of this was two-fold.
1. To verify the data submitted by Christchurch Airport against the EarthCheck standard.
2. To benchmark it against data provided by other EarthCheck members in similar industries. For our business, this
AGAINST OTHERS
included airports in Australasia and Asia.
The auditing process showed that Christchurch Airport is one of the most sustainable airports
in the Southern Hemisphere.
Our results:
ENERGY 1,460 1,468.7 2,085
CONSUMPTION
(MJ/square metre) Regional Christchurch Regional
Leader Airport Average
70.7 79.0 113 GREENHOUSE
GAS EMISSIONS
Christchurch Previous Regional (Scope 1 and Scope 2,
Airport Regional Average kgCO2-e/square metre)
Leader
*Our water intake originally sat
at 93.7 L per passenger but that
POTABLE WATER 10.4* 29.4 39.8 reflected water use across the
CONSUMPTION whole campus. Our new metering
technology means we can now
measure water use for the terminal
(L per passenger) Christchurch Regional Regional only which sat at 10.38 L per
Airport Leader Average passenger in June 2017.
"The auditing process showed that
Christchurch Airport is one of the most 0.1 14 2.0 WASTE SENT
TO LANDFILL
sustainable airports in the Southern Hemisphere."
Christchurch Previous Regional (L per passenger)
Airport Regional Average
Leader
38 CHRISTCHURCH AIRPORT SUSTAINABILITY REPORT FY17 HOW WE MEASURE AGAINST OTHERS 39SUPPORTING THE
Christchurch Airport is very proud that much of the work we are undertaking as part of our Sustainability Strategy aligns
with these goals.
GLOBAL EFFORT
In 2015 the United Nations established 17 goals to transform our world.
Known as the Sustainable Development Goals (SDGs), these form part of the 2030 Agenda for Sustainable Development.
Universal and inclusive, the Agenda calls for action by all countries to improve the lives of people everywhere.
Governments, businesses and societies around the world are working towards the targets.
Other parts of our business are working towards other SGDs and we are looking forward to sharing more
of that in our Sustainability Report FY18.
Christchurch Airport supports the Sustainable Development Goals.
40 CHRISTCHURCH AIRPORT SUSTAINABILITY REPORT FY17 OUR ROLE IN THE UN-LED GLOBAL EFFORT 41PO BOX 14001 CHRISTCHURCH AIRPORT CHRISTCHURCH, NEW ZEALAND enquiries@cial.co.nz christchurchairport.co.nz +64 (3) 358 5029 8.30am to 5.00pm
You can also read