High mercury accumulation in deep ocean hadal sediments
←
→
Page content transcription
If your browser does not render page correctly, please read the page content below
www.nature.com/scientificreports
OPEN High mercury accumulation
in deep‑ocean hadal sediments
Hamed Sanei1, Peter M. Outridge1,2,3*, Kazumasa Oguri4,5, Gary A. Stern3, Bo Thamdrup5,
Frank Wenzhöfer5,6,7, Feiyue Wang3 & Ronnie N. Glud5,8,9
Ocean sediments are the largest sink for mercury (Hg) sequestration and hence an important part
of the global Hg cycle1. Yet accepted global average Hg flux data for deep-ocean sediments (> 200
m depth) are not based on measurements on sediments but are inferred from sinking particulates2.
Mercury fluxes have never been reported from the deepest zone, the hadal (> 6 km depth). Here we
report the first measurements of Hg fluxes from two hadal trenches (Atacama and Kermadec) and
adjacent abyssal areas (2–6 km). Mercury concentrations of up to 400 ng g−1 were the highest recorded
in marine sediments remote from anthropogenic or hydrothermal sources. The two trench systems
differed significantly in Hg concentrations and fluxes, but hadal and abyssal areas within each system
did not. The relatively low recent mean flux at Kermadec was 6–15 times higher than the inferred
deep-ocean average1,3, while the median flux across all cores was 22–56 times higher. Thus, some
hadal and abyssal sediments are Hg accumulation hot-spots. The hadal zone comprises only ~ 1% of
the deep-ocean area, yet a preliminary estimate based on sediment Hg and particulate organic carbon
(POC) fluxes suggests total hadal Hg accumulation may be 12–30% of the estimate for the entire deep-
ocean. The few abyssal data show equally high Hg fluxes near trench systems. These results highlight
a need for further research into deep-ocean Hg fluxes to better constrain global Hg models.
The Minamata Convention on Mercury to reduce human emissions of this priority toxic metal was ratified and
entered into force in 2017 (www.mercur yconvention.org)1 1–3. Attention is now turning to how rapidly Hg may
decrease in the b iosphere4,5, ultimately via storage in one of the planetary sinks—soils and ocean sediments6,7.
Oceans are crucial in understanding the global cycling and fate of anthropogenic Hg because they contain
more Hg than the upper organic layers of soils and the atmosphere combined, and marine sediments are prob-
ably the largest long-term r epository1,8. The rate of Hg accumulation on continental shelves (excluding estuar-
ies) is constrained by numerous field studies and m odeling3,9, and is estimated at 120–200 t Hg a −1 1,3. However,
knowledge of Hg accumulation in deep-ocean sediments (91% of ocean a rea10) is limited. There are no measured
Hg flux data from the deepest, hadal areas of the oceans. Consequently, global conceptual models and budgets
used water column particulate Hg:POC data, scaled to global marine OC burial r ates2, to infer deep-ocean Hg
accumulation of 240–600 t a −1 1,3, equivalent to an average flux of 0.7–1.8 µg.m−2 a−1 over an area of 330 × 106
km2 10. Even measurements of Hg concentrations in deep-ocean sediments are sparse compared to coastal
sediments (see Refs.11–17 for Hg concentration data on bathyal and abyssal sites; and Refs.16,18,19 for hadal sites).
The current calculations of deep-ocean Hg accumulation assumed a constant water column Hg:POC of
0.6 µg Hg g P OC−1 2,20. However, measurements at many Pacific Ocean sites indicate that Hg:POC increases
several-fold down to at least 500 m depth because sinking particles preferentially retain Hg relative to carbon
during remineralization21. Also, measurements of the particulate:dissolved Hg partitioning co-efficient in the
pelagic ocean show > 20 × higher values than models assume, possibly because Hg is “regeneratively scavenged”
by decaying particulate organic m atter22 (POM) similar to metals such as z inc23. Thus, Hg may penetrate deeper
into the ocean at higher rates than models suggest. Given these discrepancies, and because deep-ocean sediments
1
Lithospheric Organic Carbon (LOC) Group, Department of Geoscience, Aarhus University, 8000 Aarhus C,
Denmark. 2Geological Survey of Canada, Natural Resources Canada, 601 Booth St, Ottawa, ON K1A 0E8,
Canada. 3Department of Environment and Geography, Center for Earth Observation Science, University of
Manitoba, Winnipeg, MB R3T 2N2, Canada. 4Research Institute for Global Change, Japan Agency for Marine-Earth
Science and Technology (JAMSTEC), 2‑15 Natsushima‑cho, Yokosuka, Kanagawa 237‑0061, Japan. 5Department
of Biology, University of Southern Denmark, HADAL and Nordcee, 5230 Odense M, Denmark. 6HGF‑MPG
Group for Deep Sea Ecology and Technology, Alfred-Wegener-Institute Helmholtz-Center for Polar and Marine
Research, 27570 Bremerhaven, Germany. 7Max Planck Institute for Marine Microbiology, 28359 Bremen,
Germany. 8Department of Ocean and Environmental Science, Tokyo University of Marine Science and Technology,
Tokyo, Japan. 9Danish Institute for Advanced Study (DIAS), University of Southern Denmark, Fioniavej 34,
5230 Odense, Denmark. *email: peter.outridge@canada.ca
Scientific Reports | (2021) 11:10970 | https://doi.org/10.1038/s41598-021-90459-1 1
Vol.:(0123456789)www.nature.com/scientificreports/
may be the largest oceanic Hg sink, there is a critical need to verify the inferred accumulation estimates with
data based on sediment sampling.
Here we report Hg concentration and flux data from 12 sediment cores from two hadal subduction trenches,
and adjacent abyssal plains and slope, in the Pacific Ocean (Atacama Trench, N = 9 sites, off Chile; Kermadec
Trench, N = 3, near New Zealand; Fig. 1 and Table S1). There are 47 subduction trenches, troughs and trench
acific24. Together, the Atacama and Kermadec trench
faults in the world’s hadal zone, concentrated mainly in the P
systems represent 2.2% of the total hadal area of about 3.44 × 10⁶ km2 10,24. Because they are the deepest parts
of the ocean basin, trenches are natural accumulators of the organic and inorganic matter that was deposited
at the ocean’s surface or produced in surface waters25. Atacama underlies one of the most productive oceanic
regions and has the highest estimated POC flux of any trench (3.2 ± 1.4 g OC m −2 a−1), whereas Kermadec has
a moderate POC flux (1.6 ± 0.5 g OC m a ) which is similar to the mean of 1.3 ± 0.8 g OC m−2 a−1 across 21
−2 −1
major subduction trenches > 6.5 km d eep26.
Results and discussion
Sediment dynamics in hadal trenches are governed by two processes: (1) continuous pelagic deposition and (2)
infrequent mass wasting/deposition events that translocate large quantities of sediment from the trench slope to
the trench interior (typically driven by seismic activity27,28). The profiles of sediment core excess 210Pb (210Pbex:
defined as the 210Pb fraction in secular disequilibrium from 226Ra daughters derived from the atmosphere and
the water column) have clear indications of both processes (Fig. S1). Periods of monotonic exponential decreases
of 210Pbex shown in most core sections reflect relatively constant sediment deposition. Sections of some Atacama
cores (At 2, 3, 5, 7, 9 and 10) exhibit short-term 210Pbex trend reversals and plateaus that reflect dilution of 210Pbex
by episodic mass deposition of low 210Pbex sediment. We calculated constant linear sedimentation rates (i.e., the
sedimentation rates were unvarying down-core) from the periods of continuous deposition, excluding mass
deposition events, and thereby provide a conservative estimate of overall sediment deposition rates at the trench
axis. The Atacama cores exhibiting mass deposition events have similar calculated sedimentation rates to the
other Atacama sites (Table S1).
For our purposes, we grouped Hg concentration data from the top 5–6 cm (4–5 slices; Fig. S2) of each core,
where 210Pbex was present, as “recent” sediments which, based on the vertical accretion rates, represent material
accumulated over about the last 60–190 years (median 120 years). The bottom five slices of each core, including
sediments from 10 to 40 cm depth where 210Pbex was absent (see Fig. S1), were grouped as “historical” sediments.
Although the historical samples can not be accurately dated, they occur at core depths well below the point of
210
Pbex extinction, which would typically place their deposition prior to about the middle of the nineteenth
century given 210Pb’s half-life of 22.3 years.
Atacama sediments overall contained significantly higher Hg concentrations (P < 0.001) than Kermadec
(Fig. 2). Sites in the trenches at both locations contained similar recent Hg concentrations to sites on the adja-
cent abyssal plains and slope (i.e., At1, At7, At9, and Kc7; the difference between trench and abyssal sites is
non-significant at P > 0.05). Recent Atacama sediments on average had significantly higher Hg concentrations
(188 ± 56 ng g−1; P < 0.001) than historical sediments (137 ± 51 ng g −1). The exception to this pattern was At2, in
which recent sediments had lower Hg concentrations (P < 0.01) than historical. Recent Kermadec sediment Hg
concentrations averaged across all sites (44 ± 26 ng g−1) were not significantly different from historical sediments
(41 ± 16 ng g−1; P > 0.05), although they were higher at Kc7 (P < 0.001).
The recent and historical Hg concentrations at Atacama were markedly higher than those in surface sediments
in other oceanic regions remote from anthropogenic or hydrothermal sources, where Hg concentrations were
usually < 80 ng g−1 9,15. They were also higher than in other hadal and abyssal sites where mean concentrations
ranged from 12 ± 6 to 132 ± 20 ng g −1 (Fig. 3A)16,18,19. The mean Atacama values were even higher than in some
regions affected by anthropogenic activities. For example, the most contaminated deep-ocean site in the Medi-
terranean Basin exhibited a mean Hg concentration of 77 ng g −1 13. Maximum concentrations in recent Atacama
sediments, which ranged up to 401 ng g −1 (see Fig. S2) are the highest reported from remote locations anywhere
including in the Kamchatka Trench and abyssal plains (158 ng g−1 16) and bathyal areas of the Southern Ocean
(87 ng g−1 15). They approach the maxima reported from some of the most contaminated shelf sites world-wide
including the Bohai Sea, China (574 ng g −129) and the Laurentian Trough, Canada (520 ng g−1 11).
POM scavenging and sedimentation of Hg from the euphotic zone, which is ultimately sourced from atmos-
pheric deposition, is likely the main source of Hg in deep-ocean sediments. This is evidenced by Hg isotope
analyses of hadal s ediments18, ocean Hg-primary productivity m odeling3, and geochemical associations between
Hg and POM especially diatoms in particle traps and s ediments15,17,22. An analysis of the few Hg concentration
and flux data available for hadal and abyssal sediments showed positive though non-significant correlations
between estimated POC flux and sediment Hg concentrations and fluxes (Fig. 3) which are also suggestive of an
upper-ocean source of POM-associated Hg.
There are two other possible sources or processes that can contribute to high Hg concentrations in deep-
ocean sediments. First, post-depositional redistribution of Hg could occur following the decomposition of Hg-
containing POM, releasing dissolved Hg to porewater. Its subsequent diffusion and adsorption onto authigenic
Fe and Mn hydroxides in oxic surface sediments can result in Hg enrichment9,12. Diagenetic redistribution of
Hg is typically negligible in lake and coastal s ediments11,30, but is less studied and could be important in ocean
basins due to different sedimentation and mixing r egimes12,13. As porewater Hg concentrations were not meas-
ured in this study, we cannot directly estimate the magnitude of redistribution. Significant correlations between
concentrations of solid phase Hg and reactive Fe (see Fig. S3), an association suggestive of Hg redistribution12,
were observed in four of nine Atacama cores (At1, At5, At7, At9; Table S2). To test the effect of possible redistribu-
tion, we compared mean recent Hg concentrations with those in the whole cores. Whole core data represent the
Scientific Reports | (2021) 11:10970 | https://doi.org/10.1038/s41598-021-90459-1 2
Vol:.(1234567890)www.nature.com/scientificreports/
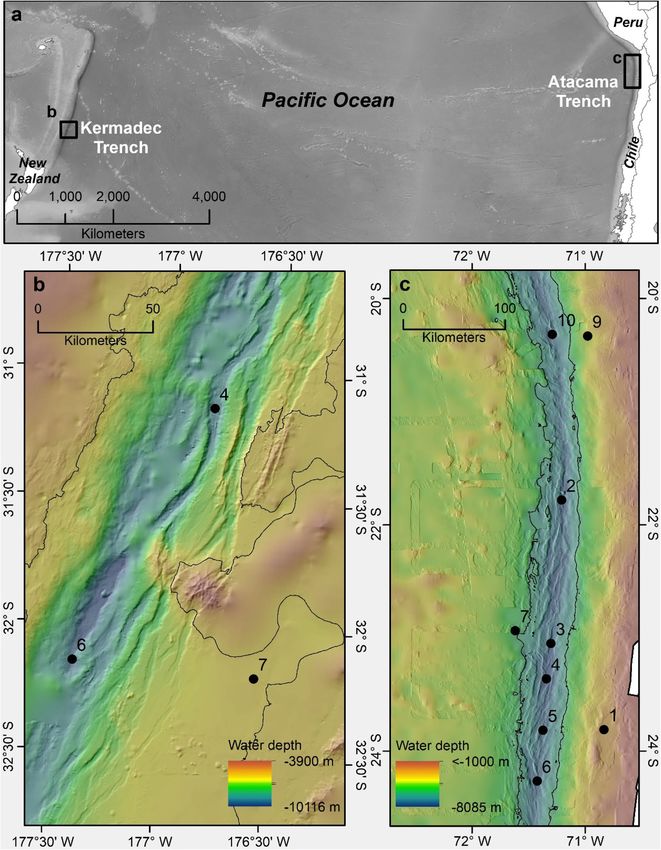
Figure 1. Study areas in the Kermadec Trench and the Atacama Trench regions in the Pacific Ocean (a).
Detailed bathymetry data with specific sampling sites in the Kermadec Trench (b) and Atacama Trench (c).
The sites were visited during two cruises with RV Tangaroa (TAN1711, 2017) and RV Sonne (SO261, 2018),
respectively. Black line in (b) and (c) indicates the 6000 m depth contour. Black line in b and c indicates the 6000
m depth contour. Map adapted from Ref.46. Figure Copyright British Geological Survey UKRI 2021. Bathymetry
data were obtained from the Global Multi-Resolution Topography S ynthesis47.
Scientific Reports | (2021) 11:10970 | https://doi.org/10.1038/s41598-021-90459-1 3
Vol.:(0123456789)www.nature.com/scientificreports/
350 A Historical Hg
Recent Hg
300
***
Hg (ng.g DW)
*** *** ***
250
*
**
-1
200
150
*
100
50 ***
0
140
B
120 *
Hg flux (µg.m .a )
-1
100
*** ***
-2
80 *** *
60 **
***
40
20 Deep
*** Ocean
0
Average
All Sites
All At
All Kc
At 1
At 2
At 3
At 4
At 5
At 6
At 7
At 9
Kc 4
Kc 6
Kc 7
Site At 10
Figure 2. Plots of average (A) Hg concentrations and (B) Hg fluxes at the deep-ocean study sites. Left hand
panels show concentration and fluxes for recent and historical sediments at individual sites. Right hand panels
show concentrations and fluxes at all At and all Kc sites combined, and the concentrations and fluxes in recent
and historical sediments of all sites. For individual sites, in (A) bars represent mean ± standard deviation (SD)
Hg concentrations in the upper 5 cm (“recent”, N = 5) and bottom 5 slices (“historical”, N = 5) of sediment cores.
In (B), bars represent mean ± SD Hg fluxes calculated from the mean and SD concentrations and sediment
accumulation rates. Significant differences between recent and historical Hg concentrations and fluxes indicated
by: *P < 0.05, **P < 0.01, ***P < 0.001. The Deep-Ocean Average line represents the inferred average flux over the
entire deep-ocean based on Outridge et al.1 and Zhang et al.3.
integrated averages of increased surface sediment concentrations and decreased lower core concentrations due
to possible redistribution. Recent sediment Hg concentrations were only 16.7% higher on average than whole
core concentrations at Atacama (188 vs 162 ng g −1), and 1.9% higher at Kermadec (44.3 vs 43.5 ng g −1). Higher
Hg values in recent Atacama sediments but not in Kermadec could also be the result of elevated deposition of
anthropogenic atmospheric Hg into the eastern Pacific Ocean, compared to lower levels of anthropogenic Hg in
ocean waters near K ermadec3. While we cannot resolve the two alternate explanations, the absence of significant
Hg-reactive Fe correlations at the majority of Atacama sites, and the small increase in recent Hg concentrations
relative to whole cores at both trenches, suggests that any effect of redistribution on recent sediment Hg con-
centrations and fluxes was small.
A second possible Hg source in deep-ocean sediments is seafloor hydrothermal vents associated with mid-
ocean ridges. Globally, vents are thought to contribute minor amounts of Hg to oceans, ≤ 100 t a−1 1,22, but could
be locally important. The Atacama study area is several thousand km east of the nearest known hydrothermal
field31 indicating that, in this area with the highest Hg concentrations, hydrothermal influences are negligible.
The Kermadec trench is located relatively close to a hydrothermal field31, but no studies have been conducted
on vent releases or seawater Hg concentrations in this region. However, there is little evidence of significant
hydrothermal impacts on Hg concentrations in seawater32–34 or biota18 in the vicinity of vent plumes elsewhere,
suggesting that the possibility is unlikely in this study. Overall, therefore, the Hg concentrations in these trench
sediments are likely to predominantly reflect POM-associated transport of Hg from the euphotic zone.
Mean total Hg fluxes in recent sediments at Atacama (63.6 ± 30.8 µg m −2 a−1) were significantly higher
−2 −1
(P < 0.001) than in historical sediments (44.4 ± 19.5 µg m a ), and also significantly higher (P < 0.001) than
recent Kermadec sediments (10.4 ± 7.5 µg m −2 a−1; see Fig. 2B). There was no significant difference between
average fluxes measured in trenches and in abyssal plain and slope sites at either location (P > 0.10). Combined
mean recent and historical Hg fluxes were 50.6 ± 36.8 (median 39.1) µg m −2 a−1 and 35.9 ± 23.8 (median 31.5)
−2 −1 −2 −1
µg m a , respectively. A similar range of fluxes (30–44 µg m a ) was reported in post-1900 sediments in a
dated core from the abyssal Kuril Basin17, supporting these findings.
Scientific Reports | (2021) 11:10970 | https://doi.org/10.1038/s41598-021-90459-1 4
Vol:.(1234567890)www.nature.com/scientificreports/
300
)
-1
A Regression r2 = 0.52, df=5, P>0.10
Hg concentration (ng.g DW
250
200 6
150
4
100
5
2
50 3
1
0
100
B
80
Hg flux (µg.m .a )
-1
6
-2
60
40
5
20
3 Y = 16.1 X
P>0.05
0
0 1 2 3 4 5
-2 -1
POC flux (g C.m .a )
Figure 3. Plots of sediment Hg concentrations (A) and fluxes (B), and particulate organic carbon (POC) flux in
hadal trench and abyssal plain sites world-wide. (Plots show mean ± SD values, for the top few cm of sediment
cores or surface sediment grab samples. Study locations and Hg data sources in panel (A): 1—Marianna/
Yap Trenches18, 2—Marianna Trench19, 3—Kermadec Trench and abyssal plain (this study), 4—New Britain
Trench19, 5—Kuril-Kamchatka Trench and abyssal p lain16, 6—Atacama Trench and abyssal plain and slope (this
study). In panel (B), the locations and sources for data points 3 and 6 are the same as in panel A, but for point
5 the flux is from one core on the Kuril Basin abyssal p lain17. Linear regression equations are shown as dashed
lines, and in (B) the regression was forced through the origin. POC flux data are from L onghurst26 as tabulated
24 35
by Stewart and Jamieson and Jamieson .
To place these results in context, the relatively low recent Hg flux measured at Kermadec (10.4 µg m −2 a−1) is
6–15 times higher than the currently estimated deep-ocean average of 0.7–1.8 µg m −2 a−1 1,3. Because the POC flux
at Kermadec is similar to the average of all of the world’s trenches > 6.5 km depth26, Kermadec may approximate
the global average Hg flux in the hadal. The median recent flux across our study sites (39.1 µg m −2 a−1) was 22–56
times larger than the inferred deep-ocean average Hg flux, but the median includes Atacama with the highest
POC flux in the world, and which therefore may have a substantially higher Hg flux than most other trenches.
Overall, however, these results indicate that some hadal trenches and adjacent abyssal areas are intense focal
points of Hg accumulation. The question arises as to what impact these high hadal fluxes might have on global
deep-ocean Hg accumulation rates.
To tentatively calculate the total hadal zone Hg flux, the few available data from hadal and abyssal sites (the
present study, and Aksentov and S attarova17) were used to approximate Hg fluxes for each trench system using the
much larger global trench POC database. Individual trench estimates were summed to arrive at a total hadal Hg
accumulation rate. POC flux data are available for 18 of the deepest trenches > 6.5 km depth, including Atacama
and Kermadec24,35, representing 92% of the global hadal area below 6.5 km. Applying a Hg:POC regression slope
(± standard error, SE) of 16.1 ± 2.9 μg Hg g P OC−1 (see Fig. 3B), we arrive at a preliminary estimate of total Hg
burial of 16.9 ± 1.0 t a –1 in this zone (see Table S3). Scaling up to the much larger hadal area bounded by the 6 km
isobath10, the total Hg flux is estimated to be 73 ± 4.4 t a–1. The error terms for the 18 trenches and for the total
hadal zone were propagated from the SE of the Hg:POC regression slope applied to each trench’s POC data. We
emphasize the uncertainty associated with the 73 t a−1 value because of the few hadal or abyssal sites in total that
have been sampled for Hg fluxes (N = 3), the large variation in fluxes between cores within the study trenches,
and the relatively large confidence intervals associated with the Hg:POC regression (see Fig. 3B).
Conclusions
This study has substantially expanded the knowledge base concerning Hg flux in the deep-ocean. These results
increase by six-fold the number of dated cores analyzed from this zone and provide the first estimates of hadal
Hg flux, which is shown to be high at both study sites relative to the currently accepted deep-ocean average flux.
Although still limited in number and geographical scope, the results can be placed in the context of the current
estimate of deep-ocean Hg accumulation. Our first order estimate of 73 t a −1 for hadal Hg burial represents
Scientific Reports | (2021) 11:10970 | https://doi.org/10.1038/s41598-021-90459-1 5
Vol.:(0123456789)www.nature.com/scientificreports/
12–30% of the putative deep-ocean accumulation of 240–600 t a −1 1,3, occurring within an area equal to 1.1% of
the total deep-ocean. This estimate omits Hg flux in the much larger abyssal zone which is 85% of total ocean
area10. Given the evidence of similarly high Hg fluxes in some abyssal sediments (this study and Ref.17), and
even higher fluxes in high productivity bathyal areas of the Great Southern Ocean15, it is possible that the total
deep-ocean Hg accumulation is higher than is presently believed. Our results thus call for extensive additional
sampling of the deep-ocean to better constrain these preliminary estimates and to improve global Hg modeling.
Methods
Sampling. Sediment was for most part recovered by a multi-corer36, but in some cases we were successful
using box coring (site Kc7) or an autonomous lander system for core recovery (Kc4). Recovered sediment cores
were transferred to an onboard laboratory that maintained in situ bottom water temperature (2–4 °C). For the
Kermadec Trench system, sediment cores were sectioned in 1 cm slices down to 2 cm depth, 2 cm slices to 10 cm
and subsequently in 5 cm slices to the core bottom. For the Atacama Trench system, the cores were sectioned in
1 cm slices down to 10 cm, 2.5 cm slices to 20 cm, followed by 5 cm slices until the bottom of the core. Samples
were homogenized in plastic bags and stored at -20 °C until laboratory analysis onshore.
Excess 210Pb (210Pbex) analysis and sedimentation rate calculation. The procedures for 210Pbex
analysis and sediment accumulation rate calculation are well established, and here followed previous studies
on hadal s ediments37–39. Sediment was dried in an oven at 80 °C for 48 h, then milled with a mortar. 2.0 g of
sediment powder were transferred in a plastic tube and hermetically sealed. The tubes were left for more than 2
months to establish secular equilibrium between 226Ra and 222Rn. To obtain 210Pbex activity, counting peaks of the
specific gamma rays from 210Pb (46.5 keV) and 214Pb (351.9 keV) were measured with well-type HPGe detectors
(GWL120230 and GWL120-15, ORTEC) connected to a multichannel spectrum analyzer (APV8002, TechnoAP
or MCA-7a, SEIKO EG&G). Counting peak areas of the target nuclides were calculated with Gaussian curve fit-
ting with KaleidaGraph 4.5 (Synergy Software). To quantify these activities, Reference Uranium–Thorium ore
DL-1a (CANMET) was used as the standard material. 210Pbex activity was calculated by subtracting 214Pb from
the 210Pb based on an assumption of secular equilibrium between 226Ra and the daughter nuclei in the sediment.
Sediment accumulation rates were calculated based on the Constant Initial Concentration model40,41 from the
210
Pbex activity (Bq g−1) in the core sections displaying exponential decreases in the plots. Instead of the core
depth (cm), cumulative mass depth (g c m−2) obtained from the core depth and the dry bulk density (g c m−3) was
used to express the sediment accumulation rate (initially as g c m−2 a−1).
Hg analysis. Mercury in the sediment samples was determined as total Hg on a Hydra IIC direct mer-
cury analyzer (Teledyne Leeman Labs, Hudson, NH, USA) using thermal decomposition, amalgamation and
atomic absorption spectrophotometry following EPA Method 7 47342. 10–50 mg of individual freeze-dried sedi-
ment samples were weighed into quartz boats. Mercury concentrations were quantified by the external standard
method with calibration curves ranging from 1 to 1500 μg g −1. Within every batch of 10 samples, 3 blanks, 1–2
pairs of duplicates and 2–3 certified reference materials (CRMs: MESS-3, DOLT-5; and NIST 2709a and PACS-3,
obtained from the National Research Council of Canada and NIST, respectively) were analyzed. In order to be
deemed valid, the CRMs must fall within the range of the certified mean ± standard deviation. If CRM concen-
trations were outside the acceptable range, 2 more CRMs were analyzed. If the following CRMs were still outside
the acceptable range, the instrument was re-calibrated. The mean CRM recoveries were 101.9 ± 9.0% and were
within the expected ranges.
Reactive Fe analysis. Two reactive Fe extraction procedures were employed on frozen sediments—Fe-
DCA (Fe species solubilized in a dithionite-citrate-acetic acid solution (50 mg mL−1 sodium dithionite in 0.35 M
sodium citrate, 0.2 M acetic acid, pH 4.8 for 1 h)), and Fe-HCl (Fe species solubilized by a mild HCl extraction
(0.5 M HCl for 1 h)). Fe-DCA extracts the non-silicate-bound Fe fraction (oxides and authigenic Fe(II) phases
excluding pyrite), whereas Fe-HCl releases poorly crystalline oxides and authigenic Fe(II) but also leaches some
Fe from silicates43,44. Fe in the extract solutions was determined as total Fe using Ferrozine45. Concentrations
were calculated on a dry weight basis using the water content.
Statistics. Concentration and flux data in the text are represented as mean ± standard deviation (SD) values.
Mercury concentration and flux data were not normally distributed in some cores, and differences between
recent and historical sediments in these cases were tested with a Mann–Whitney Rank sum test. Those with data
that were normally distributed and which satisfied the assumption of equal variance were analysed with t-tests.
Linear regressions analysed relationships between mean Hg concentrations and fluxes and POC fluxes because
the combined data were normally distributed. We used SigmaPlot 14.0 Software (Systat Software Inc.). Error
propagation was calculated with the online calculator at www.julianibus.de.
Data availability
The data that support the findings of this study are available from the corresponding author upon reasonable
request.
Received: 8 February 2021; Accepted: 11 May 2021
Scientific Reports | (2021) 11:10970 | https://doi.org/10.1038/s41598-021-90459-1 6
Vol:.(1234567890)www.nature.com/scientificreports/
References
1. Outridge, P. M. et al. Updated global and oceanic mercury budgets for the United Nations Global Mercury Assessment 2018.
Environ. Sci. Technol. 52, 11466–11477 (2018).
2. Sunderland, E.M., Mason, R.P. Human impacts on open ocean mercury concentrations. Global Biogeochem. Cycles, 21, GB4022.
https://doi.org/10.1029/2006GB002876 (2007).
3. Zhang, Y. et al. Six centuries of changing oceanic mercury. Global Biogeochem. Cycles 28, 1251–1261 (2014).
4. Evers, D. C. et al. Evaluating the effectiveness of the Minamata Convention on Mercury: Principles and recommendations for next
steps. Sci. Total Environ. 569–570, 888–903 (2016).
5. Wang, F. et al. How closely do mercury trends in fish and other aquatic wildlife track those in the atmosphere? Implications for
evaluating the effectiveness of the Minamata Convention. Sci. Total Environ. 674, 58–70 (2019).
6. Mason, R. P. et al. Mercury biogeochemical cycling in the ocean and policy implications. Environ. Res. 119, 101–117 (2012).
7. Obrist, D. et al. A review of global environmental mercury processes in response to human and natural perturbations: Changes
of emissions, climate, and land use. Ambio 47, 116–140 (2018).
8. Amos, H. M. et al. Legacy impacts of all-time anthropogenic emissions on the global mercury cycle. Global Biogeochem. Cycles
27, 410–421 (2013).
9. Fitzgerald, W. F. et al. Marine biogeochemical cycling of mercury. Chem. Rev. 107, 641–662 (2007).
10. Harris, P. T. et al. Geomorphology of the oceans. Mar. Geol. 352, 4–24. https://doi.org/10.1016/j.margeo.2014.01.011 (2014).
11. Gobeil, C. & Cossa, D. Mercury in sediments and sediment porewater in the Laurentian Trough. Can. J. Fish. Aquat. Sci. 50,
1794–1800 (1993).
12. Gobeil, C. et al. Mercury profiles in sediments of the Arctic ocean basins. Environ. Sci. Technol. 33, 4194–4198 (1999).
13. Ogrinc, N. et al. Distribution of mercury and methylmercury in deep-sea surficial sediments of the Mediterranean Sea. Mar. Chem.
107, 31–48 (2007).
14. Astakhov, A. S. et al. Distribution and accumulation rate of Hg in the upper quaternary sediments of the Deryugin Basin Sea of
Okhotsk. Geochem. Int. 45, 47–61 (2007).
15. Zaferani, S. et al. Diatom ooze - A large marine mercury sink. Science 361, 797–800 (2018).
16. Sattarova, V. V. & Aksentov, K. I. Geochemistry of mercury in surface sediments of the Kuril Basin of the Sea of Okhotsk, Kuril-
Kamchatka Trench and adjacent abyssal plain and northwest part of the Bering Sea. Deep-Sea Res. Part I(154), 24–31 (2018).
17. Aksentov, K. I. & Sattarova, V. V. Mercury geochemistry of deep-sea sediment cores from the Kuril area, northwest Pacific. Prog.
Oceanogr. 180, 102235. https://doi.org/10.1016/j.pocean.2019.102235 (2020).
18. Sun, R. et al. Methylmercury produced in upper oceans accumulates in deep Mariana Trench fauna. Nat. Commun. 11, 3389.
https://doi.org/10.1038/s41467-020-17045-3 (2020).
19. Liu, M. et al. Methylmercury bioaccumulation in deepest ocean fauna: implications for ocean mercury biotransport through food
webs. Environ. Sci. Technol. Lett. 7, 469–476 (2020).
20. Mason, R. P. et al. The biogeochemical cycling of elemental mercury: Anthropogenic influences. Geochim. Cosmochim. Acta 58,
3191–3198 (1994).
21. Munson, K. M. et al. Mercury species concentrations and fluxes in the central tropical Pacific Ocean. Global Biogeochem. Cycles
29, 656–676. https://doi.org/10.1002/2015GB005120 (2015).
22. Lamborg, C. H. et al. An examination of the role of particles in oceanic mercury cycling. Phil. Trans. R. Soc. A 374, 20150297
(2016).
23. John, S. G. & Conway, T. M. A role for scavenging in the marine biogeochemical cycling of zinc and zinc isotopes. Earth Planet.
Sci. Lett. 394, 159–167. https://doi.org/10.1016/j.epsl.2014.02.053 (2014).
24. Stewart, H. A. & Jamieson, A. J. Habitat heterogeneity of hadal trenches: Considerations and implications for future studies. Prog.
Oceanogr. 161, 47–65 (2018).
25. Danovaro, R. et al. A depocenter of organic matter at 7800 m depth in the SE Pacific Ocean. Deep-Sea Res. Part I(50), 1411–1420
(2003).
26. Longhurst, A. Ecological Geography of the Sea 2nd edn. (Academic Press, 2007).
27. Bao, R. et al. Tectonically-triggered sediment and carbon export to the Hadal zone. Nat. Commun. 9, 121. https://doi.org/10.1038/
s41467-017-02504-1 (2017).
28. Oguri, K. et al. Hadal disturbance in the Japan Trench induced by the 2011 Tohoku-Oki earthquake. Sci. Rep. 3, 1915 (2013).
29. Xiao, C. et al. Toxic metal pollution in the Yellow Sea and Bohai Sea, China: Distribution, controlling factors and potential risk.
Mar. Pollut. Bull. 119, 381–389 (2017).
30. Feyte, S. et al. Mercury dynamics in lake sediments. Geochim. Cosmochim. Acta 82, 92–112 (2012).
31. German, C. R. et al. Hydrothermal impacts on trace element and isotope ocean biogeochemistry. Phil. Trans. R. Soc. A 374,
20160035 (2016).
32. Lamborg, C. H. et al. Mercury and monomethylmercury in fluids from Sea Cliff submarine hydrothermal field Gorda Ridge.
Geophys. Res. Lett. 33, L17606. https://doi.org/10.1029/2006GL026321 (2006).
33. Bowman, K.L., et al. Mercury in the North Atlantic Ocean: The U.S. GEOTRACES zonal and meridional sections. Deep Sea Res.
Part II, 116, 251−261 (2015).
34. Bowman, K.L., et al. Distribution of mercury species across a zonal section of the eastern tropical South Pacific Ocean (U.S.
GEOTRACES GP16). Marine Chemistry, 186, 156−166 (2016).
35. Jamieson, A. J. The Hadal Zone: Life in the deepest oceans. Cambridge University Press https://d oi.o
rg/1 0.1 017/C
BO978 11390 61384
(2015).
36. Barnett, P. R. O. et al. Multiple corer for talking virtually undisturbed samples from shelf, bathyal and abyssal sediments. Oceanol.
Acta 7, 399–408 (1984).
37. Glud, R. N. et al. High rates of microbial carbon turnover in sediments in the deepest oceanic trench on Earth. Nat. Geosci. 6,
284–288 (2013).
38. Turnewitsch, R. et al. Recent sediment dynamics in hadal trenches: Evidence for the influence of higher-frequency (tidal, near-
inertial) fluid dynamics. Deep-Sea Res. Part I(90), 125–138 (2014).
39. Wenzhöfer, F. et al. Benthic carbon mineralization in hadal trenches: Assessment by in situ O2 microprofile measurements. Deep-
Sea Res. Part I(116), 276–286 (2016).
40. Krishnaswami, L. D. et al. Geochronology of lake sediments. Earth Planet. Sci. Lett. 11, 207–414 (1971).
41. Robbins, J. A. & Edgington, D. N. Determination of recent sedimentation rates in Lake Michigan using Pb-210 and Cs-137. Geo-
chim. Cosmochim. Acta 39, 285–307 (1975).
42. U.S. EPA. Method 7473 (SW-846): Mercury in solids and solutions by thermal decomposition, amalgamation, and atomic absorp-
tion spectrophotometry, Revision 0. Washington, DC. www.epa.gov/sites/production/files/2015-07/documents/epa-7473.pdf
(2007).
43. Canfield, D. E. Reactive iron in marine sediments. Geochim. Cosmochim. Acta 53, 619–632 (1989).
44. Kostka, J. E. & Luther, G. W. I. I. I. Partitioning and speciation of solid phase iron in saltmarsh sediments. Geochim. Cosmochim.
Acta 58, 1701–1710 (1994).
Scientific Reports | (2021) 11:10970 | https://doi.org/10.1038/s41598-021-90459-1 7
Vol.:(0123456789)www.nature.com/scientificreports/
45. Thamdrup, B. et al. Manganese, iron, and sulfur cycling in a coastal marine sediment, Aarhus Bay Denmark. Geochim. Cosmochim.
Acta 58, 5115–5129 (1994).
46. Glud, R. N. et al. Hadal trenches are dynamic hotspots for early diagenesis in the deep-sea. Commun. Earth Environ. 2, 21. https://
doi.org/10.1038/s43247-020-00087-2 (2021).
47. Ryan, W. B. F. et al. Global multi-resolution topography synthesis. Geochem. Geophys. Geosyst. 10, Q03014. https://doi.org/10.
1029/2008GC002332 (2009).
Acknowledgements
We would like to thank the captains, crews, Ashley Rowden and other scientific personnel of the RV Tangaroa
(TAN1711; 24.11.2017–14.12.2017) and RV Sonne (SO261; 02.03.2018–02.04.2018). Ship time for RV Tanga-
roa was funded by the HADES-ERC Advanced grant “Benthic diagenesis and microbiology of hadal trenches”
#669947 and the Coasts & Oceans Centre of New Zealand’s National Institute of Water & Atmospheric Research
(NIWA, New Zealand), while ship time for RV Sonne was provided by BMBF (Germany). The study was finan-
cially supported by the HADES-ERC Advanced grant “Benthic diagenesis and microbiology of hadal trenches”
#669947, and by the Max Planck Society. The Danish National Research Foundation grant DNRF145 established
the Danish Center for Hadal Research. Furthermore, we would like to thank Johannes Lemburg, Per Martensen,
Ashley Rowden, Diana Macpherson, Matthias Zabel, Anni Glud, Axel Nordhausen and Volker Asendorf for
technical assistance, and Alan J. Jamieson for discussions about POC fluxes. Heather A. Stewart is thanked for
refining Figure 1 from the original references. Michael Parsons reviewed this manuscript for the Geological
Survey of Canada.
Author contributions
All authors contributed directly and substantially in analysis, interpretation, and writing of this manuscript.
H.S. and R.N.G. initiated this project. F.We., and R.N.G. led the seagoing expeditions and co-organized the
sediment sampling, H.S. and P.M.O. contributed equally to the bulk of the data interpretation and writing. G.S.
conducted Hg analysis, K.O. analysed the 210Pb and interpreted the sediment accumulation rates, B.T. conducted
and interpreted the Fe analysis, F.Wa. contributed to discussion of Hg redistribution and estimate of Hg fluxes,
R.N.G. led the project and contributed to interpretation of hadal systems. All authors discussed the results, their
implications and commented on the manuscript as it progressed.
Competing interests
The authors declare no competing interests.
Additional information
Supplementary Information The online version contains supplementary material available at https://doi.org/
10.1038/s41598-021-90459-1.
Correspondence and requests for materials should be addressed to P.M.O.
Reprints and permissions information is available at www.nature.com/reprints.
Publisher’s note Springer Nature remains neutral with regard to jurisdictional claims in published maps and
institutional affiliations.
Open Access This article is licensed under a Creative Commons Attribution 4.0 International
License, which permits use, sharing, adaptation, distribution and reproduction in any medium or
format, as long as you give appropriate credit to the original author(s) and the source, provide a link to the
Creative Commons licence, and indicate if changes were made. The images or other third party material in this
article are included in the article’s Creative Commons licence, unless indicated otherwise in a credit line to the
material. If material is not included in the article’s Creative Commons licence and your intended use is not
permitted by statutory regulation or exceeds the permitted use, you will need to obtain permission directly from
the copyright holder. To view a copy of this licence, visit http://creativecommons.org/licenses/by/4.0/.
© The Author(s) 2021
Scientific Reports | (2021) 11:10970 | https://doi.org/10.1038/s41598-021-90459-1 8
Vol:.(1234567890)You can also read