In-situ monitoring of interface proximity effects in ultrathin ferroelectrics - DORA 4RI
←
→
Page content transcription
If your browser does not render page correctly, please read the page content below
ARTICLE
                  https://doi.org/10.1038/s41467-020-19635-7                 OPEN

                  In-situ monitoring of interface proximity effects in
                  ultrathin ferroelectrics
                  Nives Strkalj 1,4 ✉, Chiara Gattinoni1, Alexander Vogel 2,4, Marco Campanini 2, Rea Haerdi1,
                  Antonella Rossi1,3, Marta D. Rossell 2, Nicola A. Spaldin 1, Manfred Fiebig 1 & Morgan Trassin                                             1✉
1234567890():,;

                  The development of energy-efficient nanoelectronics based on ferroelectrics is hampered by
                  a notorious polarization loss in the ultrathin regime caused by the unscreened polar dis-
                  continuity at the interfaces. So far, engineering charge screening at either the bottom or the
                  top interface has been used to optimize the polarization state. Yet, it is expected that the
                  combined effect of both interfaces determines the final polarization state; in fact the more so
                  the thinner a film is. The competition and cooperation between interfaces have, however,
                  remained unexplored so far. Taking PbTiO3 as a model system, we observe drastic differ-
                  ences between the influence of a single interface and the competition and cooperation of two
                  interfaces. We investigate the impact of these configurations on the PbTiO3 polarization
                  when the interfaces are in close proximity, during thin-film synthesis in the ultrathin limit. By
                  tailoring the interface chemistry towards a cooperative configuration, we stabilize a robust
                  polarization state with giant polarization enhancement. Interface cooperation hence con-
                  stitutes a powerful route for engineering the polarization in thin-film ferroelectrics towards
                  improved integrability for oxide electronics in reduced dimension.

                  1 Department of Materials, ETH Zurich, 8093 Zurich, Switzerland. 2 Electron Microscopy Center, Swiss Federal Laboratories for Materials Science and

                  Technology, Empa, 8600 Dübendorf, Switzerland. 3 Department of Chemical and Geological Sciences, University of Cagliari, 09124 Cagliari, Italy. 4These
                  authors contributed equally: Nives Strkalj, Alexander Vogel. ✉email: nives.strkalj@mat.ethz.ch; morgan.trassin@mat.ethz.ch

                  NATURE COMMUNICATIONS | (2020)11:5815 | https://doi.org/10.1038/s41467-020-19635-7 | www.nature.com/naturecommunications                             1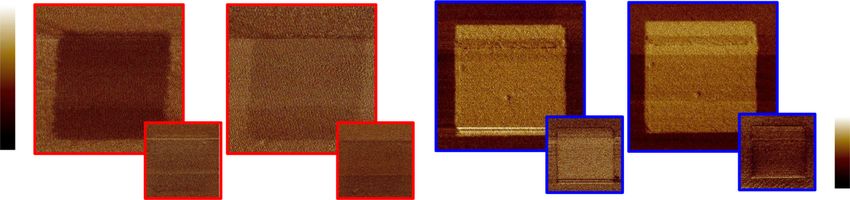
ARTICLE                                                                 NATURE COMMUNICATIONS | https://doi.org/10.1038/s41467-020-19635-7

T
        he two interfaces of a thin film are instrumental in setting            a                                           Time (s)                b                                      Time (s)
        its properties. Tight control over the interface configura-

                                                                                                                                                   ISHG intensity (%)
                                                                                                                 0             120         240                                0             60             120
        tion is therefore vital for applications. For example, in                                                                                                                                    40 u. c.
                                                                                                                 550 °C, 0.12 mbar O2
ferroelectric materials, a major obstacle to stabilizing the electric                                                                                                   100
                                                                                                                  PbO
polarization in ultrathin layers is uncompensated bound charge at                                          0.1                                                          50
                                                                                                                  PTO
the interfaces1–4. Approaches to combat the resulting depolariz-                                                                                                                                     20 u. c.

                                                                                ISHG intensity (arb. u.)
                                                                                                                  TiO2                                                   0
ing field focus on acting on the bound charge at either the bottom                                                 (La,SrO)+0.7
interface by introducing metallic buffer electrodes2,4 and atomic-                                                LSMO                             c                          LSMO             PTO
scale interface engineering5, or at the top interface by introducing
charge-screening environments such as gases6,7 or liquids8–10.
Acting on both interfaces in the same experiment is hampered by
the lack of separate, yet simultaneous experimental access for
observing how these interfaces set the resulting polarization state

                                                                                                                                                      OOP B (pm)
of the film. Understanding such correlation becomes especially                                                                                                           20
                                                                                                            0                                                           10
significant when the interfaces are separated by only a few                                                               (i)          (ii) (iii)                         0
nanometers.
   Combined interface effects in ferroelectric thin films are most                                                0   0       8        8                                         20            10              0
                                                                                                                  PTO thickness (u. c.)                                       Distance to top interface (u. c.)
directly accessed by observing the spontaneous polarization right
when it is formed—during assembly of the film in the growth                   Fig. 1 Polarization suppression from competitive interfaces. a ISHG signal
chamber11,12. Using a laser-optical detection technique, in situ             tracking the PTO thin-film polarization during ongoing (filled red symbols,
second harmonic generation (ISHG)13, we achieve this in ferro-               0–8 u. c.) and halted (filled black symbols) growth. The time axis for this
electric PbTiO3 (PTO). We use PTO as a model system to explore               growth protocol reveals relaxation of the polarization on the order of 102 s.
the joint effects of two nanometer-spaced interfaces. We design              The inset shows the chemistries of interfacial planes at the PTO∣LSMO
and identify the influence of the bottom layer for itself and                 interface and the polarization direction set by the bottom interface. The
compare it to the influence exerted jointly by the PTO bottom and             dashed line indicates recovery of the ISHG intensity upon resuming the
top interfaces, which we then relate to the resulting net polar-             deposition. b Time-dependent ISHG signal after interrupting deposition,
ization. Microscopic understanding is gained through scanning                normalized to the maximum value = 100. c Post-deposition STEM map of
transmission electron microscopy (STEM), angle-resolved X-ray                the dipole moments. The arrows show the direction (color wheel) and
photoelectron spectroscopy (XPS), and first-principles calcula-               amplitude (arrow length) of the associated dipole moments (top). Scale bar
tions. Competitive and cooperative interface configurations are               is 1 nm. The OOP B-site displacement (δB) of the persistent state is mapped
achieved by engineering the termination of the bottom interface to           throughout the PTO∣LSMO bilayer (bottom). Black symbols refer to LSMO,
cause the film to exhibit either upwards or downwards polariza-               red and blue symbols refer to upwards and downwards polarization,
tion, while the top interface always promotes downwards polar-               respectively, in PTO. The error bars are the standard error of the mean. The
ization. In the cooperative case, giant polarization enhancement             electrostatic boundary conditions at the La0.7Sr0.3O∣TiO2-terminated
occurs when the influence of the top interface complements that               LSMO∣PTO interface result in the observed displacement discontinuity, see
of the bottom layer. Such fundamental understanding of proxi-                main text and ref. 16.
mity effects of thin-film interfaces should help to promote the
integration of ultrathin ferroelectrics beyond previous limitations.
                                                                                The observed absence of a critical thickness (i) has been pre-
                                                                             viously reported for Pb-based ferroelectrics16–19, and is further
Results                                                                      highlighted in Supplementary Note 2. The ISHG drop at the growth
We begin our investigation by monitoring the emergence of                    interruption (ii) is only observed for PTO films thinner than 40 u. c.
polarization in a PTO film using ISHG13. SHG denotes frequency                (see Fig. 1b). The origin of the ISHG drop could be sample
doubling of a light wave in a material, a process sensitive to the           degradation, polarization suppression, or domain formation4,20. We
absence of inversion symmetry. It therefore occurs with the onset            therefore conduct a post-deposition STEM analysis by mapping the
of ferroelectric order, and with an amplitude that is proportional           atomic displacements throughout the PTO film. The local mani-
to the dipole moment and thickness in thin films14,15. All ISHG               festation of the polarization drop (ii) in the high-quality films is
measurements were conducted under identical experimental                     twofold, see Fig. 1c. First, dipole moments next to the top interface
conditions, see “Methods,” and the resulting intensities in arbi-            are reversed with respect to the direction set by the bottom interface,
trary units can thus be quantitatively compared. Simultaneously,             pointing downwards across 3–4 u. c. Second, beneath this region,
reflection high energy electron diffraction (RHEED) is performed              the dipole moments retain the orientation set by the bottom
to ensure the growth quality and to calibrate the ISHG yield to the          interface, but their magnitude is suppressed, with PTO out-of-plane
film thickness with unit-cell (u. c.) accuracy.                               (OOP) B-site displacements of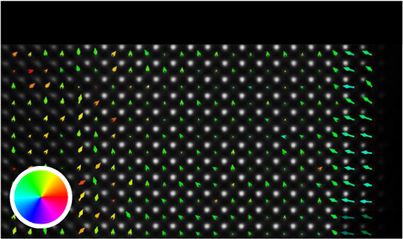
NATURE COMMUNICATIONS | https://doi.org/10.1038/s41467-020-19635-7 ARTICLE
combined influence of both interfaces determines the resulting preference (Fig. 2). We verified the giant cooperative polarization
polarization. Specifically, the top interface promotes downwards enhancement (ii) by STEM, finding a pervasive bulk-like OOP
polarization. The strong suppression of the net polarization as B-site displacement of about 16 pm (see Fig. 2c). The observed
described above is a response that neither interface alone would ISHG evolution (ii–iii) was verified on more than 40 samples, see
generate; it is a remarkable manifestation of a combined interface Supplementary Note 3.
effect. The immediate restoration of the initial ISHG signal upon We next pinpoint the mechanism promoting pervasive down-
resuming growth indicates a return to the state dictated by the wards polarization at the top interface. We rule out the intrinsic
bottom interface only. Accordingly, we identify the transient chemistry of the PTO termination as a possible explanation
regime during growth as the “single-interface-contribution” because, according to ab initio calculations22, both the PbO and the
regime and the persistent regime once the growth is stopped as TiO2 top termination favor an upwards polarization. Our tests with
the “combined-interface-contribution” regime. other ferroelectric perovskites rather point to non-stoichiometry as
Having revealed that competitive interfaces lead to a pro- the likely origin because the striking polarization evolution (ii–iii)
nounced decrease of polarization, we now scrutinize the possibility was only observed for materials with A-site volatility, i.e., PTO, Pb
of a polarization enhancement by cooperative interfaces. We [ZrxTi1−x]O3 (PZT), and BiFeO3 (BFO), in contrast to BaTiO3
choose MnO2-terminated LSMO as the buffer, thus promoting (BTO)4 (see Supplementary Note 3). A-site volatility is usually
downwards polarization at the bottom interface5, while keeping compensated by A-site-excess targets in pulsed laser deposition
the same strain and growth conditions as in the competitive case. (PLD) to recover the stoichiometry in the bulk of the films. It can,
During PTO deposition, the ISHG signal now evolves as follows. however, induce non-stoichiometry at the film surface. In line with
(i) Following a delayed onset of polarization, further detailed in this, a non-stoichiometric phase of Bi2O3−x at the surface has been
Supplementary Note 2, the ISHG yield increases steadily with shown to cause a local polarization change in BFO films23,24.
thickness. (Note that the bump in the SHG net intensity is caused Similarly, cationic vacancies were reported to affect the PTO
by interference with surface-induced background SHG.) (ii) A polarization orientation25. Furthermore, the observed time for the
giant tenfold enhancement of ISHG intensity is observed upon reconstruction of polarization (ii) of about 102 s matches the the-
growth interruption. (iii) As before, the transient ISHG intensity is oretically derived value in response to ion migration26. Most
restored with the continuation of the growth. importantly, the post-growth surface-sensitive angle-resolved XPS
The tenfold enhancement is an impressive manifestation of the data shown in Fig. 3a and energy dispersive X-ray analysis reveal
difference between the action of a single (bottom) interface and increasing Pb content toward the surface of our PTO films for both
the joint action of both (top and bottom) interfaces in the tran- the competitive and the cooperative interfaces (see details in
sient and persistent regime, respectively. It only appears in PTO Supplementary Note 4). The non-stoichiometry of PTO toward the
films thinner than 40 u. c., see Fig. 2b, which emphasizes the role surface is likely in the form of Pb adatoms. We note that other
of interface proximity. Furthermore, whereas in the case of a single sources of non-stoichiometry such as Pb substitution of Ti atoms
effective interface, upwards polarization exhibits the larger SHG were not detected. In summary, we conclude that the Pb-rich top
yield and, thus, dipole moment (Fig. 1), the cooperative action of layer results in a positively charged top interface where it promotes
two interfaces promoting downwards polarization overrules this a downwards polarization.
We use density functional theory (DFT) to verify that non-
stoichiometry at the top interface determines the net polarization
a Time (s) b Time (s) of the film in the persistent regime. We simulate the non-
0 120 240 360 0 60 120 stoichiometry by introducing a Pb adatom at the top interface of a
ISHG intensity (%)
550 °C, 0.12 mbar O2 40 u. c. stoichiometric lattice of PTO27–29. We fix the direction of the
0.5 TiO2
100 dipole moment in the film at the bottom interface to either up or
PTO 50 down to match with our experiments and allow the ions in the
PbO rest of the film to relax. Our calculations reveal that for an up-
ISHG intensity (arb. u.)
0.4 20 u. c.
(MnO2) –0.7 0 polarized bottom interface the resulting positive bound charge at
LSMO
c LSMO PTO the top interface is disfavored by the Pb adatom. In response, see
0.3
Fig. 3b, the dipole moment is suppressed throughout the layer
and reversed in the topmost u. c. to reduce the total energy of the
0.2
film. In contrast, for a down-polarized bottom interface, the
associated negative bound charge at the top interface is com-
0.1 pensated by the positive charge of the bound Pb adatom (Fig. 3c).
OOP δB (pm)
20 This results in a stabilization of the ferroelectric polarization,
10
0 (i) (ii) (iii)
0
which remains bulk-like throughout the film.
We thus arrive at the following scenario for the growth
0 0 16 16 20 10 0
PTO thickness (u. c.) dynamics of our PTO films. During growth (transient regime in
Distance to top interface (u. c.)
Fig. 3d, e), epitaxial stabilization30 promotes stoichiometry in the
Fig. 2 Polarization enhancement from cooperative interfaces. a ISHG PTO films. The film polarization follows the state set at the
signal during ongoing (filled blue symbols, 0–16 u. c.) and halted (filled bottom interface by the respective LSMO termination. Once the
black symbols) growth. The inset shows the chemistries of interfacial growth is stopped, the excess Pb from the Pb-rich target material
planes at the PTO∣LSMO interface and the polarization direction set by the (see “Methods”) diffuses toward the film surface, which results in
bottom interface. b Time-dependent ISHG signal after interrupting accumulation of positive charges at the top interface. In response,
deposition, normalized to the maximum value = 100. c Post-deposition the polarization of the film is suppressed or enhanced (persistent
STEM map of the dipole moments. The arrows show the direction (color regime in Fig. 3d, e).
wheel) and amplitude (arrow length) of the dipole moments (top). Scale We then investigate how the interface-induced polarization
bar is 1 nm. The OOP B-site displacement (δB) of the persistent state is suppression and enhancement affect the electric-field poling of
mapped throughout the PTO∣LSMO bilayer (bottom). Black symbols refer the PTO films. The results of the time-dependent switching
to LSMO, and blue symbols refer to downwards polarization in PTO. The behavior are shown in Fig. 4. In both interface configurations, the
error bars are the standard error of the mean. polarization can be locally reversed by the voltage applied to a
NATURE COMMUNICATIONS | (2020)11:5815 | https://doi.org/10.1038/s41467-020-19635-7 | www.nature.com/naturecommunications 3ARTICLE NATURE COMMUNICATIONS | https://doi.org/10.1038/s41467-020-19635-7
a b c
Bulk Surface PbO TiO2
5
Pb/Ti ratio
3
1
20 40 60 80
Emission angle (°)
d
e
Fixed Fixed
–40 0 40 –40 0 40
p (μC/cm2) p (μC/cm2)
Fig. 3 Competitive and cooperative configurations explored by XPS and DFT. a Pb/Ti atomic ratio at XPS emission angles (20–80)∘, higher angles
displaying a higher sensitivity to the sample surface lower angles. Red and blue symbols correspond to the samples with suppressed and enhanced
polarization, respectively. The error bar is based on the estimated experimental accuracy (see “Methods”). b, c Density-functional calculations of dipole
moments (p) perpendicular to the bottom interface in PTO heterostructures with a Pb adatom on the surface. The polarization direction is imposed at the
bottom interface to match with our experiments by fixing the dipole moment of the first u. c. in the calculation (marked as “fixed”). The atomic positions in
heterostructures with (b) PbO and (c) TiO2 top-interface termination and their ionic positions are depicted on the right-hand side of the graph. d, e Sketch
of the competitive and cooperative interfaces for the transient (left) “single-interface” and the persistent (right) “combined-interface” regime. The favored
polarization direction at each interface is indicated with arrows and the resulting bound charges are represented with “+” and “–” signs. The additional
positive charges at the top interface introduced to emulate the non-stoichiometry are shown as “⨁”.
a b c d
P-up After 48 h After 48 h
As-grown As-grown
+4 V –4 V
P-left
P-down
P-right
Fig. 4 Stability of the electric-field-induced polarization switch over time. a–d PFM out-of-plane (in-phase, main panel) and in-plane (quadrature, inset)
data immediately after the poling (±4 V) and 48 h later for a, b competitive and c, d cooperative interface configurations. PTO films are 20 u. c. thick and
scale bars are 1 μm.
piezoresponse-force-microscopy (PFM) tip. In the PTO films despite the bulk-like B-site displacements in the PTO layer. We
with competitive interfaces, the electric-field-induced downwards conclude that the remnant positive charges from non-
polarization vanishes after 48 h (see Fig. 4a, b). In contrast, in the stoichiometry at the PTO top-interface efficiently screen the
PTO films with cooperative interfaces, a stable upwards polar- negative bound charges of the enhanced polarization state at the
ization is sustained over the same time period (see Fig. 4c, d). PTO∣STO interface, hence preventing multidomain breakdown.
This correlates with our ISHG and STEM data, indicating a In the case of the suppressed polarization state, on the other
robust ferroelectric response when cooperative interfaces are at hand, the positive charges induced by the non-stoichiometry
work. cannot screen the positive bound charges associated with the
Finally, we test the robustness of the competitive and the coop- oppositely oriented polarization, and multidomain breakdown
erative polarization state by capping the PTO films with 18 u. c. of occurs (see Supplementary Note 4).
STO. STO isolates PTO from the charge-screening oxygen-rich
growth atmosphere and thus enhances the depolarizing field, pro- Discussion
moting a multidomain breakdown4,31. For the suppressed polar- Hence we have shown how, in the ultrathin regime, the proximity
ization state, this breakdown is indeed observed, as confirmed and combined influence of both interfaces in a thin epitaxial oxide
macroscopically and microscopically by the SHG and STEM mea- film determine its properties. We demonstrate drastic differences
surements in Fig. 5a, c. For the enhanced polarization state, how- between competitive and cooperative interface configurations and to
ever, the single-domain state is retained, as seen in Fig. 5b, d, e. the action of a single interface. Specifically, in ferroelectric PTO,
Although one might assume the state with the higher net polar- cooperative interfaces stabilize a bulk polarization state down to the
ization to be more prone to energy minimization through multi- ultrathin regime of about 10 u. c. and protect it against depolarizing-
domain breakdown, it is, in fact, more robust against STO capping. field-induced multidomain breakdown. Selective access to the
A possible explanation for this striking behavior is provided interfaces and their correlation is enabled by a unique combination
by the STEM data in Fig. 5d. We find a sharp dipole-moment of ISHG, STEM, and XPS measurements. We expect our findings to
discontinuity across the epitaxial PTO∣STO interface, which is be relevant for nanoscale oxide thin films in which interfacial
revealed by the absence of B-site displacements in the STO layer chemistry and charge imbalance at large are important, beyond the
4 NATURE COMMUNICATIONS | (2020)11:5815 | https://doi.org/10.1038/s41467-020-19635-7 | www.nature.com/naturecommunicationsNATURE COMMUNICATIONS | https://doi.org/10.1038/s41467-020-19635-7 ARTICLE
a b focused onto the sample in the thin-film growth environment in reflection at 45°
0 0
β β with a pulse energy of 30 μJ and a spot size 250 μm in diameter. The optical SHG
signal was generated at 600 nm and detected using a monochromator and a
photomultiplier system.
270 90 270 90
Analysis of SHG signal. The SHG process is expressed by the equation
ð2Þ
Pi ð2ωÞ ¼ ϵ0 χ ijk Ej ðωÞEk ðωÞ, where Ej,k(ω) and Pi(2ω) are the electric-field com-
180 180 ponents of the incident light and of the frequency-doubled polarization, respec-
tively. The point-group symmetry of a compound determines the set of its tensor
ð2Þ
c 1 10 1 10 d 1 10 1 10 components χ ijk ≠ 0. The anisotropy simulations of the tetragonal 4mm group were
NSTO NPTO NSTO NPTO consistent with the SHG data when the components χ ð2Þ ð2Þ ð2Þ
xzx , χ zxx , and χ zzz were fitted
20 20 as nonzero.
lP B (pm)
0 lP B (pm) 0
Scanning transmission electron microscopy (STEM). Cross-sectional specimens
for the STEM analysis were prepared by mechanical polishing using a tripod
–20 –20 polisher followed by argon ion milling using a Fishione ion miller model 1050
–40 –20 0 20 40 –40 –20 0 20 40 operated at 3 kV until electron transparency. A FEI Titan Themis equipped with a
OOP B (pm) OOP B (pm) probe CEOS DCOR spherical aberration corrector and ChemiSTEM technology
operated at 300 kV was used for HAADF-STEM imaging and EDX spectroscopy.
e The atomic-resolution HAADF-STEM images were acquired setting a probe semi-
LSMO PTO STO
convergence angle of 25 mrad in combination with an annular semi-detection
range of the annular dark-field detector of 66–200 mrad. To correct for the scan
distortions, time series consisting of 10 frames (2048 × 2048 pixels) were acquired
and averaged by rigid and nonrigid registration by means of the Smart Align
software34. A Gaussian filter was applied, followed by a custom-developed Python
code for blind probe deconvolution assuming a Gaussian distribution as the initial
probe to reduce the spread of the atomic columns. Subsequently, fitting of the
atomic columns was performed using the Python library Atomap35 and the local
dipole moment was calculated by measuring the polar displacement of the B
position in the image plane from the center of mass of its four nearest A neighbors.
The dipole moment is plotted in the HAADF-STEM images opposite to the B-site
displacement (δB).
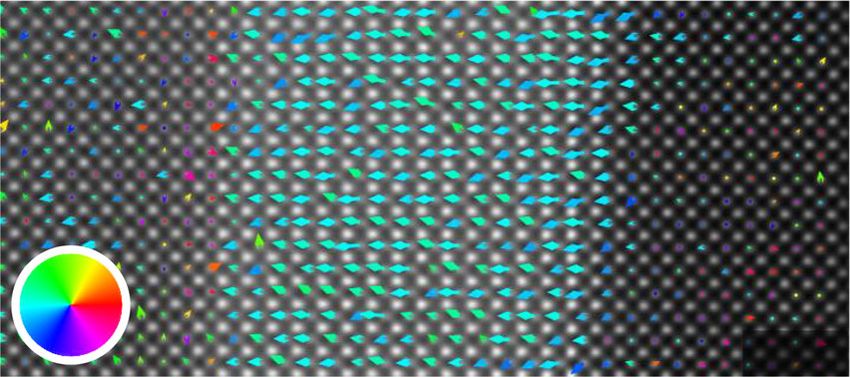
Fig. 5 Stability of net polarization in a STO∣PTO heterostructure.
X-ray photoelectron spectroscopy (XPS). X-ray photoelectron spectra were
a, b SHG anisotropy plots of STO∣PTO bilayers after cooling to room
acquired using a PHI QuanteraSXM (ULVAC-PHI, Chanhassen, MN, U.S.A.)
temperature, shown on the same intensity scale. Data were obtained by spectrometer. The films were mounted on standard PHI platen and analyzed using
simultaneously varying the angle β of the polarization of the incident a monochromatic Al Kα source (hν = 1486.6 eV at 24.5 W); the beam diameter was
fundamental and of the detected SHG light at 1200 and 600 nm, of 100 μm. The analyzer was operated in the fixed analyzer transmission mode. A
respectively. The simulations, see “Methods,” are plotted as continuous pass energy of 69 eV and a step size of 0.125 eV were used to obtain the high-
resolution spectra of C 1s, O 1s, Ti 2p, and Pb 4f. The linearity of the energy scale
lines. Note that for the competitive interfaces (a), a measurable signal is was checked according to ISO15472: 2010 (confirmed in 2015) and the accuracy of
not detected. c, d Logarithmic histogram plots showing the number of the binding-energy value for each element was found to be 0.1 eV. The binding
occurrences NSTO (black) and NPTO of OOP and in-plane (IP) B-site energies were referred to adventitious aliphatic carbon signal taken at 285.0 eV.
displacement (δB) measured in post-deposition STEM images for the The angle-resolved spectra were acquired using the special sample holder designed
by ULVAC-PHI for these measurements, and the calibration for the eucentric tilt
(c) competitive (red) and the (d) cooperative (blue) interface was carried out before each spectral acquisition so that the spectra were collected
configuration. The zero net value of B-site displacement in the OOP on the samples by maintaining the analysis area always on the focal point of the x-
direction of the competitive case in the multidomain state is the result of ray source and of the analyzer at all emission angles. The estimated experimental
polarization averaging across the thickness of the lamella. e Post-deposition accuracy of 10% is primarily a result of: signal-to-noise ratio, peak intensity,
accuracy of relative sensitivity factors, and correction for electron transmission
STEM map of PTO dipole moments after STO capping in the cooperative
function. During the analysis, the residual pressure in the main chamber was
configuration. The arrows show the direction (color wheel) and amplitude measured to be around 10−7 Pa. The spectra were processed using CASAXPS
(arrow length) of the dipole moments. Scale bar is 1 nm. software (version 2.3.15, Casa Software Ltd.).
specific A-site volatile proper ferroelectrics investigated here. Bi- Ab initio calculations. DFT calculations of PTO thin films, both without buffer
interfacial control of ultrathin films can thus become a key factor in and on LSMO were carried out with VASP36 using the PBEsol37 functional,
which gives a good metal/insulator band alignment at the interface, with the
bypassing present limitations of oxide-electronic functionalities and Fermi level of the metal falling within the PTO gap38. The alloying in LSMO was
devices32,33. simulated using the virtual crystal approximation39,40. Core electrons were
replaced by projector augmented wave potentials41, and the valence states were
expanded in plane waves with a cutoff energy of 500 eV. A Monkhorst-Pack grid
Methods of 3 × 3 × 1 k-points was used for all thin films with a surface area of 2 × 2 u. c.
Thin-film deposition. The thin films and heterostructures were grown on TiO2- A 14-layer-thick (1 × 1) PTO (001) slab, consisting of 7 u. c. was found to be
terminated STO (001) substrates by PLD using a KrF excimer laser at 248 nm. The sufficient to converge the surface energy. The in-plane and out-of-plane lattice
fluence of the laser, its repetition rate, substrate temperature, and growth pressure parameters were set to those of the STO substrate (a = 3.905 Å) and the PTO
for individual layers were as follows: SrRuO3 (SRO): 0.9 Jcm−2, 2 Hz, 700 °C, bulk value (c = 4.11 Å), respectively. In all cases, the atoms of the four bottom
0.1 mbar O2; LSMO: 0.9 Jcm−2, 1 Hz, 700 °C, 0.15 mbar O2; PTO: 1.15 Jcm−2, layers of the PTO were fixed to the calculated bulk values, while the rest of the
4 Hz, 550 °C, 0.12 mbar O2; and STO: 1.15 Jcm−2, 2 Hz, 550 °C, 0.12 mbar O2. The system was allowed to relax.
PTO target was Pb-enriched (Pb1.2TiO3) and the other targets were stoichiometric.
The thickness of the thin films was monitored using RHEED during growth. The
thin-film topography and PFM were performed using a Bruker Multimode 8 Data availability
atomic force microscope. The data that support the findings of this study are available from the corresponding
authors upon request.
In situ second harmonic generation (ISHG). The incident light was generated
from a Ti:Sapphire laser light with a pulse duration of 45 fs, a repetition rate of Received: 18 June 2020; Accepted: 25 October 2020;
1 kHz, and a wavelength of 800 nm, which was converted using an optical para-
metric amplifier to light with a wavelength of 1200 nm. This incident beam was
NATURE COMMUNICATIONS | (2020)11:5815 | https://doi.org/10.1038/s41467-020-19635-7 | www.nature.com/naturecommunications 5ARTICLE NATURE COMMUNICATIONS | https://doi.org/10.1038/s41467-020-19635-7
References 33. Li, L. et al. Observation of strong polarization enhancement in ferroelectric
1. Zubko, P. et al. Electrostatic coupling and local structural distortions at tunnel junctions. Nano Lett. 19, 6812–6818 (2019).
interfaces in ferroelectric/paraelectric superlattices. Nano Lett. 12, 2846–2851 34. Jones, L. et al. Smart align—a new tool for robust non-rigid registration of
(2012). scanning microscope data. Adv. Struct. Chem. Imaging 1, 8 (2015).
2. Lichtensteiger, C., Fernandez-Pena, S., Weymann, C., Zubko, P. & Triscone, J. 35. Nord, M., Vullum, P. E., MacLaren, I., Tybell, T. & Holmestad, R. Atomap: a new
M. Tuning of the depolarization field and nanodomain structure in software tool for the automated analysis of atomic resolution images using two-
ferroelectric thin films. Nano Lett. 14, 4205–4211 (2014). dimensional Gaussian fitting. Adv. Struct. Chem. Imaging 3, 9 (2017).
3. Liu, G. et al. Positive effect of an internal depolarization field in ultrathin 36. Kresse, G. & Hafner, J. Ab initio molecular dynamics for liquid metals. Phys.
epitaxial ferroelectric films. Adv. Electron. Mater. 2, 1500288 (2016). Rev. B 47, 558–561 (1993).
4. Strkalj, N. et al. Depolarizing field effects in epitaxial capacitor 37. Perdew, J. P. et al. Restoring the density-gradient expansion for exchange in
heterostructures. Phys. Rev. Lett. 123, 147601 (2019). solids and surfaces. Phys. Rev. Lett. 100, 136406 (2008).
5. Yu, P. et al. Interface control of bulk ferroelectric polarization. PNAS 109, 38. Stengel, M., Aguado-Puente, P., Spaldin, N. A. & Junquera, J. Band alignment
9710–9715 (2012). at metal/ferroelectric interfaces: Insights and artifacts from first principles.
6. Wang, R. V. et al. Reversible chemical switching of a ferroelectric film. Phys. Phys. Rev. B 83, 235112 (2011).
Rev. Lett. 102, 047601 (2009). 39. Nordheim, L. Zur elektronentheorie der metalle. I. Ann. Phys. 401, 607–640
7. Highland, M. J. et al. Equilibrium polarization of ultrathin PbTiO3 with (1931).
surface compensation controlled by oxygen partial pressure. Phys. Rev. Lett. 40. Muto, T. On the electronic structure of alloys. Sci. Pap. Inst. Phys. Chem. Res.
107, 187602 (2011). 34, 377 (1938).
8. Shin, J. et al. Atomistic screening mechanism of ferroelectric surfaces: an 41. Kresse, G. & Joubert, D. From ultrasoft pseudopotentials to the projector
in situ study of the polar phase in ultrathin BaTiO3 films exposed to H2O. augmented-wave method. Phys. Rev. B 59, 1758–1775 (1999).
Nano Lett. 9, 3720–3725 (2009).
9. Tian, Y. et al. Water printing of ferroelectric polarization. Nat. Commun. 9,
3809 (2018). Acknowledgements
10. Domingo, N. et al. Surface charged species and electrochemistry of M.T. acknowledges the Swiss National Science Foundation under Project No. 200021-
ferroelectric thin films. Nanoscale 11, 17920–17930 (2019). 188414. N.S., M.T. and M.F. acknowledge support by the EU European Research Council
11. Bein, B. et al. In situ X-ray diffraction and the evolution of polarization during under Advanced Grant Program No. 694955-INSEETO. M.F. acknowledges support by
the growth of ferroelectric superlattices. Nat. Commun. 6, 10136 (2015). the Swiss National Science Foundation under Project No. 200021-178825. N.S. and M.T.
12. Strkalj, N., Gradauskaite, E., Nordlander, J. & Trassin, M. Design and thank Gabriele De Luca for fruitful discussions and Elzbieta Gradauskaite and Martin
manipulation of ferroic domains in complex oxide heterostructures. Materials Sarott for experimental assistance. C.G. is supported by the European Union’s Horizon
12, 3108 (2019). 2020 research and innovation programme under the Marie Skłodowska-Curie Grant
13. De Luca, G. et al. Nanoscale design of polarization in ultrathin ferroelectric Agreement No. 744027. C.G.’s computational work was supported by a grant from the
heterostructures. Nat. Commun. 8, 1419 (2017). Swiss National Supercomputing Centre (CSCS) under project ID s870. N.S., C.G., A.R.,
14. Nordlander, J., De Luca, G., Strkalj, N., Fiebig, M. & Trassin, M. Probing N.A.S., M.F., and M.T. acknowledge support from ETH Zurich. A.V., M.C., and M.D.R.
ferroic states in oxide thin films using optical second harmonic generation. acknowledge support by the Swiss National Science Foundation under Project No.
Appl. Sci. 8, 570 (2018). 200021-175926. A.R. thanks technical support from Giovanni Cossu.
15. Denev, S. A., Lummen, T. T. A., Barnes, E., Kumar, A. & Gopalan, V. Probing
ferroelectrics using optical second harmonic generation. J. Am. Ceram. Soc. Author contributions
94, 2699–2727 (2011). All authors discussed the results. N.S., M.T., and M.F. wrote the manuscript. N.S. per-
16. Stengel, M., Vanderbilt, D. & Spaldin, N. A. Enhancement of ferroelectricity at formed the thin-film growth, PFM, ISHG measurements and structural analysis. C.G.,
metal-oxide interfaces. Nat. Mater. 8, 392–397 (2009). R.H., and N.A.S. performed the DFT calculations. A.V., M.C. and M.D.R. carried out the
17. Sai, N., Kolpak, A. M. & Rappe, A. M. Ferroelectricity in ultrathin perovskite STEM investigations. A.R. supervised, processed, and interpreted the XPS data. M.T.
films. Phys. Rev. B 72, 020101 (2005). designed the experiment and supervised the work jointly with M.F.
18. Fong, D. D. et al. Stabilization of monodomain polarization in ultrathin
PbTiO3 films. Phys. Rev. Lett. 96, 127601 (2006).
19. Gao, P. et al. Possible absence of critical thickness and size effect in ultrathin Competing interests
perovskite ferroelectric films. Nat. Commun. 8, 15549 (2017). The authors declare no competing interests.
20. Duan, C.-G., Sabirianov, R. F., Mei, W.-N., Jaswal, S. S. & Tsymbal, E. Y. Interface
effect on ferroelectricity at the nanoscale. Nano Lett. 6, 483–487 (2006).
21. Glazer, A. M. & Mabud, S. A. Powder profile refinement of lead zirconate titanate
Additional information
Supplementary information is available for this paper at https://doi.org/10.1038/s41467-
at several temperatures. II. Pure PbTiO3. Acta Cryst. B34, 1065–1070 (1978).
020-19635-7.
22. Gattinoni, C. et al. Interface and surface stabilization of the polarization in
ferroelectric thin films. PNAS 202007736 https://doi.org/10.1073/pnas.2007736117
Correspondence and requests for materials should be addressed to N.S. or M.T.
(2020).
23. Xie, L. et al. Giant ferroelectric polarization in ultrathin ferroelectrics via
Peer review information Nature Communications thanks the anonymous reviewer(s) for
boundary-condition engineering. Adv. Mater. 29, 1701475 (2017).
their contribution to the peer review of this work. Peer reviewer reports are available.
24. Béa, H. et al. Influence of parasitic phases on the properties of BiFeO3 epitaxial
thin films. Appl. Phys. Lett. 87, 072508 (2005).
Reprints and permission information is available at http://www.nature.com/reprints
25. Weymann, C. et al. Full control of polarization in ferroelectric thin films using
growth temperature to modulate defects. Adv. Electron. Mater.
Publisher’s note Springer Nature remains neutral with regard to jurisdictional claims in
2000852 https://doi.org/10.1002/aelm.202000852 (2020).
published maps and institutional affiliations.
26. Vorotiahin, I. S., Morozovska, A. N. & Genenko, Y. A. Hierarchy of domain
reconstruction processes due to charged defect migration in acceptor doped
ferroelectrics. Acta Materialia 184, 267–283 (2020).
27. Stephenson, G. B. & Highland, M. J. Equilibrium and stability of polarization Open Access This article is licensed under a Creative Commons
in ultrathin ferroelectric films with ionic surface compensation. Phys. Rev. B Attribution 4.0 International License, which permits use, sharing,
84, 064107 (2011). adaptation, distribution and reproduction in any medium or format, as long as you give
28. Fechner, M., Ostanin, S. & Mertig, I. Effect of the surface polarization in polar appropriate credit to the original author(s) and the source, provide a link to the Creative
perovskites studied from first principles. Phys. Rev. B 77, 094112 (2008). Commons license, and indicate if changes were made. The images or other third party
29. Garrity, K., Kakekhani, A., Kolpak, A. & Ismail-Beigi, S. Ferroelectric surface material in this article are included in the article’s Creative Commons license, unless
chemistry: first-principles study of the PbTiO3 surface. Phys. Rev. B 88, 045401 indicated otherwise in a credit line to the material. If material is not included in the
(2013). article’s Creative Commons license and your intended use is not permitted by statutory
30. Gorbenko, O. Y., Samoilenkov, S. V., Graboy, I. E. & Kaul, A. R. Epitaxial regulation or exceeds the permitted use, you will need to obtain permission directly from
stabilization of oxides in thin films. Chem. Mater. 14, 4026–4043 (2002). the copyright holder. To view a copy of this license, visit http://creativecommons.org/
31. Das, S. et al. Observation of room-temperature polar skyrmions. Nature 568, licenses/by/4.0/.
368–372 (2019).
32. Martin, L. W. & Rappe, A. M. Thin-film ferroelectric materials and their
applications. Nat. Rev. Mater. 2, 16087 (2016). © The Author(s) 2020
6 NATURE COMMUNICATIONS | (2020)11:5815 | https://doi.org/10.1038/s41467-020-19635-7 | www.nature.com/naturecommunicationsYou can also read