In situ observation of new particle formation (NPF) in the tropical tropopause layer of the 2017 Asian monsoon anticyclone - Part 2: NPF inside ...
←
→
Page content transcription
If your browser does not render page correctly, please read the page content below
Atmos. Chem. Phys., 21, 13455–13481, 2021
https://doi.org/10.5194/acp-21-13455-2021
© Author(s) 2021. This work is distributed under
the Creative Commons Attribution 4.0 License.

In situ observation of new particle formation (NPF) in the tropical
tropopause layer of the 2017 Asian monsoon anticyclone – Part 2:
NPF inside ice clouds
Ralf Weigel1 , Christoph Mahnke2,a , Manuel Baumgartner1,3 , Martina Krämer1,4 , Peter Spichtinger1 , Nicole Spelten4 ,
Armin Afchine4 , Christian Rolf4 , Silvia Viciani5 , Francesco D’Amato5 , Holger Tost1 , and Stephan Borrmann1,2
1 Institut für Physik der Atmosphäre, Johannes Gutenberg University Mainz, Mainz, Germany
2 Abteilung   Partikelchemie, Max-Planck-Institut für Chemie, Mainz, Germany
3 Zentrum für Datenverarbeitung, Johannes Gutenberg University Mainz, Mainz, Germany
4 Institute of Energy and Climate Research (IEK-7), Forschungszentrum Jülich, Jülich, Germany
5 National Institute of Optics, National Research Council (CNR-INO), Florence, Italy
a now at: Institute of Energy and Climate Research (IEK-8), Forschungszentrum Jülich, Jülich, Germany

Correspondence: Ralf Weigel (weigelr@uni-mainz.de)

Received: 18 December 2020 – Discussion started: 5 January 2021
Revised: 20 July 2021 – Accepted: 2 August 2021 – Published: 10 September 2021

Abstract. From 27 July to 10 August 2017, the airborne Stra-   occurred slightly less often than within clouds. In the pres-
toClim mission took place in Kathmandu, Nepal, where eight     ence of cloud ice, NPF with Nnm between 1500–4000 cm−3
mission flights were conducted with the M-55 Geophys-          was observed about twice as often as under clear-air condi-
ica up to altitudes of 20 km. New particle formation (NPF)     tions. NPF was not found when ice water contents exceeded
was identified by the abundant presence of nucleation-mode     1000 µmol mol−1 in very cold air (< 195 K) at tropopause
aerosols, with particle diameters dp smaller than 15 nm,       levels. This indicates a reduction in NPF once deep convec-
which were in-situ-detected by means of condensation nu-       tion is prevalent together with the presence of mainly liquid-
clei (CN) counter techniques. NPF fields in clear skies as     origin ice particles. Within in situ cirrus near the cold point
well as in the presence of cloud ice particles (dp > 3 µm)     tropopause, recent NPF or intense events with mixing ration
were encountered at upper troposphere–lowermost strato-        nnm larger than 5000 mg−1 were observed only in about 6 %
sphere (UTLS) levels and within the Asian monsoon anti-        of the in-cloud NPF data. In determining whether the cloud-
cyclone (AMA). NPF-generated nucleation-mode particles         internal NPF is attenuated or prevented by the microphysical
in elevated concentrations (Nnm ) were frequently found to-    properties of cloud elements, the integral radius (IR) of the
gether with cloud ice (in number concentrations Nice of up     ice cloud population turned out to be indicative. Neither the
to 3 cm−3 ) at heights between ∼ 11 and 16 km. From a to-      number of ice particles nor the free distance between the ice
tal measurement time of ∼ 22.5 h above 10 km altitude, in-     particles is clearly related to the NPF rate
                                                                                                           detected.
                                                                                                                     While the
cloud NPF was in sum detected over ∼ 1.3 h (∼ 50 % of                                                       dm
                                                               increase in ice particles’ mass per time dt is proportional
all NPF records throughout StratoClim). Maximum Nnm of         to the IR and mainly due to the condensation of water vapour,
up to ∼ 11 000 cm−3 was detected coincidently with inter-      additional condensation of NPF precursors proceeds at the
mediate ice particle concentrations Nice of 0.05–0.1 cm−3      expense of the NPF rate as the precursor’s saturation ratio
at comparatively moderate carbon monoxide (CO) contents        declines. Numerical simulations show the impact of the IR
of ∼ 90–100 nmol mol−1 . Neither under clear-sky nor dur-      on the supersaturation of a condensable vapour, such as sul-
ing in-cloud NPF do the highest Nnm concentrations corre-      furic acid, and furthermore illustrate that the IR of the cloud
late with the highest CO mixing ratios, suggesting that an     ice determines the effective limitation of NPF rates.
elevated pollutant load is not a prerequisite for NPF. Under
clear-air conditions, NPF with elevated Nnm (> 8000 cm−3 )

Published by Copernicus Publications on behalf of the European Geosciences Union.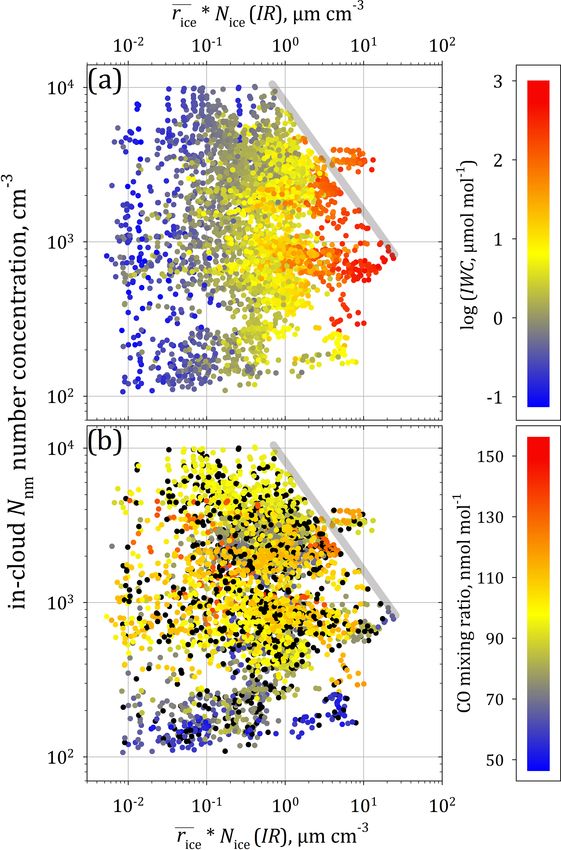
13456                                  R. Weigel et al.: In situ observation of NPF in the tropical tropopause layer – Part 2

1   Introduction                                                   tion at different temperatures, i.e. at varying supersaturation
                                                                   ratios, which are specific but mostly unknown, with respect
The process of gas-to-particle conversion, also denoted as         to the system of nucleating substances (involving H2 SO4 ,
homogeneous aerosol nucleation and most commonly known             H2 O, and NH3 ). The complexity increases with sulfuric acid
as new particle formation (NPF), is a major source of atmo-        nucleation systems involving besides NH3 also nitric acid
spheric aerosols and cloud condensation nuclei, which could        (HNO3 ) (Wang et al., 2020) or oxidised organic vapours
promote the cloud formation at intermediate and upper tro-         (Riccobono et al., 2014), all of which are reported as pro-
pospheric altitudes (e.g. Spracklen et al., 2006; Merikanto et     moting NPF at supersaturations lower than required for pure
al., 2009; Dunne et al., 2016; Gordon et al., 2017). Sulfuric      H2 SO4 solutions. The role of organic substances in connec-
acid (H2 SO4 ) and water (H2 O) are important chemical com-        tion with NPF is of particular importance in the tropical up-
pounds involved in the NPF process, which is aided when            per troposphere–lowermost stratosphere (UTLS), as has been
ions come into play at elevated altitudes and cold tempera-        indicated by Schulz et al. (2018) and Andreae et al. (2018).
tures within the atmosphere (Lee et al., 2003; Kazil et al.,       The influence of a third substance (or even more substances)
2008; Weigel et al., 2011; Duplissy et al., 2016). It was sug-     possibly involved in the NPF process is not conclusively de-
gested that a ternary nucleation process involves, apart from      tectable or quantifiable in the nucleation-mode particle pop-
sulfuric acid and water, an additional constituent such as am-     ulation due to the current lack of instrumentation capable of
monia (NH3 ; Ball et al., 1999; Benson et al., 2009; Höpfner       directly analysing the chemical composition of such small
et al., 2019). Experimental studies at the CLOUD (Cosmics          particles.
Leaving OUtdoor Droplets) chamber confirmed that NPF                  By means of ground-based as well as airborne in situ mea-
rates are substantially elevated within this ternary H2 SO4 –      surements, NPF was frequently observed to occur at various
H2 O–NH3 system (e.g. Kirkby et al., 2011; Kürten et al.,          conditions and atmospheric altitudes (Kerminen et al., 2018).
2016; Kürten, 2019). In addition to sulfuric acid and ammo-        Recently, Williamson et al. (2019) compiled a comprehen-
nia, organic species (e.g. Metzger et al., 2010; Kerminen et       sive data set of in situ NPF observations at altitudes from
al., 2010) or amines (Kürten et al., 2018) may also promote        180 m above sea level to up to ∼ 12 km, thereby covering
particle nucleation and growth. Considering the quantities of      a latitude range from 80◦ N to 70◦ S alongside the Amer-
organic aerosols (Murphy et al., 2006) and ammonia species         icas and probing air over both oceans, the Pacific and the
(Höpfner et al., 2019) that were frequently found in aerosol       Atlantic. In tropical regions, most of the in situ NPF ob-
particles at upper troposphere (UT)–tropical transition layer      servations were made below the level of zero net radiative
(TTL) heights in the AMA during StratoClim 2017, NPF is            heating, i.e. at altitudes where subsidence or cloud forma-
likely promoted by such species in the UT and TTL region.          tion is still well capable of efficiently removing or scav-
   The results of individual CLOUD experiments (Kürten et          enging aerosol particles. Investigations at high altitudes (i.e.
al., 2015, 2016) under a variety of controlled conditions and      > 12 km) concerning the occurrence of NPF within clouds
at different and elevated concentrations of the H2 SO4 so-         or in their immediate vicinity are sparse; most of such ob-
lution, always at supersaturated states, show how strongly         servations are limited to tropospheric altitudes (e.g. Clarke
the nucleation rates are associated with the precursor con-        and Kapustin, 2002). The region above tropospheric clouds
centrations. The time series of a nucleation event within the      seems favourable for NPF to occur, and possible reasons for
CLOUD chamber (supplementary material of Kirkby et al.,            this are discussed by Wehner et al. (2015). They found that
2011) shows that the nucleation rate remains elevated as long      the majority of their near-cloud NPF observations correlated
as the quantity of precursors is kept at a constant level. Under   with increased ultraviolet irradiance, so they concluded cloud
real conditions in the atmosphere, however, the concentra-         edges to be a favourable environment for the production of
tion of precursor material is spatially and temporally highly      precursor gases for the formation of new particles (Wehner et
variable (e.g. Speidel et al., 2007; Ranjithkumar et al., 2021;    al., 2015). These authors argued that nucleation and particle
Höpfner et al., 2019). Besides the precursor gas abundance,        growth are promoted by turbulence at the cloud edges, which
temperature determines the degree of supersaturation, which        also Radke and Hobbs (1991) already observed coincidently
implies that even high precursor concentrations can yield          with abundant particles at increased relative humidity. Fur-
weak NPF rates. Additionally, also temperature fluctuations        thermore, NPF was found to be an important process inside
at any (low) precursor concentration can increase the local        the convective outflows (e.g. Twohy et al., 2002; Waddicor
supersaturation and induce intense NPF (see Weigel et al.,         et al., 2012). From measurements in the upper troposphere it
2021).                                                             is commonly assumed that the occurrence of NPF is directly
   For ternary or multi-component NPF, the degree of su-           connected to deep-convective cloud systems (e.g. de Reus et
persaturation as a function of temperature remains indeter-        al., 2001; Clarke and Kapustin, 2002; Weigelt et al., 2009;
minable if the respective concentration of the different sub-      Andreae et al., 2018). The relationship between NPF and ice
stances is unknown as so far is the case for most atmospheric      clouds is discussed in this study, whilst the immediate con-
observations. The chamber experiments allow for studying           nection of NPF and deep-convective events is addressed in
the nucleation rate as a function of the precursor concentra-      Weigel et al. (2021).

Atmos. Chem. Phys., 21, 13455–13481, 2021                                          https://doi.org/10.5194/acp-21-13455-2021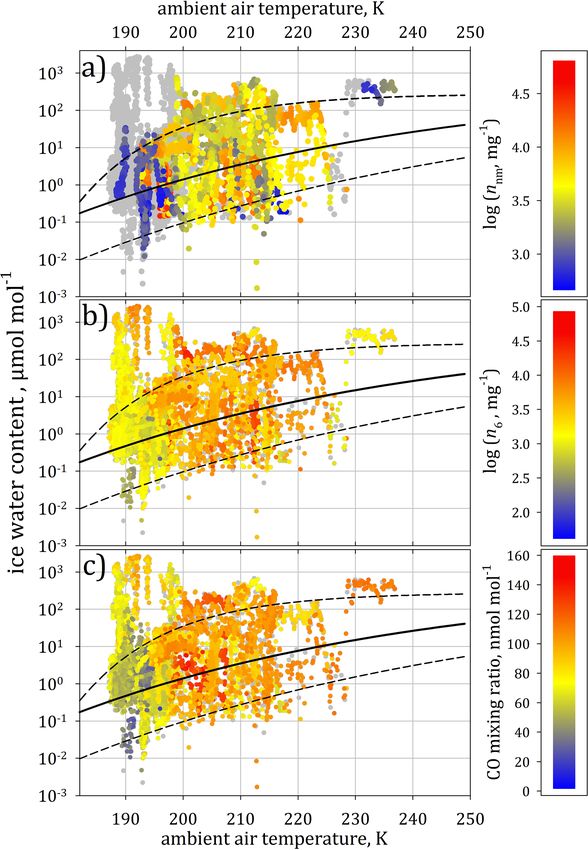
R. Weigel et al.: In situ observation of NPF in the tropical tropopause layer – Part 2                                      13457

   During in situ measurements aboard the NASA high-                     a. Are the nucleation-mode particles dispersed as a
altitude research aircraft WB-57, Lee et al. (2004) ob-                     contribution to the clear-air background aerosol as
served nucleation events inside subtropical and tropical cir-               soon as the cloud elements evaporate?
rus clouds between 7 and 16 km over Florida. The same au-                b. Or are the nucleation-mode particles scavenged by
thors summarise that they found the recent occurrence of                    present ice particles?
NPF in 72 % of their measurements within clouds. Despite
the conceptual notion that the presence of cloud elements          A comprehensive understanding of these relationships and
generally inhibits the formation of new particles, Kazil et        their influences under real atmospheric conditions is neces-
al. (2007) demonstrated by means of model simulations that         sary, particularly for modelling purposes. Such insights al-
new sulfate aerosol can form within ice clouds such as cir-        low for narrowing down the cloud type and properties as
rus. New particles are also produced in the anvil region and       well as the location in the cloud where NPF preferentially
cirrus decks of mesoscale convective systems (MCSs) over           occurs in order to obtain estimates of the importance of NPF
West Africa (Frey et al., 2011). The particular role of mid-       in the cloud. In the context of the Asian monsoon anticy-
latitude MCSs as a source of freshly formed aerosol within         clone (AMA) it is important to clarify the origin of observed
the upper troposphere was already suggested by Twohy et            aerosol enhancements in the embedded Asian tropopause
al. (2002), based on the detection of increased concentra-         aerosol layer (ATAL; cf. Vernier et al., 2011 and Vernier et
tions of particles with size diameter (dp ) greater than 25 nm,    al., 2018). NPF is an important source of aerosol particles
concurrently with elevated particle volatility. In the region of   which are then available for further processing to form the
the tropical transition layer (TTL) over South America, Aus-       ATAL (Höpfner et al., 2019; He et al., 2019; Mahnke et al.,
tralia, and West Africa, the in situ measurements by Weigel        2021). Furthermore, the relative contribution of in-cloud ver-
et al. (2011) revealed nucleation-mode particles in elevated       sus clear-air NPF is of importance in this context.
number concentrations from recent NPF. Based on coinci-               The Asian monsoon anticyclone (AMA) is a meteorolog-
dent detections of abundant nucleation-mode particles to-          ical structure, which determines the regional circulation in
gether with cloud elements (i.e. ice particles of diameters        the UTLS between June and September. The AMA is associ-
2.7 µm < dp < 1.6 mm) at ice number concentrations always          ated with extensive deep convection capable of transporting
below ∼ 2 cm−3 , the authors concluded that the occurrence         polluted air from the regional boundary layer (BL) to high
of NPF is mainly limited by the number of cloud particles.         altitudes (e.g. Randel and Park, 2006; Park et al., 2007; Vo-
The underlying notion is that the surfaces of the cloud el-        gel et al., 2014, 2019). The vertical upward transport within
ements either scavenge the NPF-produced aerosol particles          the Asian monsoon circulation is an effective pathway for
or remove the nucleating vapour molecules prior to the NPF         young air from the BL (Vogel et al., 2019) to UTLS altitudes,
process.                                                           accompanied by pollutants, further gaseous material (Pan et
   Regarding the occurrence of NPF in conjunction with the         al., 2016), and water vapour (Ploeger et al., 2013). The con-
presence of upper tropospheric ice clouds, several unspeci-        stituents of the uplifted young air from BL altitudes also
fied details remain.                                               comprise precursor material from anthropogenic (Vernier et
                                                                   al., 2015; Yu et al., 2015; Höpfner et al., 2019; Mahnke et
 1. What are the sets of chemical species acting as NPF pre-       al., 2021) and other sources to develop and maintain the ob-
    cursors?                                                       served ATAL.
                                                                      This study reports on the frequent occurrence of NPF in
 2. Does NPF require (or not) contributions by cosmic ra-          the presence of cloud ice in the tropopause region over the
    diation, by ions (Lovejoy et al., 2004; Kazil et al., 2008;    Indian subcontinent during the Asian monsoon season of
    Weigel et al., 2011), or by chemical agents or catalysts       the year 2017. All measurement data shown herein were
    (e.g. Kürten, 2019)?                                           acquired during StratoClim (in July/August 2017) based in
                                                                   Kathmandu, Nepal, and conducted with the M-55 Geophys-
 3. Which are the advantageous thermodynamic conditions            ica that operates up to 20 km altitude. NPF was observed to
    for NPF within a cloud?                                        an almost equivalent extent in clear air as well as in the midst
                                                                   of cloud ice particles. This investigation summarises the var-
 4. What are the conditions under which NPF is suppressed          ious conditions under which NPF was observed coincidently
    by the presence of ice particles of certain size and/or        with cloud ice particles. The caveats limiting the magnitude
    number?                                                        of encountered NPF are examined, as are the possibly con-
                                                                   straining mechanisms imposed by the cloud elements’ micro-
 5. What are the relative contributions from clear-air or in-      physical properties. The frequency of NPF observations in
    cloud NPF to the aerosol population in the UTLS?               coincidence with elevated ice particle densities as well as in
                                                                   clear air highlights the importance of the tropopause region
 6. Furthermore, it is of interest how the nucleation-mode         within the AMA as an effective source region of aerosols.
    particles from in-cloud NPF are processed:

https://doi.org/10.5194/acp-21-13455-2021                                        Atmos. Chem. Phys., 21, 13455–13481, 2021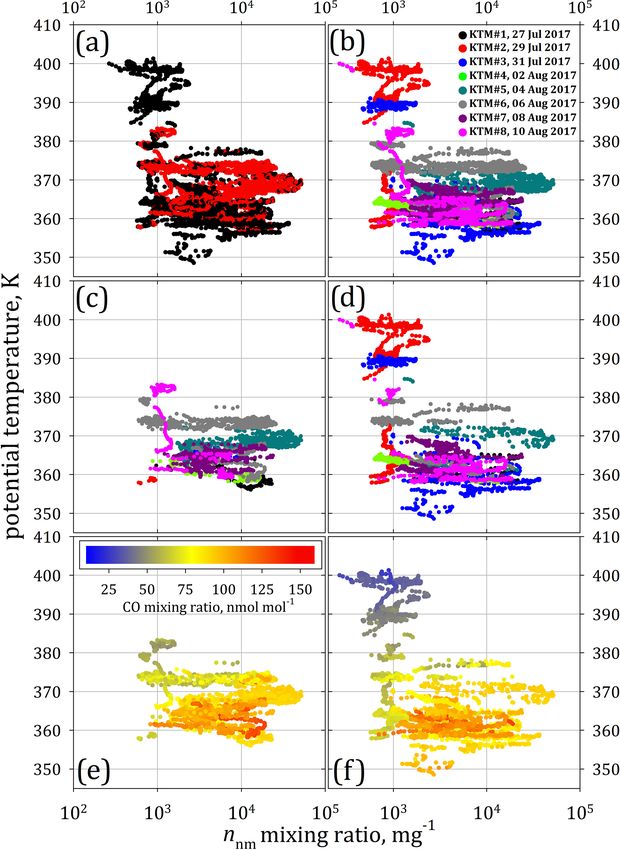
13458                                  R. Weigel et al.: In situ observation of NPF in the tropical tropopause layer – Part 2

2     The StratoClim field campaign, instruments, and              as Nnm ) is calculated from the difference N6 − N15 = N6−15 .
      methods                                                      This concentration of nucleation-mode particles indicates re-
                                                                   cent NPF if the designated NPF criterion (Eq. 1) is met:
During the Asian monsoon season, between 27 July and
10 August 2017, a total of eight scientific flights were con-      0.8 · N6 − 1.2 · N15 > 0.                                  (1)
ducted above parts of the Indian subcontinent, out of Kath-
mandu, Nepal (27◦ 420 300 N, 85◦ 210 4200 E), throughout Strato-   This criterion was reassessed for the StratoClim 2017 data
Clim 2017 (see Fig. 1). Some of these flights also led out of      set and accounts for the COPAS detectors’ signal-to-noise
the Nepalese airspace, to eastern India and Bangladesh, and        ratio and the counting statistics. Further details concerning
to the northernmost part of the Bay of Bengal. The occur-          the criterion and the corrections applied to COPAS data are
rence of NPF was encountered (see Fig. 1) during each flight,      provided in Weigel et al. (2021).
either in clear air or in the presence of cloud (ice) particles.      If compliant with the NPF criterion, a series of data points
                                                                   is a designated NPF event if measured number concentra-
2.1    Number concentration of sub-micrometre-sized                tions (or mixing ratios) of nucleation-mode particles contin-
       particles                                                   uously remain greater than zero over at least 5 consecutive
                                                                   seconds. The term NPF event duration refers to the contigu-
The four-channel continuous flow condensation particle             ous and uninterrupted measurement time (the sum of con-
counter COPAS (COndensation PArticle counting System;              secutive measurement seconds) for which the definition of
Weigel et al., 2009) was used for measuring aerosol parti-         in-cloud NPF applies. Due to the detector’s signal-to-noise
cle number concentrations. Particle detection and data stor-       ratio and counting statistics, the given quantity and durations
age occurred at 1 Hz frequency. The COPAS channels were            of events that are too short (over 1–5 s) bear uncertainties in
set to different 50 % detection particle diameters dp50 (i.e.      the resulting number concentrations of newly formed parti-
6, 10, and 15 nm). By counting aerosols (with dp50 = 10 nm)        cles and the event duration. With the mean airspeed of the
downstream of a heated (∼ 270 ◦ C) sample flow line, a fourth      M-55 Geophysica (∼ 154 ± 39 m s−1 ), the event definition
COPAS channel measured particle concentrations of non-             implies that within 5 s a horizontal distance of ∼ 770 m (in
volatile (nv) or refractory particles (e.g. soot, mineral dust,    flight direction) is covered. The total of 308 individual de-
and metallic aerosol material as well as, for example, organic     tections of elevated Nnm coincide with the presence of cloud
material mixtures not evaporating at 270 ◦ C). The measured        elements, 104 of which fulfilled the event criterion. Note that
data revealed that potential artefacts on the aerosol measure-     the in-cloud NPF events discussed herein are partially em-
ments due to the presence of ice particles, as suggested by        bedded in larger NPF fields, which are identified by succes-
Williamson et al. (2019), are largely excludable for the Stra-     sive and uninterrupted detections of elevated Nnm . One or
toClim data set (see Appendix A). For further details on the       more in-cloud NPF events can be subsets of widespread NPF
operation of COPAS during StratoClim 2017, the companion           events as those discussed by Weigel et al. (2021), where also
paper (Weigel et al., 2021) provides further insights, as does     further details are provided concerning the persistence of the
the article with the technical introduction and characterisa-      freshly formed particles in the nucleation mode and the pres-
tion of the COPAS device, the aerosol inlet system, and the        ence of non-volatile particles under NPF conditions during
particle vaporiser (Weigel et al., 2009). COPAS is an estab-       StratoClim 2017.
lished instrument for high-altitude application, and its data         The NPF rate and, hence, the intensity of NPF vary with
were used and discussed in various studies (e.g. in Curtius et     the degree of supersaturation of the NPF precursor (Kirkby
al., 2005; Borrmann et al., 2010; Frey et al., 2011; Weigel et     et al., 2011; Kürten et al., 2016). For the StratoClim 2017
al., 2011, 2014; Schumann et al., 2017; Höpfner et al., 2019).     data set the strength of an NPF event is classified as
                                                                    1. intense NPF (often used synonymously with most recent
2.2    Terminology and notations                                       NPF) if detected aerosol densities of nucleation-mode
                                                                       particles exceed
Measured particle number concentrations N are provided in
units of particle number per cubic centimetre of sampled air              – mixing ratios of 10 000 mg−1 or
(ambient conditions). To compare aerosol observations from                – number concentrations of 5000 cm−3 ;
different pressure altitudes and, for example, for correlations
with mixing ratios of trace gases, COPAS measurements are           2. intermediate NPF when number densities of nucleation-
also given as mixing ratio n in units of particles per milligram       mode particles are in the ranges of
of air (mg−1 ) as calculated based on the 1 Hz resolved data of
ambient static pressure and temperature (see Sect. 2.5). With             – mixing ratios of 1000 mg−1 < nnm < 10 000 mg−1
N6 (N15 ) as the number concentration of sub-micrometre-                    or
sized particles with diameter greater than 6 nm (15 nm), the              – number concentrations Nnm between 500 and
number concentration of nucleation-mode particles (denoted                  5000 cm−3 ; and

Atmos. Chem. Phys., 21, 13455–13481, 2021                                          https://doi.org/10.5194/acp-21-13455-2021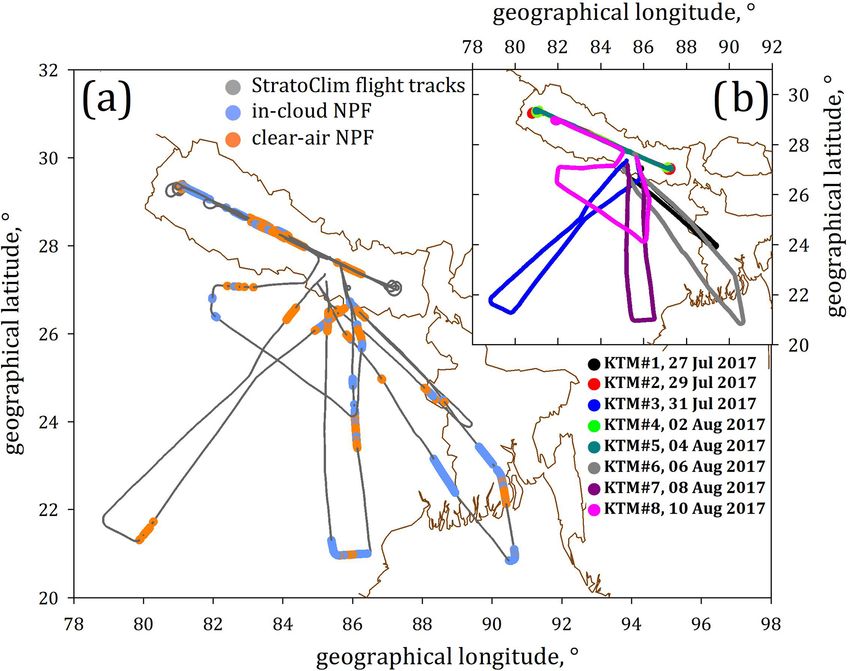
R. Weigel et al.: In situ observation of NPF in the tropical tropopause layer – Part 2                                                 13459

Figure 1. The flight patterns of the M-55 Geophysica during StratoClim 2017 over the Indian subcontinent. New particle formation (NPF)
encountered in clear air along the flight tracks is indicated by orange colour in the main panel (a). All NPF events coinciding with the
detection of cloud (ice) particles are coloured in blue. The general perspective (b) exhibits the patterns of the eight StratoClim flights over
Nepal, north-eastern India, Bangladesh, and the Bay of Bengal. For more details, see Table 1.

  3. weak NPF when                                                        delivers microphysical properties, in terms of size and num-
                                                                          ber, of particles with diameters ranging from 0.61 to 937 µm.
       – mixing ratios nnm remain below 1000 mg−1 , or                    The methods of post-flight data processing and corrections
       – number concentrations Nnm of less than 500 cm−3                  were described by Luebke et al. (2016).
         are detected.                                                       In the StratoClim 2017 data set, cloud particle detections
                                                                          were recognised as such when particles of diameters > 3 µm
As the persistence of the particles in the nucleation mode is             were encountered in numbers greater than zero. The num-
short (i.e. a few hours only due to coagulation; cf. Weigel               ber concentration of ice particles is denoted as Nice (i.e.
et al., 2021), an intense NPF event could still be in process             N3–937 µm for the number concentration of ice particles with
when observed, or it had expired recently, i.e. 1–2 h prior to            diameters of 3 µm < dp < 937 µm). The data of ice water con-
the detection. For NPF encounters with low or intermediate                tent (IWC) used herein were ascertained by using the re-
nnm (or Nnm ), the conclusions concerning the event’s age                 lationship of cloud particles’ mass (mp ) to diameter (dp )
remain ambiguous since they can result from a proceeding                  (Krämer et al., 2016; Luebke et al., 2016; Afchine et al.,
event with a low NPF rate or from an event that had expired               2018).
several hours previously.                                                    The closed-path Lyman-α photo-fragment fluorescence
                                                                          hygrometer FISH (Fast In situ Stratospheric Hygrometer;
2.3   Cloud particle and water vapour detection                           cf. Zöger et al., 1999; Meyer et al., 2015) allows for
                                                                          1 Hz resolved measurements of the atmosphere’s gaseous-
The NIXE-CAPS (New Ice eXpEriment: Cloud and Aerosol                      and solid-phase water, denoted as total water or H2 Otot .
Particle Spectrometer, in the following denoted as NIXE)                  The FISH detection of H2 Otot covers mixing ratios of 1–
was deployed during StratoClim for measuring the num-                     1000 µmol mol−1 over atmospheric pressures ranging from
ber size distribution in the cloud particles’ diameter size               50 to 500 hPa with an accuracy and precision of 6 %–
range of 3–930 µm with 1 Hz resolution (Luebke et al., 2016;              8 % and 0.3 µmol mol−1 . The IWC was calculated by sub-
Costa et al., 2017; Afchine et al., 2018). The NIXE-CAPS                  tracting the H2 OGas (measured by another Lyman-α detec-
consist of two detectors: the NIXE-CAS-DPOL (Cloud and                    tor, FLASH, the FLuorescent Airborne Stratospheric Hy-
Aerosol Spectrometer with Detection of POLarization) and                  grometer) from H2 Otot . For further details concerning the
the NIXE-CIPg (Cloud Imaging Probe – grayscale). The                      data processing, see Afchine et al. (2018). Dependent on
compiled measurement data of both independent detectors

https://doi.org/10.5194/acp-21-13455-2021                                                 Atmos. Chem. Phys., 21, 13455–13481, 2021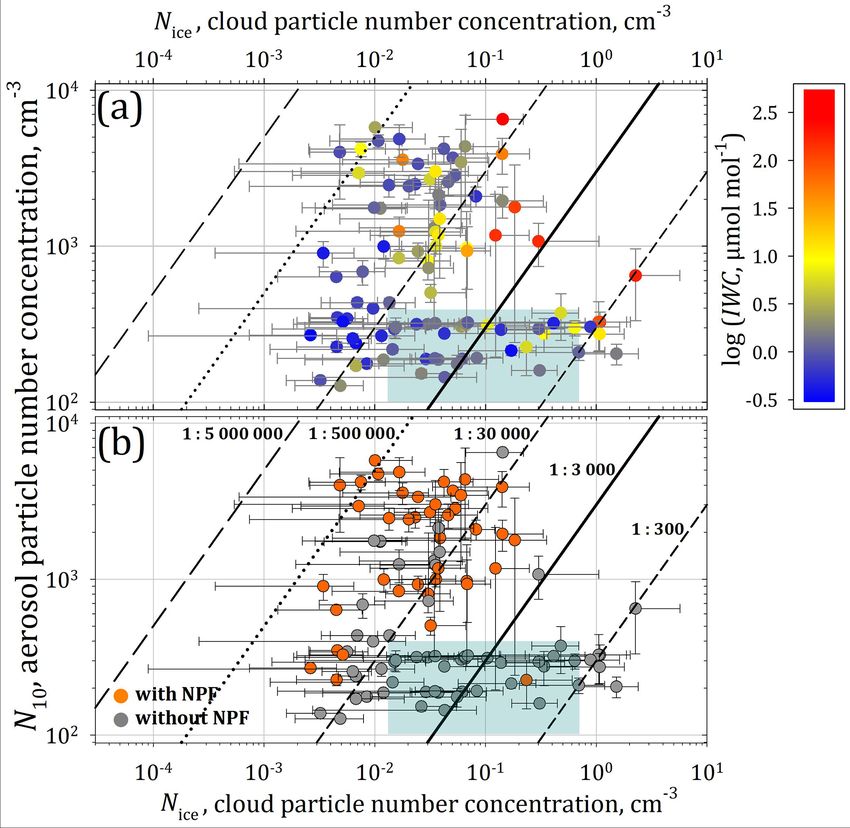
13460                                R. Weigel et al.: In situ observation of NPF in the tropical tropopause layer – Part 2

ambient temperatures, the smallest IWC detectable by the        given vertical temperature gradients and over the θ range
FISH instrument is approximately between 1 × 10⁻³ and           covered during StratoClim 2017 (i.e. up to ∼ 477 K), the
20 × 10−3 µmol mol−1 , which corresponds to approximately       WMO-recommended calculation of θ differs only by up to
1–20 × 10−4 mg m−3 (Afchine et al., 2018).                      ∼ 1 K from the values obtained by using the recently reap-
  To cover the wide range of IWC observed during the            praised θ calculation (Baumgartner et al., 2020).
StratoClim mission (from thousandths to thousands of
µmol mol−1 ) the complementary data sets of NIXE-CAPS
and FISH concerning IWC were merged (see Krämer et al.,         3     Observations and results
2020).
                                                                During StratoClim 2017, eight mission flights were con-
2.4   Carbon monoxide                                           ducted with a total of 36.6 flight hours, whereas over a to-
                                                                tal of 6.42 h ice clouds were encountered at air tempera-
In the troposphere, carbon monoxide (CO) is a component of
                                                                tures colder than 240 K. The cirrus cloud observations are
atmospheric pollution (Park et al., 2009), the main sources
                                                                described and discussed by Krämer et al. (2020). Most of
of which are both natural and anthropogenic (including com-
                                                                the in-cloud measurements during StratoClim 2017 were per-
bustion and the oxidation of hydrocarbons). Measured CO
                                                                formed at temperatures . 205 K, corresponding to potential
mixing ratios are often used as a dynamic tracer for air
                                                                temperatures above ∼ 355 K and geometric altitudes higher
parcel transport. Typical CO mixing ratios range from un-
                                                                than ∼ 12 km. The clouds observed during the Asian mon-
polluted 50 nmol mol−1 up to mixing ratios well exceeding
                                                                soon season include (1) in situ cirrus, which had formed in
700 nmol mol−1 in close vicinity of emission sources (Cler-
                                                                dynamically calm situations associated with very slow up-
baux et al., 2008; Park et al., 2009). Inside the AMA and
                                                                draught, as well as (2) liquid-origin cirrus, the formation of
up to 15 km altitude, CO mixing ratios remain comparatively
                                                                which is connected to deep (including overshooting) convec-
high (100 nmol mol−1 ), while between 15 and 20 km alti-
                                                                tion with elevated uplift velocities (see Sect. 5.2), including
tude the CO mixing ratios decrease monotonically down to
                                                                ice clouds (e.g. anvils) associated with convective outflow.
∼ 40 nmol mol−1 (Park et al., 2009).
                                                                   At temperatures colder than 205 K, Nice and IWC often
   During the StratoClim mission, the mixing ratio of CO
                                                                reached values above their respective median of 0.031 cm−3
was measured by means of the tunable diode laser (TDL)
                                                                (dashed blue line in Fig. 2c) and ∼ 0.2–2 µmol mol−1 (see
technique implied in the revised version of the cryogenically
                                                                Fig. 6). The highest observed IWC values at these tempera-
operated laser diode (COLD) spectrometer. Compared to the
                                                                tures reach up to 1000 µ mol mol−1 with a maximum Nice as
previous instrument version (4 s temporal resolution; Viciani
                                                                high as 30 cm−3 . Moreover, the ice crystal sizes (not shown
et al., 2008), COLD-2 integrates improvements (Viciani et
                                                                here) exceed their corresponding median; hence, compara-
al., 2018) regarding
                                                                tively large ice crystals were found up to and around the cold
 1. a measurement resolution increased by a factor of 4,        point tropopause. Such large particles were detected during
                                                                flights in strong convection.
 2. an enhanced in-flight sensitivity of the COLD-2 spec-
    trometer (ranking at ∼ 2 nmol mol−1 at integration          3.1    The distribution of NPF and the presence of cloud
    times of 1 s), and                                                 ice particles over daytime
 3. an accuracy of 3 % specified for the CO measurement         During a total of ∼ 22.5 h of COPAS measurement time at
    with COLD-2.                                                altitudes above ∼ 10 km (θ & 350 K) a total duration of 2 h
In the data set of simultaneous measurements of COPAS and       and 38 min was spent under NPF conditions in the TTL re-
COLD-2, minimum and maximum CO mixing ratios of 14              gion (∼ 11–17.5 km, ∼ 355–400 K; see Weigel et al., 2021).
and 153 nmol mol−1 are included.                                Throughout the StratoClim 2017 mission, elevated number
                                                                densities of nucleation-mode particles were observed coin-
2.5   Data of ambient temperature and static pressure           cidently with cloud particles (Nice > 0 cm−3 ) over a total
                                                                of about 1 h and 17 min (see Table 1). The encountered in-
The atmospheric temperature and pressure data were taken        cloud NPF events at altitudes between approximately 11 and
from the Unit for Connection with the Scientific Equipment      16.5 km (∼ 355–385 K) had a mean event duration of 14.5 s
(UCSE; Sokolov and Lepuchov, 1998), a part of the naviga-       (ranging from 1 s to a maximum of about 300 s; median du-
tional system of the M-55 Geophysica. UCSE data are pro-        ration: 2 s).
vided as 1 Hz resolved ambient pressure (with an accuracy of       In Fig. 2, all NPF detections throughout the StratoClim
±1 hPa) and temperature (±2 K accuracy).                        mission are compiled in a 1 d time series. The range of this
   The potential temperature θ is calculated with 1 Hz reso-    time series is limited to the schedules of the eight mission
lution in compliance with the definition by the World Me-       flights between 03:30 and 12:30 UTC, corresponding to lo-
teorological Organization (WMO, 1966). Note that for the        cal times of 09:15 to 18:15 LT. The encounter of NPF is

Atmos. Chem. Phys., 21, 13455–13481, 2021                                       https://doi.org/10.5194/acp-21-13455-2021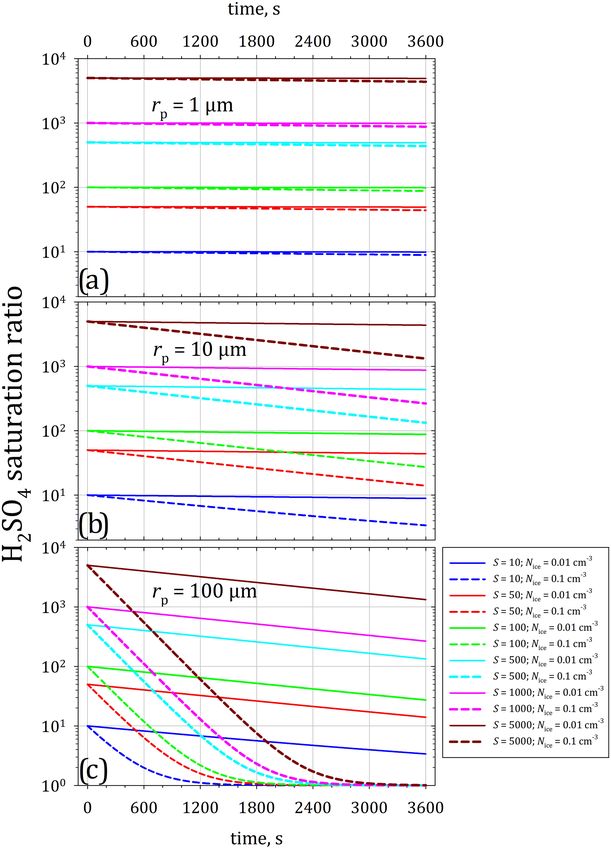
R. Weigel et al.: In situ observation of NPF in the tropical tropopause layer – Part 2                                             13461

Figure 2. Number concentrations (1 Hz resolved) of aerosol particles in the nucleation-mode size range (Nnm ) and of cloud (ice) particles
(Nice ) of the eight StratoClim flights compiled in one time series ranging from 03:30 to 12:30 UTC. Kathmandu’s (Nepal) local noontime
is indicated by the vertical orange line (corresponding to 06:15 UTC, or 22 500 s of the day; UTC). (b) Incidences of concentrations Nnm
exceeding 500, 1000, and 5000 cm−3 within 15 min time intervals. Data points of Nnm in black whenever Nice (cyan) equals zero; other-
wise Nnm is coloured in red. The dashed blue line (c) indicates the median of Nice (0.031 cm−3 ) over all cloud particle detections during
StratoClim 2017 (Krämer et al., 2020).

Table 1. NPF data set of StratoClim 2017, separated by event detection under clear-air (i.e. Nice = 0 cm−3 ) and in-cloud conditions (i.e.
Nice > 0 cm−3 ). Discussed in-cloud NPF events (104 incidents that comply with introduced NPF criterion; Sect. 2.2) are partially embedded
in larger clear-air NPF fields with continuously elevated Nnm . The total number of measurement seconds with NPF detections under either
of both conditions is scaled to the total data set of the condensation nuclei (CN) measurements and the total duration of NPF encounters.
The mean horizontal distance is calculated from the event duration based on a mean flight speed of the M-55 Geophysica (154 ± 39 m s−1 ),
providing an equivalent horizontal extension of NPF. Geometric heights are interpolated values with maximum range of scattering from
UCSE data of the eight flights.

                          NPF             Total duration             Percentage of                  Mean horizontal
                          condition    Seconds     hh:mm        NPF data    Total data set     distance in kilometres
                          Clear air        4866       01:21     ∼ 51.2 %         ∼ 5.3 %                      ∼ 750
                          In cloud         4634       01:17     ∼ 48.8 %         ∼ 5.0 %                      ∼ 714

                                                                       In-cloud NPF
                      Potential       Geometric            Total duration      Percentage of            Mean horizontal
                      temperature     altitude          Seconds      hh:mm     in-cloud NPF       distance in kilometres
                      355–360 K       ∼ 11 ± 2.5 km            432    00:07           ∼ 9.3 %                      ∼ 67
                      360–365 K       ∼ 13.5 ± 2 km           1231    00:21          ∼ 26.6 %                     ∼ 190
                      365–370 K       ∼ 15.3 ± 1 km           1455    00:24          ∼ 31.4 %                     ∼ 224
                      370–375 K       ∼ 15.8 ± 1 km           1375    00:23          ∼ 29.7 %                     ∼ 212
                      > 375 K         ' 16.0 km                141    00:02             ∼3%                        ∼ 22

https://doi.org/10.5194/acp-21-13455-2021                                                    Atmos. Chem. Phys., 21, 13455–13481, 2021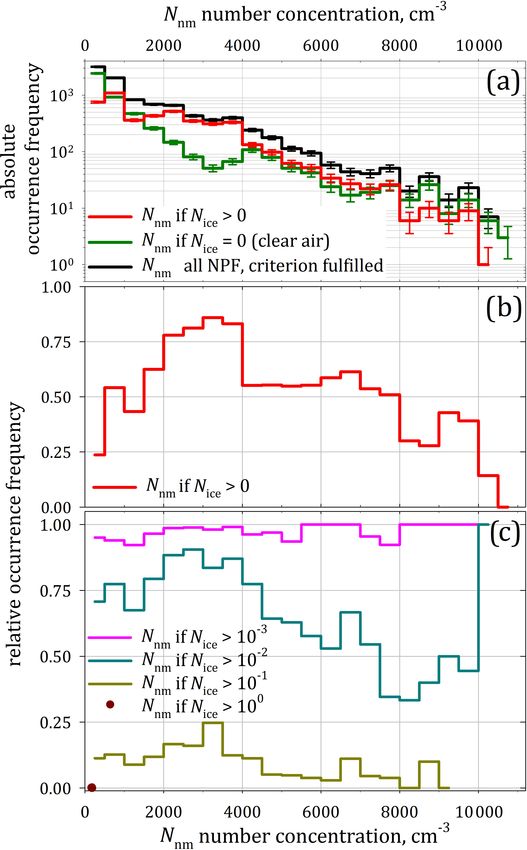
13462                                  R. Weigel et al.: In situ observation of NPF in the tropical tropopause layer – Part 2

considered to be a clear-air observation (black data points         acteristic of only in-cloud NPF, as is discussed in more detail
in Fig. 2) when cloud (ice) particle number concentration           in Weigel et al. (2021). During in-cloud NPF, the highest den-
Nice remained at 0 cm−3 . Coincident observations of NPF            sities of nucleation-mode particles were observed at moder-
and cloud (ice) particles (Nice > 0 cm−3 ) are highlighted by       ate CO mixing ratios of ∼ 90–100 nmol mol−1 . In air masses
red points in Fig. 2a and c. The number of in-cloud NPF             with the lowest CO content (∼ 40–60 nmol mol−1 ), NPF was
encounters exceeding different thresholds of measured par-          observed only above the tropopause (θ > 380 K) and in the
ticle number concentration Nnm (500, 1000, and 5000 cm−3 ;          absence of ice particles with nnm ranging from 300 mg−1 to
Fig. 2b) shows for StratoClim 2017 that the intense events          a maximum of 2000 mg−1 .
of in-cloud NPF occurred predominantly in the late morn-               The most intense NPF, i.e. with the highest densities of
ing, well before local noon. The incidences of in-cloud NPF         nucleation-mode aerosols, was found below the tropopause
accumulate in the later morning hours as well as in the lo-         (∼ 380 K). In the presence of ice particles (as in clear air),
cal afternoon. Temporal dependencies on daytime were not            intermediate nnm values were also encountered at CO mixing
observed for the occurrence, severity, or frequency of NPF.         ratios below ∼ 70 nmol mol−1 at potential temperatures of
                                                                    370–380 K. Under clear-air conditions, NPF occurred even
3.2   Vertical distribution of nucleation-mode particles            at much lower CO mixing ratios (mainly from measurements
      in presence or absence of cloud ice particles                 on 29 and 31 July), which is shown by the nnm vertical pro-
                                                                    file at altitudes above 385 K (Fig. 3f). According to Fig. 3,
Figure 3 displays the vertical distribution of NPF-generated        in-cloud NPF was predominantly found in an altitude band
nucleation-mode aerosols in terms of the mixing ratio nnm           between 355 and 385 K (corresponding to ∼ 9–16.5 km) with
as a function of potential temperature. Figure 3 a depicts the      nnm in the range of about 1000 to 50 000 mg−1 (∼ 500–
clear-air observations of elevated nnm (black) together with        11 000 cm−3 ). Thennm values of NPF in ice clouds generally
those when ice particles were coincidently detected (red).          do not differ from those of NPF under clear-sky conditions.
The coincident observation of ice particles and nucleation-
mode aerosols is vertically limited to a range of potential         3.3   Statistics of NPF events in the presence of ice
temperatures from 355 to 385 K (see also Table 1). Thereby,               particles
in-cloud NPF of intermediate strength was encountered to-
gether with convective overshooting up to altitudes above the       The frequency of NPF occurrence in coincidence with ice
mean tropopause height (∼ 380 K, averaged over the Stra-            particles is illustrated in Fig. 4. The upper panel (Fig. 4a) ex-
toClim 2017 period and area of operation). Further above            hibits the absolute frequency of occurrence of number con-
(above 385 K and up to ∼ 400 K) and at altitudes below              centrations Nnm observed during NPF events. The graphs
355 K, exclusively clear-air NPF was sampled. As already            compile all measurements (more than 4600 samples of 1 Hz
indicated by Fig. 2, also the vertical profiles in Fig. 3 suggest   resolved data; see Table 1) which comply with the NPF cri-
that the strength of NPF was largely independent from the           terion (black) for a comparison with clear-air NPF events
presence of cloud elements. The intermediate panels (c and          (green) and those which were coincidently detected with ice
d) in Fig. 3 show the StratoClim NPF data after their separa-       particles (red). At heights of in-cloud NPF observations (i.e.
tion into clear-air and in-cloud conditions. Figure 3c shows        between 355 and 385 K), the number concentrations of parti-
that in-cloud NPF observations were made during each of the         cles larger than the nucleation mode, i.e. N15 and N65 , were
eight mission flights (see Fig. 1). During the first four flights   in the range (by median) of ∼ 200 cm−3 < N15 < 1000 cm−3
(from 27 July through 2 August) no in-cloud NPF was found           (COPAS) and ∼ 60 cm−3 < N65 < 150 cm−3 (from measure-
above 365 K since deep convection occurred more sparsely            ments with the modified ultra-high-sensitivity aerosol spec-
in the first half of the StratoClim mission period than in the      trometer, UHSAS; Mahnke et al., 2021). Two features are
second half (Bucci et al., 2020). During the second half of         apparent:
the mission flights (4 to 10 August), the frequency and the
spatial extent of in-cloud NPF events were increased.                 1. Number concentrations Nnm of more than ∼ 8000 cm−3
   The comparison of CO mixing ratios and NPF occur-                     seem to be observed more frequently (about 1.5 times
rence in the tropical UTLS over West Africa (Weigel et al.,              more often) in clear-air conditions. As the number of in-
2011) suggested a link between NPF rate and ground-level                 cloud NPF observations with Nnm > 8000 cm−3 is com-
sources of NPF precursors. These precursors (likely sulfur               parably low (≤ 10 encounters), the statistics are likely
compounds, possibly also organics) are thought to be effi-               insufficient for drawing further conclusions from this. It
ciently lifted into the TTL region by convection and not com-            is discussed in Sect. 6 whether the presence of cloud ice
pletely removed by scavenging. NPF should most frequently                constrains the chance to detect very recent NPF (result-
occur in air enriched with precursor material and which ex-              ing in high Nnm ).
perienced vertical uplift. According to Fig. 3e and f, neither
clear-air nor in-cloud NPF exhibits nnm maxima coincidently           2. For NPF in the presence of cloud ice, number con-
with the highest CO mixing ratios. This is not a typical char-           centrations Nnm between 1500–4000 cm−3 were ob-

Atmos. Chem. Phys., 21, 13455–13481, 2021                                           https://doi.org/10.5194/acp-21-13455-2021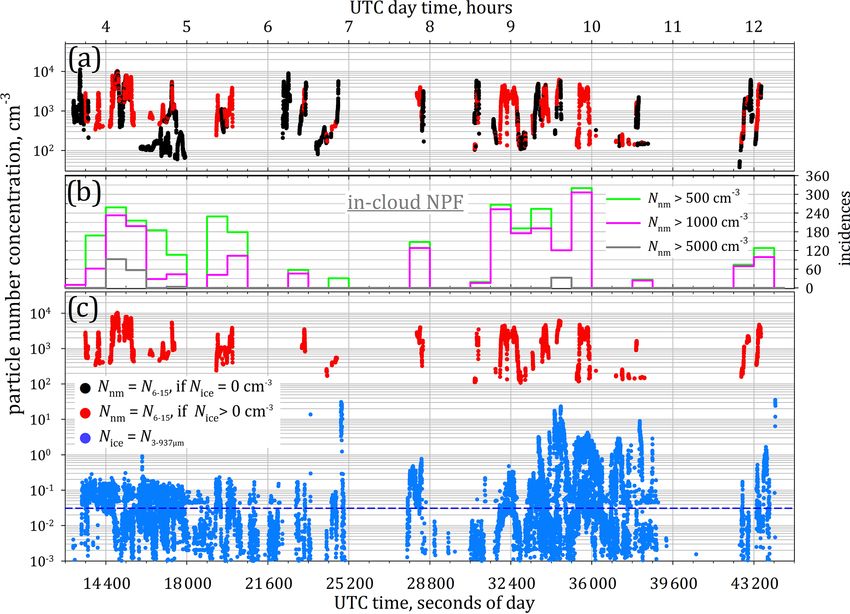
R. Weigel et al.: In situ observation of NPF in the tropical tropopause layer – Part 2                                                 13463

Figure 3. Vertical profiles of the mixing ratio (1 Hz resolved) of aerosols in the nucleation-mode size range (nnm ) versus the potential
temperature (θ ). (a) All data separated concerning coincident detection of cloud (ice) particles (black: Nice = 0 cm−3 ; red: Nice > 0 cm−3 )
and (b) all data coloured in reference to the flight date (c) exclusively for Nice > 0 cm−3 and (d) when Nice = 0 cm−3 . In panels (e) and (f),
in-cloud and clear-air measurements are distinguished as in intermediate panels (c, d) and coloured with reference to carbon monoxide (CO)
mixing ratios.

     served about twice as often as under clear-air conditions            malised to the occurrence frequency of Nnm of all NPF events
     (Fig. 4a).                                                           (black curve in Fig. 4a). More than 75 % of observed NPF
                                                                          cases with 2000 cm−3 < Nnm < 4000 cm−3 (∼ 200 samples)
The highest Nnm values are found mainly in the absence                    were detected while ice particles were present. In Fig. 4c,
of deposition surfaces, which ice particles would provide. It             the occurrence frequencies of Nnm are compiled for various
seems less understandable why NPF should generate a par-                  levels of number densities Nice , which were normalised to
ticular range of Nnm more frequently in the presence of cloud             Nnm at Nice > 0 cm−3 (red curve in Fig. 4a). Thresholds of
ice. Further discussion on this issue is provided in Sect. 6.             Nice are set with stepwise-increasing number concentrations
   Until this point, the presence or absence of ice par-                  (by 1 order of magnitude) to investigate whether the NPF is
ticles was distinguished by the criteria Nice = 0 cm−3 or                 eventually constrained or influenced by the ice particle num-
Nice > 0 cm−3 , respectively. Figure 4b depicts the occur-                ber density.
rence frequency of Nnm with ice particles Nice > 0 cm−3 nor-

https://doi.org/10.5194/acp-21-13455-2021                                                 Atmos. Chem. Phys., 21, 13455–13481, 2021
13464 R. Weigel et al.: In situ observation of NPF in the tropical tropopause layer – Part 2
set to Nice > 10−3 cm−3 (magenta curve), followed by the
threshold level of Nice > 10−2 cm−3 (corresponding to 1–
10 ice particles per litre; blue curve), which still repre-
sents a comparatively small amount of Nice within sub-
visible cirrus clouds (cf. Thomas et al., 2002; Peter et al.,
2003; Davis et al., 2010; Frey et al., 2011). The max-
imum observed Nice reached up to ∼ 3 cm−3 . Concern-
ing the frequency of observed Nnm , the difference be-
tween Nice > 0 cm−3 and Nice > 10−3 cm−3 appears negligi-
bly small. This leaves us to conclude that elevated Nnm was
mostly observed coincidently with ice crystal number densi-
ties greater than 10−3 cm−3 . With rising Nice level (above
10−2 cm−3 ), the occurrence frequency of the highest Nnm
(> ∼ 5000 cm−3 ) decreased. When Nice exceeds 10−1 cm−3 ,
the occurrence of Nnm > 4500 cm−3 is significantly reduced,
and Nnm > 8500 cm−3 was absent. At the highest observed
Nice of ∼ 3 cm−3 , NPF with Nnm > 250 cm−3 was not de-
tected anymore.
Hence, events with the highest NPF rates occurred prefer-
entially at low ice particle concentrations or in clear air. At
a certain Nice level (∼ 3 cm−3 ), the process of NPF appears
to be suppressed, in general agreement with earlier findings
(Weigel et al., 2011), indicating the limitation of NPF by
2 cm−3 of cloud ice particles with diameter larger than 2 µm.
Among other incidences, a singularly observed event was
discussed (Weigel et al., 2011), during which NPF appeared
to be suppressed by abundant cloud ice particles, while upon
leaving the cloud the NPF re-emerged at almost previously
observed concentrations of nucleation-mode particles. These
findings suggest that NPF is entirely prevented in cases when
Nice exceeds 2–3 cm−3 .
Figure 4. Histograms of the occurrence frequency of number con-
centrations Nnm of all NPF detections (1 Hz resolved) through- 4 In-cloud NPF related to IWC and cloud particle
out StratoClim 2017. (a) All data of Nnm in general (black) number densities
and separated concerning coincident detection of cloud (ice)
particles in the diameter size range 3 µm < dp < 937 µm (green: 4.1 The relationship between cloud ice and aerosols
Nice = N3−937µm = 0 cm−3 ; red: Nice > 0 cm−3 ). The sum of the
green and red curve yields the black curve, the vertical bars of Based on in situ measurements over northern Australia and
which represent the square root of counts. (b) Relative occur- over West Africa, de Reus et al. (2009) investigated the re-
rence frequency of Nnm for in-cloud NPF (if detected coincidently lationship between the number density of sub-micrometre-
with Nice > 0 cm−3 ), normalised with respect to all NPF detec-
sized aerosol particles and the abundance of cloud parti-
tions, i.e. the ratio of the absolute occurrence frequencies (in red
cles at UTLS levels. The authors provided aerosol and ice
and black in panel a). (c) Relative occurrence frequency of Nnm
for in-cloud NPF if detected coincidently with various Nice levels, particle number concentrations averaged over the duration
which were normalised with respect to those NPF detections with of various cloud encounters to determine the proportion of
Nice > 0 cm−3 , (in red; panel b). sub-micrometre-sized particles that potentially convert into
cloud ice. In the context of homogeneous ice nucleation, a
specific relationship between the number concentration of
aerosol and of ice particles cannot be expected (Kärcher and
Although very faint, so-called sub-visible cirrus clouds Lohmann, 2002), whereas such a relationship is inherent in
were found to comprise very small ice particle number the ice clouds’ heterogeneous freezing process. From their
concentrations of 10−5 cm−3 (corresponding to 0.1 L−1 ; cf. analyses, de Reus et al. (2009) concluded that a similar range
Kübbeler et al., 2011; Spreitzer et al., 2017). Sub-visible of ice–aerosol ratios is observable in the convective outflow
cirrus with Nice < 10−3 cm−3 are assumed to have negli- of both ordinary tropical convection (Australia) and large
gible influence on the NPF process, as is also to con- mesoscale convective systems (MCSs; West Africa).
clude from Fig. 4c. Therefore, a first threshold level is
Atmos. Chem. Phys., 21, 13455–13481, 2021 https://doi.org/10.5194/acp-21-13455-2021R. Weigel et al.: In situ observation of NPF in the tropical tropopause layer – Part 2 13465
centrations below 1000 cm−3 . Compared to previous find-
ings, the StratoClim data set comprises more observations
at cloud ice–aerosol ratios between 1 : 3000 and 1 : 500 000,
including frequent events of elevated N10 (> 103 cm−3 ).
High N10 of more than 6000 cm−3 was observed at
IWC values mostly below 10 µmol mol−1 (i.e. log (IWC;
µmol mol−1 ) ≈ 1; Fig. 5a). The majority of observations
were made at mean IWC values below ∼ 300 µmol mol−1
(i.e. log (IWC; µmol mol−1 ) ≈ 2.5), which rules out that the
measured N10 was impacted by shattering artefacts from
ice particles (see Appendix A). The majority of NPF oc-
currences (mostly at ambient air temperatures between −50
and −80 ◦ C) coincide with cloud ice–aerosol ratios between
1 : 3000 and 1 : 500 000 (see Fig. 5b). The data points with
in-cloud NPF concentrate between ratios of 1 : 30 000 and
1 : 500 000 because as a consequence of NPF, the aerosol pro-
portion in the cloud ice–aerosol ratio is strongly elevated.
Concentration N10 of more than 1000 cm−3 were not de-
tected at ratios greater than 1 : 3000. For N10 above 500 cm−3
and for cloud ice–aerosol ratios smaller than 1 : 30 000, i.e.
where elevated total aerosol concentrations mostly coincide
Figure 5. StratoClim 2017 data of the total number concentration
with lower ice particle densities (∼ 10−3 –10−1 cm−3 ), the
N10 together with coincident detections of Nice (i.e. N3–937 µm )
observations occurred during NPF. Cloud ice–aerosol ratios
by the NIXE-CAPS. The vertical bars represent the standard de-
viation over the averaging periods. Data points are colour-coded greater than 1 : 3000 were reached mostly in the absence of
in panel (a) with reference to IWC. (b) NPF encounters (orange) NPF.
throughout the averaging period (otherwise grey). Shaded blue ar- As pointed out by de Reus et al. (2009), there are caveats
eas in both panels indicate the range of most of the data points pro- inherent to this kind of analysis. The strength or efficiency of
vided by de Reus et al. (2009). Reference lines for concentration the aerosol activation is not straightforward to deduce from
ratios of 1 : 300 and 1 : 30 000 (as in de Reus et al., 2009) and here provided ratios of total aerosol and cloud particle numbers.
additionally for 1 : 500 000 and 1 : 5 000 000 are provided. Many interdependencies exist that may impact the illustrated
relationship, such as
Figure 5 depicts the StratoClim 2017 data correspond- 1. the altering of the aerosol particles (coagulation, con-
ingly to the data presentation by de Reus et al. (2009) from densation) or of the cloud elements (sedimentation)
UT measurements in 2005 during SCOUT-O3 over Darwin,
2. the mixing of air masses with different aerosol and/or
Australia. Reference lines are included, which indicate the
variable vapour saturation characteristics (entrainment).
number of encountered cloud particles per number of sub-
micrometre-sized aerosol particles. The two panels in Fig. 5 The type of ice formation process (liquid-origin or in situ)
comprise the identical set of data points of ice cloud encoun- and the convection dynamics additionally affect the relation-
ters during StratoClim 2017, each of which are averaged over ship of cloud elements and interstitial aerosol. Assigning
at least 10 s and up to ∼ 23 min. nucleation-mode particles of thousands per cubic centimetre
Several occasions were identified by de Reus et al. (2009) (or more) to result from NPF is straightforward. In contrast,
when comparatively high ratios with up to a few hundred Nnm of a few tens to hundreds of particles per cubic centime-
aerosol particles remained non-activated per single ice par- tre is potentially filtered by the NPF criterion and is probably
ticle. The cloud ice–aerosol ratios which were found in the not identified as an NPF event if detected together with total
Asian monsoon’s convective outflow region agree with pre- aerosol concentrations (N10 ) of comparable numbers. Apart
vious observations (de Reus et al., 2009), which were lim- from demonstrating the reproducibility of earlier findings (de
ited to the shaded blue area in Fig. 5. Total aerosol num- Reus et al., 2009), the data set was extended by new observa-
bers of significantly less than a few hundred per single ice tions at different conditions (including NPF) obtained from
particle were observed neither during StratoClim 2017 nor StratoClim measurements.
by de Reus et al. (2009). Up to N10 of 700 cm−3 almost
all StratoClim data result from measurements at mean am- 4.2 NPF in the IWC–T parameter space
bient temperatures colder than −75 ◦ C (i.e. the temperatures
at which the observations by de Reus et al., 2009, were Analyses in earlier cirrus-related studies concerning the
made). Frequent observations were made at aerosol con- clouds’ ice water content (IWC) as a function of ambient
https://doi.org/10.5194/acp-21-13455-2021 Atmos. Chem. Phys., 21, 13455–13481, 202113466 R. Weigel et al.: In situ observation of NPF in the tropical tropopause layer – Part 2
air temperature provide insight into the processes inherent
to the cirrus formation (Krämer et al., 2016). As introduced
by Luebke et al. (2016), Krämer et al. (2016), and Wernli
et al. (2016), a distinction of cirrus clouds regarding their
formation mechanism is obtainable within the IWC–T pa-
rameter space. The cirrus forms in situ at elevated altitudes
and instantaneously at sufficiently cold temperatures. The
liquid-origin cirrus cloud forms on convective uplift from
initially liquid droplets at lower altitudes (and less cold tem-
peratures). More specifically, Wernli et al. (2016) distinguish
between the following.
– Liquid-origin cirrus. Initially well-sized liquid cloud
droplets freeze at almost thermodynamic equilibrium
in the ambient temperature range 235 K < T < 273 K
under nearly saturated conditions with respect to liq-
uid water (relative humidity RHw of ∼ 100 %) but at
high supersaturation with respect to ice (RHi
100 %),
while at freezing level, the water can coexist in each of
its three phases.
– In situ cirrus. Under exclusion of pre-existing large
liquid cloud droplets, ice crystals nucleate heteroge-
neously (due to deposition freezing) or freeze ho-
mogeneously from tiny super-cooled aqueous solution
droplets (Koop et al., 2000), which are designated as
“too small to be considered as cloud droplets” (Wernli
et al., 2016).
In Fig. 6 the IWC versus ambient air temperatures is dis-
played for all cloud encounters throughout StratoClim 2017
as a function (colour code) of Figure 6. NPF in the IWC–T parameter space (Krämer et al., 2016):
measured ice water content (IWC) coincidently detected with CO-
a. the mixing ratio of nucleation-mode particles (i.e. PAS data as a function of ambient air temperature throughout Stra-
n6−15 = nnm ; Fig. 6a), toClim 2017 (1 Hz resolved). Data points are colour-coded referring
to (a) the detected mixing ratios of nucleation-mode particles, nnm ;
b. the total mixing ratio n6 of particles with dp > 6 nm (b) the total mixing ratio n6 ; and (c) the carbon monoxide (CO)
(Fig. 6b), and mixing ratio. Note: in panel (a), the data points are grey if data of
n6−15 are available, while colours are apportioned only to those
c. the CO mixing ratio (Fig. 6c), respectively. nnm (i.e. n6−15 ) complying with the NPF criterion. Generally, the
black lines represent the median (solid) and the upper- and lower-
The upper panel of Fig. 6 includes two data sets: (1) all most bounds (dashed) of the core IWC band, respectively, as ob-
data from StratoClim 2017 in 1 Hz resolution (grey data tained from earlier measurements at other locations (Krämer et al.,
points) and (2) only the resulting nnm complying with the 2016).
NPF criterion (colour-coded data points). At very low ambi-
ent air temperatures (∼ 200 K and colder) and for compar-
atively high IWC values, the n6−15 (grey) data were avail- the enriched particle densities (n6 and n15 ) distribute over
able, but many failed the NPF criterion. The absolute val- the diameter spectrum of the sub-micrometre-sized aerosols.
ues of the mixing ratio n6 of sub-micrometre-sized parti- It therefore remains open whether the restrained n6−15 is due
cles were relatively high (Fig. 6b). The detection of like- to expired NPF with particles’ rapid coagulation (with back-
wise excessive mixing ratios n15 (without illustration) re- ground aerosol and cloud ice) out of the nucleation-mode
sulted in n6−15 that did not exceed the specified threshold size range (Weigel et al., 2021) or whether the particle en-
of the NPF criterion (see Sect. 1.1). Nevertheless, most of richment (consistently in n6 and n15 ) is due to larger parti-
the n6−15 data points which failed the NPF criterion (see cles that were lifted with deep convection. The main findings
the grey points in Fig. 6a) coincide with the mixing ratios from these juxtapositions can be summarised as follows:
n6 reaching up to several thousands of particles per mil-
ligram. It is not deducible from COPAS measurements how
Atmos. Chem. Phys., 21, 13455–13481, 2021 https://doi.org/10.5194/acp-21-13455-2021R. Weigel et al.: In situ observation of NPF in the tropical tropopause layer – Part 2 13467
– The absence of NPF with IWC exceeding – Air’s low pollutant load is indicated by compara-
1000 µmol mol−1 in very cold air (Fig. 6) suggests that tively moderate or low CO mixing ratios between 50
NPF is constrained as soon as deep convection prevails and about 100 nmol mol−1 at ambient air temperatures
due to the presence of predominantly liquid-origin of < 200 K (Fig. 6c). For comparison, the NPF ob-
ice particles. IWC exceeding 1000 µmol mol−1 at air served during the West African monsoon was associ-
temperatures colder than 200 K indicates that deep ated with CO levels between 60 and 90 nmol mol−1
convection had occurred. This high IWC originated (Weigel et al., 2011). Observation of intermediate NPF
from cloud ice that formed from liquid droplets at (nnm < 1500 mg−1 , log (nnm ; mg−1 ) . 3.3) in the midst
lower altitudes as the amount of water vapour in of in-situ-formed cloud ice in air with low pollutant load
the air at such cold temperatures is not sufficient to (CO < 80 nmol mol−1 ) indicates that recent convective
achieve comparable IWC values. Thus, the formation uplift of polluted air is not a prerequisite for NPF to oc-
of encountered cirrus cannot be attributed to any other cur. Advection of air from elsewhere or chemical and/or
process than the liquid-origin process. This feature was photochemical conversion causes the accumulation of
observed during the flights on 27 July and on 10 August NPF precursors at UTLS levels. In air with the high-
2017, respectively. Within the same temperature range est CO content (> 100 nmol mol−1 ), the IWC–T val-
(T < 200 K), only a few NPF events with intermediate ues (for T > 200 K, i.e. at lower altitudes) remain in ex-
nnm of more than ∼ 4000 mg−1 (log (nnm ; mg−1 ) & 3.6; pected ranges, and they scatter within the limits of most
yellow and reddish colours in Fig. 6a) were encountered frequent observations (dashed black lines in Fig. 6) as
offside from strong convection. obtained from earlier analyses (Krämer et al., 2016).
At the highest CO content (> 100 nmol mol−1 ), the nnm
– In the presence of in-situ-formed cirrus particles values predominantly remained below 5000 mg−1 .
at cold temperatures (185–200 K), i.e. in or around
the cold point tropopause region, NPF events with
nnm > 5000 (i.e. log (nnm ; mg−1 ) > 3.7; orange and 5 The dependency of NPF on the proximity to ice
reddish colours in Fig. 6a) or recent NPF bursts particles
were rarely observed. When the cloud ice has formed
in situ (CO < 80 nmol mol−1 ; yellow, greenish, and 5.1 NPF as a function of mean free distance between
blue colours in Fig. 6c), mostly weak NPF with ice elements
nnm < 1500 mg−1 (i.e. log (nnm ; mg−1 ) < 3.2; bluish
colours of data points in Fig. 6a) was observed. These Surfaces such as those of ice particles constitute sinks for the
data also indicate that NPF proceeds in air with low CO gaseous precursor species such as the H2 SO4 –H2 O system
content. (Bogdan et al., 2006, 2013), and the abundance of condensa-
tion surface reduces or even prevents the NPF process.
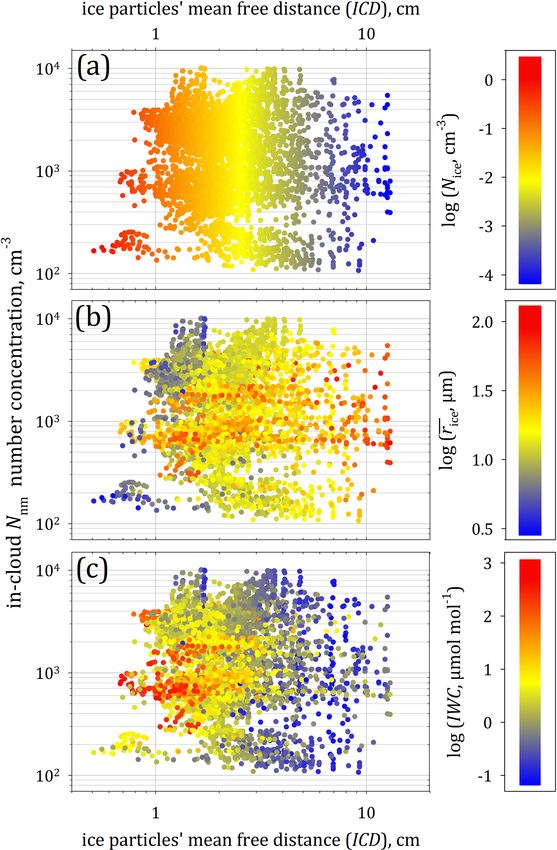
– Suppression of NPF by cloud particles (due to the large The free distance between the ice particles is quantified
total surface area from their number density and particle based on the measurements of Nice and of the ice particles’
size) could explain why the number of nucleation-mode mean mass radius rice (consider rice 3 ∼ IWC
Nice ). The mean free
particles remained below the NPF criterion thresh- volume in between the ice particles (the inter-crystal volume,
old at high IWC although total particle mixing ratios ICV, per cubic centimetre of air) is calculated with the num-
∗ of ice particles (instead of the particles’ number con-
ber Nice
(n6 and n15 ) were significantly elevated. It is unlikely
that the abundance of sub-micrometre-sized particles centration) as
of up to 11 000 cm−3 originates from interstitial (non-
activated) aerosols carried in the cloud without con- V − 34 · π · r 3ice · Nice
∗
ICV = ∗ , (2)
tributions from NPF. The large particle quantities ob- Nice
served (103 –104 mg−1 ) and the moderate CO content of
which basically subtracts the total ice volume from the sam-
the air sampled (. 100 nmol mol−1 ) indicate a source
pled air volume (V = 1 cm3 ), and the division by Nice∗ yields
of these particles at high altitudes. About 4 h after an
the ICV. Consequently, the ICV represents the mean particle-
NPF event has expired, the event may not be detectable
free volume assuming a homogeneous distribution of ice
anymore due to the short persistence of the particles in
crystals within the air volume. With a maximum of measured
the nucleation-mode size range (Weigel et al., 2021). ∗ = 3) together with the maximum detected
ice particles (Nice
Hence, if the IWC values remained high over several
hours due to deep convection and if NPF had hap- ice particle radius of 100 µm, the subtraction V − 43 · π · r 3ice ·
∗ corresponds by the order of magnitude to a subtraction
Nice
pened more than 4 h prior to the measurements, then the
nucleation-mode particles have certainly coagulated to of 10−11 cm−3 from 1 cm−3 . Hence, the volume of ice is in-
sizes beyond 15 nm in diameter. significant compared to the volume of air, and the ICV may
be considered to be a function of Nice∗ only. The mean inter-
crystalline distance (ICD; in centimetres) is then calculated
https://doi.org/10.5194/acp-21-13455-2021 Atmos. Chem. Phys., 21, 13455–13481, 2021You can also read