Intraspecific ecological niche divergence and reproductive shifts foster cytotype displacement and provide ecological opportunity to polyploids
←
→
Page content transcription
If your browser does not render page correctly, please read the page content below
Annals of Botany 121: 1183–1196, 2018
               doi: 10.1093/aob/mcy004, available online at www.academic.oup.com/aob

                Intraspecific ecological niche divergence and reproductive shifts foster cytotype
                        displacement and provide ecological opportunity to polyploids
                                        Piyal Karunarathne1, Mara Schedler2, Eric J. Martínez2, Ana I. Honfi3,
                                                  Anastasiia Novichkova4 and Diego Hojsgaard1,*
                1
                 Department of Systematics, Biodiversity and Evolution of Plants, Albrecht-von-Haller Institute for Plant Sciences, University
                 of Goettingen, Untere Karspuele 2, D-37073 Goettingen, Germany, 2Instituto de Botánica del Nordeste (IBONE), Facultad
                  de Ciencias Agrarias, Universidad Nacional del Nordeste (FCA-UNNE), CC209, 3400, Corrientes, Argentina, 3Programa
                  de Estudios Florísticos y Genética Vegetal, Facultad de Ciencias Exactas, Químicas y Naturales, Universidad Nacional de
                  Misiones, Instituto de Biología Subtropical (CONICET-UNaM), Rivadavia 2370, 3300, Posadas, Misiones, Argentina and
                             4
                               Department of Botany, Institute of Biology, Taras Shevchenko National University of Kyiv, Ukraine
                                          *For correspondence. E-mail Diego.Hojsgaard@biologie.uni-goettingen.de

                         Received: 11 September 2017   Returned for revision: 12 October 2017 Editorial decision: 5 January 2018 Accepted: 15 January 2018
                                                                       Published electronically 3 February 2018

                              • Background and Aims Niche divergence between polyploids and their lower ploidy progenitors is one of
                              the primary mechanisms fostering polyploid establishment and adaptive divergence. However, within-species
                              chromosomal and reproductive variability have usually been neglected in community ecology and biodiversity
                              analyses even though they have been recognized to play a role in the adaptive diversification of lineages.
                              • Methods We used Paspalum intermedium, a grass species with diverging genetic systems (diploidy vs.
                              autopolyploidy, allogamy vs. autogamy and sexuality vs. apomixis), to recognize the causality of biogeographic
                              patterns, adaptation and ecological flexibility of cytotypes. Chromosome counts and flow cytometry were used
                              to characterize within-species genetic systems diversity. Environmental niche modelling was used to evaluate
                              intraspecific ecological attributes associated with environmental and climatic factors and to assess correlations
                              among ploidy, reproductive modes and ecological conditions ruling species’ population dynamics, range
                              expansion, adaptation and evolutionary history.
                              • Key Results Two dominant cytotypes non-randomly distributed along local and regional geographical scales
                              displayed niche differentiation, a directional shift in niche optima and signs of disruptive selection on ploidy-
                              related ecological aptitudes for the exploitation of environmental resources. Ecologically specialized allogamous
                              sexual diploids were found in northern areas associated with higher temperature, humidity and productivity, while
                              generalist autogamous apomictic tetraploids occurred in southern areas, occupying colder and less productive
                              environments. Four localities with a documented shift in ploidy and four mixed populations in a zone of ecological
                              transition revealed an uneven replacement between cytotypes.
                              • Conclusions Polyploidy and contrasting reproductive traits between cytotypes have promoted shifts in niche
                              optima, and increased ecological tolerance and niche divergence. Ecologically specialized diploids maintain
                              cytotype stability in core areas by displacing tetraploids, while broader ecological preferences and a shift from
                              sexuality to apomixis favoured polyploid colonization in peripheral areas where diploids are displaced, and
                              fostered the ecological opportunity for autotetraploids supporting range expansion to open southern habitats.

                              Key words: Apomixis, flow cytometry, geographical parthenogenesis, Grinnellian niche, niche breadth, niche
                              expansion, Paspalum L., polyploidy.

                                       INTRODUCTION                                        Ramsey, 2014). Biogeographical surveys on polyploid species
                                                                                           suggest that multiple sets of chromosomes provide polyploids
               Polyploidy is now considered a widespread and ubiquitous                    with short- and long-term advantages to better deal with envir-
               phenomenon in the evolutionary history of species (Otto and                 onmental changes, range shifts, persistence across heteroge-
               Whitton, 2000; Van de Peer et al., 2017). The present advent of             neous landscapes and colonization of new habitats (e.g. Hegarty
               new data and methods has propelled a tremendous interest in                 and Hiscock, 2008; Parisod et al., 2010). Polyploidization is
               polyploidy, especially in plant sciences (Madlung, 2013; Soltis             a major driving force of genetic and ecological change, and
               et al., 2014). Even though the causality and consequences of                a platform for speciation of vascular plants (Husband et al.,
               polyploidy are better known now than when it was discovered                 2013). Recent studies showed that genome duplications have
               around 100 years ago, we are just starting to understand the                preceded rapid diversification events in different plant families
               complex dynamics of polyploidization and its consequences for               (e.g. Soltis et al., 2009; Wood et al., 2009). Genome duplication
               the ecological adaptation and evolution of taxa (Ramsey and                 provides genetic redundancy, creates genomic and phenotypic

                                                   © The Author(s) 2018. Published by Oxford University Press on behalf of the Annals of Botany Company.
                                                                        All rights reserved. For permissions, please e-mail: journals.permissions@oup.com.
Downloaded from https://academic.oup.com/aob/article-abstract/121/6/1183/4837271
by SUB Goettingen user
on 14 August 2018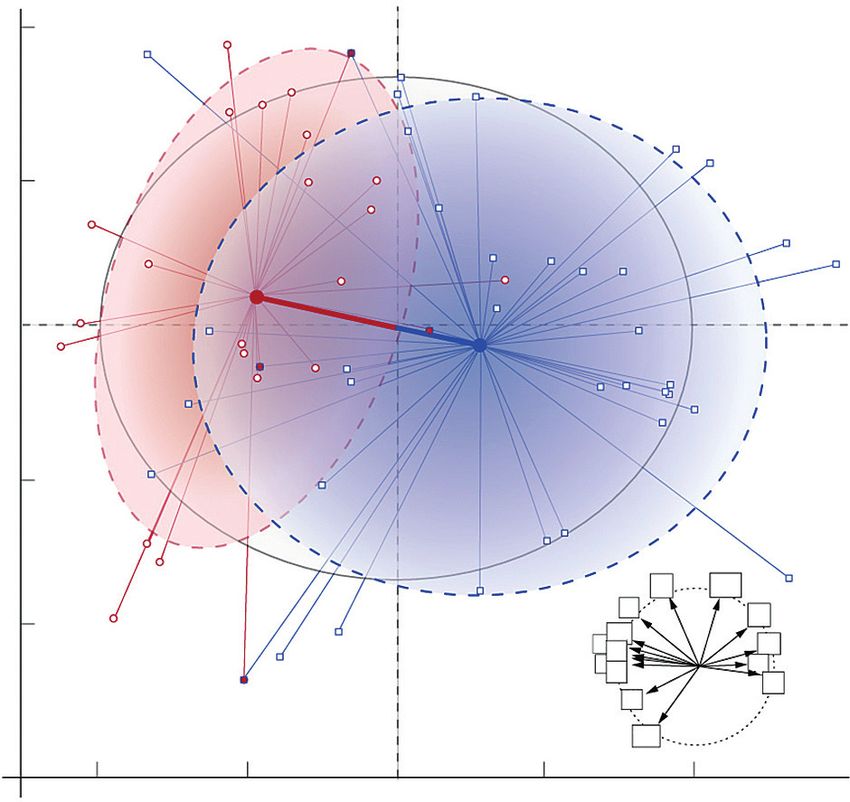
1184                    Karunarathne et al. — Niche divergence between cytotypes in Paspalum intermedium

          novelty and influences the ecophysiology and genetic diversity           reproductive limitations (e.g. minority cytotype disadvantage;
          of individuals by shifting heterozygosity levels and allelic com-        Levin, 1975) and gamete incompatibility (Asker and Jerling,
          binations, and by introducing epigenetic changes and variation           1992; Hojsgaard et al., 2014a), and facilitate ‘founder events’
          in gene expression. Hence, polyploidization plays a significant          (e.g. Baker’s Law; Baker 1955). Consequently, polyploids
          role enhancing adaptability to extreme habitats (Osborn et al.,          with better colonizing abilities may capitalize on ecological
          2003; Chen, 2010; Finigan et al., 2012).                                 opportunities, achieve wider distributions leading to phenom-
             Polyploidization events in plants have been recurrently asso-         ena such as geographical parthenogenesis (e.g. Hörandl, 2006;
          ciated with niche divergence and ecological differentiation of           Vrijenhoek and Parker, 2009) and enhance diversification abili-
          cytotypes as an important mechanism for the establishment of             ties via reversals to sex (Hojsgaard et al., 2014b; Hojsgaard and
          new polyploids in nature. This facilitates both the maintenance          Hörandl, 2015).
          of intraspecific cytotype diversity as well as sympatric spe-               Despite the increased interest in the topic, studies examin-
          ciation events among closely related taxa (Soltis et al., 2004;          ing intraspecific diversity and modelling ecological divergence
          Schluter, 2009; Givnish, 2010; Anacker and Strauss, 2014;                in diploid–autotetraploid species (e.g. Visger et al., 2016),
          Glennon et al., 2014; Visger et al., 2016). Thus, polyploidy             diploid–allopolyploid species (e.g. Sonnleitner et al., 2016)
          alters the ecological niche of a species by broadening environ-          or other diploid–polyploid associations (e.g. Raabová et al.,
          mental tolerance and providing ecological and evolutionary               2008; Chumová et al., 2017; Paule et al., 2017) are just starting
          flexibility (e.g. Dubcovsky and Dvorak, 2007; Fawcett et al.,            to be feasible as high-resolution climatic data sets are becom-
          2009). Although there are many concepts of ‘niche’ (Soberón              ing available. More studies carrying comprehensive analyses
          and Nakamura, 2009), the Grinnellian niche, which is defined             of intraspecific traits and bioclimatic conditions are needed
          by the sub-set of scenopoetic (non-interactive) environmental            and essential to better understand the natural forces underly-
          conditions under which populations of a species have posi-               ing plant adaptation and distribution in different regions of
          tive growth rates (Grinnell, 1917; Soberón, 2007), is the one            the world. Here, we utilize the grass species Paspalum inter-
          extensively used in recent years. This concept has become                medium Munro ex Morong to decipher natural factors and
          popular also because data for niche-defining variables (e.g.             stressors governing intraspecific trait diversity, cytotype coex-
          topography, average temperature, solar radiation, precipitation,         istence and their dynamics within and among populations.
          etc.) are progressively becoming available for the entire planet         Niche divergence and changes in phenology and reproductive
          (e.g. Turner et al., 2003). At present, increasing availability          strategies that may provide a platform for ecological oppor-
          of public databases [e.g. the Global Biodiversity Information            tunity are also studied to discern ecological consequences of
          Facility (GBIF); WorldClim] and information gateways [e.g.               polyploidy.
          Geographic Information Systems (GIS)], and a renewed inter-                 Paspalum L. is a grass genus with versatile genetic systems
          est in plant polyploidy allow modern biogeography to use                 (Ortiz et al., 2013). In P. intermedium specifically, two cyto-
          mathematical models [species distribution modelling (SDM)/               types with contrasting reproductive modes (sexual self-sterile
          ecological niche modelling (ENM)] (e.g. Elith and Leathwick,             diploids and apomictic self-fertile auto-tetraploids) are found
          2009; Soberón, 2010) to better understand how polyploidy and             intermingled in sympatry, parapatry or allopatry (Burson and
          associated features influence niche evolution, habitat suitability       Bennett, 1970; Norrmann et al., 1989). The centre of diversi-
          and organism distributions.                                              fication of the species is considered to be the sub-tropics of
             Natural intraspecific trait variation associated with poly-           Argentina, where they occur in marshy grasslands in diverse
          ploidy, in particular reproductive modes, is widely known                phytogeographic formations along ecological gradients in
          to affect plant physiology, ecology and dispersal abilities.             Argentina, Paraguay, Bolivia and Brazil (Zuloaga et al., 2012).
          Experimental studies indicate that intraspecific trait variation         The presence of divergent genetic systems (i.e. allogamy vs.
          can have a significant effect on community ecology (Bolnick              autogamy, sexuality vs. apomixis and diploidy vs. polyploidy)
          et al., 2011; Araújo et al., 2013). Intraspecific trait variation        is known to modulate a plant’s genetic diversity and its capacity
          is expected to alter population density, niche breadth and the           to respond to environmental constraints that determine the dis-
          strength of the interaction among phenotypes, affecting the              tribution, ecological diversification and evolutionary potential
          structure of the community, ecological opportunities and adap-           of species and plant communities (Tilman and Lehman, 2001;
          tive eco-evolutionary dynamics (Bolnick et al., 2011; Wellborn           Pauls et al., 2013; Allan et al., 2015). Hence, P. intermedium
          and Langerhans, 2015). The study of traits such as cytotype              provides a unique opportunity for studying ecological signals
          diversity, dispersal ability, phenology, different reproductive          and biological traits governing intraspecific trait variation along
          modes and associated environmental signals is essential for              spatial and ecological gradients, cytotype coexistence, popula-
          understanding local and regional population dynamics (e.g.               tion dynamics and adaptation at local and regional geographic
          Castro et al., 2012; Sonnleitner et al., 2016; Visger et al., 2016),     scales.
          provides insights into evolutionary pathways and forces driving             In the present study, we (1) evaluate the natural prevalence
          species coexistence, ecological opportunity and adaptive diver-          of P. intermedium cytotypes at various spatial scales; (2) eval-
          sification (Arrigo and Barker, 2012; Wellborn et al., 2015). For         uate reproductive and phenological shifts; (3) assess climatic
          example, reproductive shifts toward self-fertility and apomixis          and ecological preferences between cytotypes of P. interme-
          (asexual reproduction via seeds) are frequently linked to poly-          dium; (4) determine the presence of singular ecological and
          ploid cytotypes (Asker and Jerling, 1992; Robertson et al.,              biological signals driving cytotype distribution and domi-
          2010) and drastically affect species’ dispersal abilities and dis-       nance; and (5) provide evidence of niche differentiation
          tribution patterns. Such features provide reproductive assurance         between cytotypes and further insights into natural stressors
          to polyploids by enabling them to overcome density-dependent             governing the dynamic of cytotype associations, geographic

Downloaded from https://academic.oup.com/aob/article-abstract/121/6/1183/4837271
by SUB Goettingen user
on 14 August 2018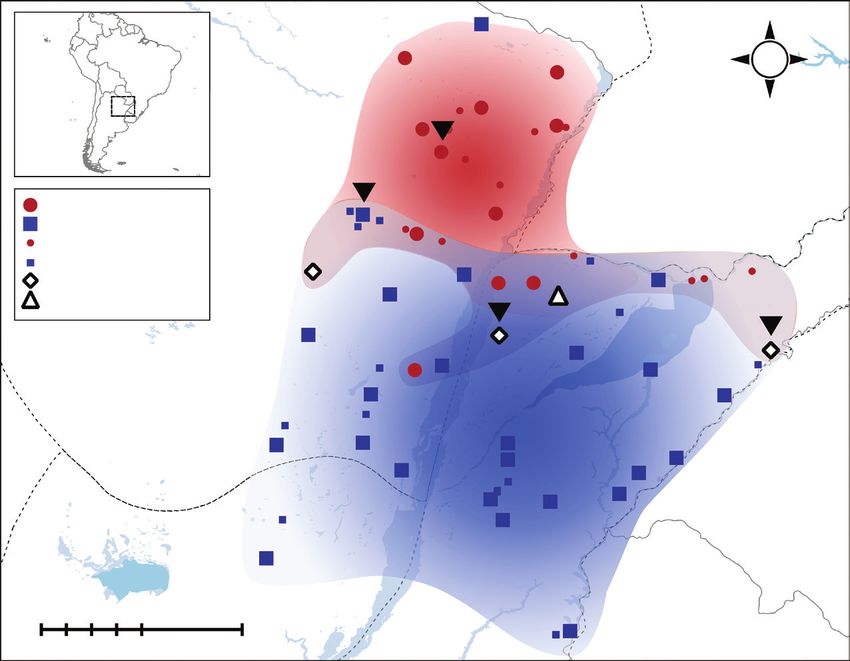
Karunarathne et al. — Niche divergence between cytotypes in Paspalum intermedium 1185
displacement and range expansions that contribute to local dimensions of each population). Young (i.e. smaller bushes
adaptation and ecological opportunity. with a diameter 60 cm
with many flowering stems) were distinguished and collected
MATERIALS AND METHODS to account for individual turnover and overlapping generations.
Several vouchers from all locations were prepared and depos-
Sampling sites and collection of plant materials ited at different herbaria (CTES, MNES, BAA and SI).
Plant materials were collected from Eastern Gran Chaco, central
and Northern Mesopotamia (core distribution areas of the species),
and Northern Pampas and Western Gran Chaco (peripheral distri- Assessment of ploidy and reproductive trait variation
bution of the species) in Argentina (Table 1; Fig. 1; Supplementary
The ploidy level of each sample was determined by flow
Data Table S1) (see Zuloaga et al., 2012). Additional information
cytometry (FC) estimations of relative nuclear DNA con-
on cytotype occurrences was gathered from the literature and from
tents in comparison with a P. intermedium plant with known
material examined at different herbaria (MNES, CTES, BAA,
ploidy (2x = 2n = 20). An AT-specific DNA fluorochrome,
SI, B, GOET, HUH and PE) (acronyms follow Thiers, 2017)
DAPI (4’,6-diamidino-2-phenylindole) was used for FC with
(see Supplementary Data Table S2). Sampling was done during
a CyFlow® Ploidy Analyser (Sysmex Partec GmbH, Görlitz,
two different time periods (November/December and February/
Germany). The protocol described by Suda and Trávníček
March) to avoid seasonal bias on cytotype frequencies and evalu-
(2006) for dried leaf materials was followed, with modifica-
ate phenological differentiation between cytotypes. Changes in
tions (detailed in Supplementary Data Method S1). Histograms
phenology were evaluated by grouping observations into early
with a relative fluorescence intensity of around 5000 nuclei
(October–December) and late (January–March) flowering fol-
were analysed with CyView™ v. 1.5 data acquisition and data
lowed by testing for independence.
analysis software (Sysmex Partec GmbH, Münster, Germany).
Collection sites were categorized into (1) sites for ploidy
A maximum coefficient of variation (CV) value of 5 % was
determination only (up to three individuals were collected)
accepted for each sample peak (G0/G1 peak). FC ploidy deter-
and (2) sites to evaluate cytotype diversity and dynamics at the
minations were cross-checked with (1) repetitions of FC meas-
population level (on average 30 individuals per population were
urements in selected samples and (2) chromosome counts in
collected) (Supplementary Data Table 1). For the latter, sam-
cells at the mitotic division of 17 samples recognized as dip-
pling sites were selected to attain a maximum representation
loids or tetraploids through FC analyses (following Hojsgaard
of the distribution range of the species (i.e. North–South and
et al., 2009). Mitotic metaphase cells were observed under a
East–West), and include both macro-scale (among populations)
Leica DM5500B microscope (Leica Microsystems GmbH,
and micro-scale (within populations) trends. Overall, samples
Wetzlar, Germany) for chromosome counts.
were collected from 75 localities, out of which 35 were selected
Analysis of reproductive modes was conducted using FC.
for population evaluations (Table 1; Supplementary Data Table
Open pollinated seeds from three randomly selected individu-
S1). A transect spanning the longest length available across the
als per population were collected from a total of 20 P. inter-
population was followed to obtain information on local disper-
medium populations with unknown ploidy (other populations
sal of cytotypes. An even representation of individuals within
did not bear mature seeds during the fieldwork). After ploidy
the population was attained by uniform sampling (i.e. the dis-
determination, only three out of 20 were determined as diploid
tance between two consecutive individuals was maintained the
populations. A total of 500 seeds belonging to 15 populations
same, and varied between 4 and 12 m depending on the spatial
(three diploids and 12 tetraploids) were used to assess varia-
tions in reproductive modes at geographic and/or cytotype lev-
Table 1. Summary of ecoregions, collection sites, number of indi- els following the methodology of Hojsgaard et al. (2014a) with
viduals and ploidy levels of the P. intermedium plants analysed a few modifications (details in Supplementary Data Method
S2). The relative fluorescence intensity of around 3000 nu-
Geographic No. of collection sites Total no. of Ploidy clei was analysed with CyView™, and discrete peaks were
region individuals (x = 10)
assigned to embryo and endosperm seed tissues. A maximum
Mesopotamia CV value of 5 % was accepted for each peak. Reproductive
Populations 5 119 2x pathways were determined according to the rationale by Matzk
17 460 4x et al. (2000) and following considerations for Paspalum spp.
Solitary individuals 4 5 2x
6 10 4x
as in Hojsgaard et al. (2013). Sexually derived seeds have a
Gran Chaco diploid embryo (2n; 2C-value) and a triploid endosperm (3n;
Populations 10 301 2x 3C-value), whereas seeds derived from apomixis carry a dip-
10 286 4x loid embryo and a pentaploid endosperm (5n; 5C-value) (for
Solitary individuals 6 6 2x details, see Hojsgaard et al., 2013).
6 6 4x
Pampas
Populations – – 2x
1 30 4x
Solitary individuals – – 2x
Cytotype localities, environmental and climatic data
1 1 4x Since scenopoetic variables (abiotic variables that do not
Total 68 1224
interact with each other) are regarded as being associated with
Downloaded from https://academic.oup.com/aob/article-abstract/121/6/1183/4837271
by SUB Goettingen user
on 14 August 2018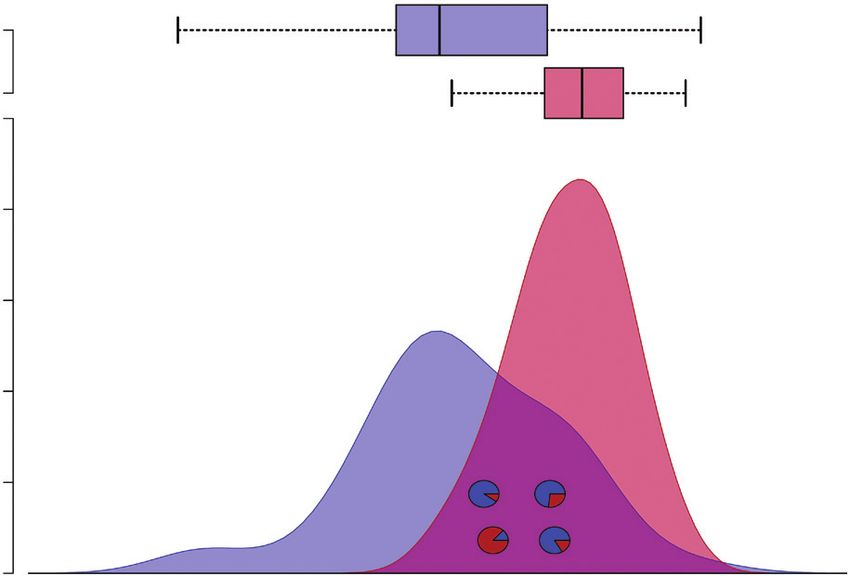
1186 Karunarathne et al. — Niche divergence between cytotypes in Paspalum intermedium
N
W E
S
ARGENTINA 4
PARAGUAY
1
2× Populations
4× Populations
2× Individuals
4× Individuals
2× + 4× Populations
2× + 3× + 4× Populations 2
3
Gran Chaco
BRASIL
Pampas
Mesopotamia
100 0 100 km
URUGUAY
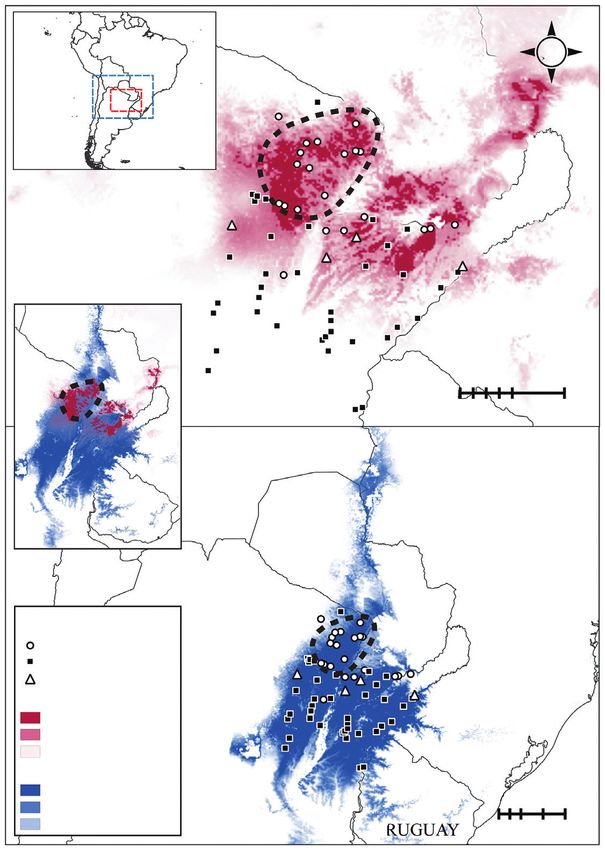
Fig. 1. Map displaying all collection localities of P. intermedium and ploidy levels determined in the present study. The North–South cytotype cline is apparent,
together with an East–West transition zone where cytotypes occur intermingled in pure and mixed populations. Ploidies at sites of populations are represented by
data from at least 30 individual plants. Ploidies at sites of individuals are represented by data from 1–3 individuals. Triangles 1, 2, 3 and 4 indicate populations
(geographical sites) representing vis-à-vis ploidy shifts between previous and present records (see the Discussion). Grey lines demarcate country boundaries (block
letters) and dotted lines separate ecoregions (italic letters) (sensu Cabrera, 1976).
heritable components of the physiology of species (Kearney and 30 arc-s resolution. Finally, soil type data (soil taxonomy) were
Porter, 2009), it was assumed that (1) geographic distribution downloaded from the SoilGrids database (ISRIC, 2015; www.
reflects adaptation and underlying ecological tolerance and (2) soilgrids.org) in 30 arc-s resolution. Data sets with different reso-
the occurrence data assembled here are a non-biased representa- lutions were either aggregated or disaggregated to 2.5 arc-min
tion of intraspecific diversity and variability. Thus, the absence of accordingly using the bilinear method (Hijmans and Van Etten,
any cytotype in a geographic area was considered to be a result of 2015) to match WorldClim data. R packages ‘sp’ (Bivand et al.,
natural processes underlying ecological signals, adaptation and 2013) ‘maptools’ (Bivand and Lewin-Koh, 2015) and ‘raster’
evolutionary mechanisms acting within the species. (Hijmans et al., 2015) were used in these steps.
Ecological data of 26 bioclimatic variables were downloaded For the analysis of past ecological niches of cytotypes, bio-
from various open-source databases. Nineteen commonly used climatic variables for past climatic conditions [Last Glacial
bioclimatic variables were retrieved from the WorldClim data Maximum (LGM) – approx. 21 000 years before present (ybp)
set (1950–2000; version 1.4) at 2.5 arc-min resolution (approx. 5 and Mid-Holocene (MH) – approx. 6000 ybp] were retrieved
km2) (Hijmans et al., 2005; http://www.worldclim.org). The ele- from WorldClim for two different scenarios (BCC-CSM1-1 and
vation data were downloaded from the Shuttle Radar Topography CCSM4; see www.worldclim.org) at 2.5 arc-min resolution.
Mission (SRTM; http://srtm.csi.cgiar.org/) elevation data set at
30 arc-s (approx. 1 km2) resolution. Photosynthetically avail-
able radiation (PAR) data were downloaded from the Moderate
Environmental niche modeling
Resolution Imaging Spectroradiometer (MODIS) database
(Myneni et al., 2015; https://lpdaac.usgs.gov). The annual mean Species and cytotype distribution models were constructed
UV-B radiation data set was downloaded from glUV (a global using MaxEnt v. 3.3.3k (Phillips et al., 2006). A raster grid stack
UV-B radiation data set for macroecological studies) at 15 of all 26 bioclimatic variables for the entire South American
arc-min resolution (Beckmann et al., 2014; www.ufz.de/gluv). continent was generated and the relevant data at each collection
Cloud cover percentage, vapour pressure and frost day frequency point for cytotype distribution analysis were extracted using the
data were downloaded from CGIAR CSI (www.cgiar-csi.org) at R package ‘dismo’ (Hijmans et al., 2016). A multiple logistic
Downloaded from https://academic.oup.com/aob/article-abstract/121/6/1183/4837271
by SUB Goettingen user
on 14 August 2018Karunarathne et al. — Niche divergence between cytotypes in Paspalum intermedium 1187
regression was performed to test ecological preferences and Niche breadth and overlap
associations between ploidy and environmental variables. The
Niche characteristics were extracted using parametric gener-
equation takes the form of
alized models. Coarse spatial resolution of ecological and geo-
graphic properties of the species was used to define Grinnellian
pi niches of cytotypes. Niche breadth and niche shifts were com-
E [Yi | Xi ] = logit ( pi ) = ln
1 − pi puted as 1.5 s.d. of the Euclidian distance from the centroid of
= β0 + β1. X 2, i + ... + β m, i an individual’s cloud for each cytotype and weighted by the
Eigenvalues of PCA ordination axes, respectively. The ampli-
tude of cytotype-specific habitat distribution and ecological
where logit(pi) is the probability of occurrence of one cyto- requirements was considered as a measure of Grinnellian real-
type, Xi is the value of environmental variables (predictor) and ized specialization (Devictor et al., 2010).
β is a regression coefficient. The R-package ‘nnet’ (Venables Schoener’s D index was used to assess the overall overlap of
and Ripley, 2002) was used for the analysis. Principal compo- the environmental niche space between cytotypes. Therein, the
nent analysis (PCA) was performed for the 26 variables using similarity of the niches was summarized from 0 (no similarity)
the R-package ‘vegan’ (Oksanen et al., 2016) to determine the to 1 (complete similarity). The obtained niche overlap was plot-
main drivers of the niche space and cytotype differentiation. ted against a randomly simulated niche overlap generated with
To avoid overfitting the data and minimize niche aggregation the assumptions of both niche equivalency and similarity (as
of cytotypes, we removed predictor variables exhibiting high described in Broennimann et al., 2012). In order to avoid unin-
pair-wise correlation values (Fisher weighted mean r values formative data extraction for background environment, environ-
>0.85) and high collinearity on multiple logistic regression mental data were extracted from random points (500 for diploids
and PCA ordination output. Based on these criteria, 15 bio- and 800 for tetraploids; the number of points was empirically
climatic and environmental variables were retained and used chosen based on the highest AUC values of the SDM) drawn
as predictors to calibrate distribution models in MaxEnt (see from a circular area around the observed data points. Simulations
Table 2). for niche similarity and equivalency were performed in 1000 rep-
For reconstructing past niches, data on PAR, UV-B, cloud licates each, using the R package ‘ecospat’ (Di Cola et al., 2017).
cover percentage, vapour pressure, frost day frequency and soil A new approach was used to visualize density distributions
type were not available. Therefore, only eight out of 15 selected of each cytotype in a collective environmental gradient (CEG).
bioclimatic predictors together with elevation data (see Table 2) The CEG was computed utilizing all the selected environmen-
were used for model calibration. Distribution of both cytotypes tal variables (predictors). The data set was transferred into a
based on their realized Grinnellian niches was modelled with the table with predictors in columns and geographic points in rows.
present data and simulated into two past climatic periods, the A z-transformation was applied to all the predictors (columns)
MH and the LGM. The accuracy of past predictions was assessed to create a CEG for each cytotype where all variables are col-
against predictions for the present data using the area under the lapsed into one single gradient. The transformed values for each
model’s receiver operator characteristic (ROC) curve (AUC val- locality and cytotype were summed up and used to obtain a
ues), a threshold-independent ROC analysis that measures the ‘collective’ value representing the overall ecological setting for
performance of models (Hanley and McNeil, 1982). that particular geographical point assuming that all predictors
Table 2. Bioclimatic and environmental variables retained for cytotype distribution and niche analysis in P. intermedium, its signifi-
cance values and PCA contributions
Environmental variable Code P-value PC1 Co2 PC2 Co2 AC
Annual mean temperature (°C) BIO1 0.0040 –0.9313 0.867404 0.31867 0.101556 8.796792
Isothermality (BIO2/BIO7) (× 100) BIO3 0.0011 –0.6329 0.400577 0.53660 0.28795 6.974405
Temperature seasonality (s.d. × 100) BIO4 0.0001 0.96151 0.924507 –0.02525 0.000638 8.07602
Minimum temperature of coldest month (°C) BIO6 0.0072 –0.9018 0.813358 –0.18677 0.034883 7.5197
Temperature annual range (°C) BIO7 0.0050 0.6018 0.362187 0.56517 0.31942 7.01954
Mean temperature of wettest quarter (°C) BIO8 0.0135 –0.2564 0.065749 0.8668 0.751362 9.65046
Mean temperature of driest quarter (°C) BIO9 0.00013 0.9687 0.938464 0.21164 0.044792 8.73122
Mean temperature of warmest quarter (°C) BIO10 0.00063 –0.8491 0.721005 0.41351 0.170999 8.35803
Mean temperature of coldest quarter (°C) BIO11 0.0015 –0.9621 0.925642 0.22777 0.05188 8.70494
Precipitation seasonality (CV) BIO15 0.0081 0.2617 0.068509 0.91909 0.84474 10.80257
UV-B radiation (J m–2 d–1) U 0.00177 –0.7011 0.806261 0.67793 0.133702 9.84241
Photosynthetically active radiation (PAR) P 0.0021 –0.8979 0.49162 0.36565 0.45959 8.65153
Frost day frequency (days per year) F 0.01733 0.6853 0.874856 0.07113 0.060288 4.16024
Surface vapour pressure (hPa) S 0.002 –0.9353 0.469697 0.24553 0.00506 8.36329
Elevation E 0.0231 –0.5258 0.27651 0.22309 0.049773 3.01441
P-value, significance values (α = 0.05) of the multiple logistic regression analysis on climatic and ecological preferences between diploids and tetraploids; AC,
sum of absolute contributions of variables to principal components 1 and 2; PC1 and PC2, eigenvalues of first two axes of the PCA for the ordination of variables
demarcating the niche space between the two cytotypes; Co2, squared co-ordinates of variables (higher values indicate better representation of variables in the
principal components).
Downloaded from https://academic.oup.com/aob/article-abstract/121/6/1183/4837271
by SUB Goettingen user
on 14 August 20181188 Karunarathne et al. — Niche divergence between cytotypes in Paspalum intermedium
contribute to the occurrence of the cytotype at a given location. 35.2 %) and tetraploids (2n = 4x = 40; N = 793; 64.8 %)
Collective values were then mapped into the CEG to obtain a (Supplementary Data Fig. S1a, b; Method S1). In addition,
kernel density estimation (KDE) (probability density) and to one triploid individual (2n = 3x = 30) was also recorded
visualize any trend on main ecological preferences relative (Supplementary Data Table S1). Thirty-one out of the 35
to each cytotype. For the KDE, a bandwidth of 0.5 s.d. was (88.6 %) populations were uniform, consisting of pure dip-
applied to achieve a moderate smoothing of the resulting den- loid or pure tetraploid plants; the remaining four (11.4 %)
sity curves (Fig. 2). The CEG was structured into quartile and were mixed-ploidy populations (Hojs456, Hojs470, Hojs481
interquartile points to assess the significance of the data and to and Hojs487). Populations consisting of multiple cytotypes
better visualize the relative ecological differentiation between are rare in Paspalum, and this is the first record for P. inter-
cytotypes along the collective environmental gradient (Fig. 2). medium. The tetraploid was the most common cytotype,
present in 28 (24 pure tetraploid) populations, while the dip-
loid cytotype was found in 15 (11 pure diploid) populations
(Fig. 1; Table 1). The rare triploid cytotype was found in a
Statistical analyses
mixed-ploidy (2x–4x) population (Fig. 1).
Complete spatial randomness (CSR) of all the occurrences On comparison with previous records by various authors
was tested with K-function (also Ripley’s K-function) in the R (Supplementary Data Table S2), we observed a shift of ploidy
package ‘spatstat’ (Baddeley and Turner, 2005), prior to all the in four localities: three along a contact zone between cytotypes
statistical analyses and modelling. Furthermore, a χ2 dispersion and one in the core distribution area of diploids (details in Figs
test for spatial point patterns based on quadrat counts (quadrat- 1 and 2; Supplementary Data Tables S1 and S2).
test; Baddeley and Turner, 2005) was used to test spatial separ- The within-population sampling strategy unveiled local-
ation of cytotypes in the sampling area (further details are given scale distribution patterns of cytotypes in mixed populations
in Supplementary Data Fig. S5). All the statistical analyses and (Supplementary Data Fig. S2). While one population (Hojs456)
mapping were performed in R version 3.3.2 (R Core Team, had only five diploid individuals restricted to one end of the
2016) unless mentioned otherwise. QGIS [QGIS Development population, the rest had various numbers of diploid and tetra-
Team. Open Source Geospatial Foundation (2016)] was used ploid cytotypes mixed in different patterns along the sam-
for visualization and creating maps. pling line (Supplementary Data Fig. S2). A Mann–Kendall
rank test for randomness (in the R-package ‘randtests’; Caeiro
and Mateus, 2014) indicated a non-random distribution in the
RESULTS occurrence of cytotypes along the sampling transects (P ≤ 0.01
in all cases), suggesting that the local-scale distribution patterns
Ploidy level variation, local and regional spatial separation and turnover followed a certain clustering order. In addition,
in population Hojs470, we collected eight young individuals
The ploidy evaluation of a total of 1224 individuals revealed (seven tetraploids and one diploid) widespread among mature
two major cytotypes: diploids (2n = 2x = 20; N = 431; individuals (Supplementary Data Fig. S2).
Tet
Dip
1.0
0.8
Probability of occurence
0.6
0.4
0.2
0
Environmental amplitude
Fig. 2. Niche breadth of diploid (red) and tetraploid (blue) P. intermedium cytotypes depicted as probability density function for occurrences along the collective
environmental gradient of the ecological requirements of species. Boxplot-ranked sets of data (quartiles and interquartile range) further illustrate ecological differ-
entiation between cytotypes. The ecological gradient of species coalesce the observed environmental heterogeneity after pooling (z-transformed) data of environ-
mental variables showing significant differences (P < 0.05). Pie charts indicate the relative position of mixed-ploidy populations within the environmental gradient
(x-axis) (upper left, Hojs487; lower left, Hojs481; upper right, Hojs470; lower right, Hojs456), and slices represent percentages of each cytotype (red = diploids,
blue = tetraploids).
Downloaded from https://academic.oup.com/aob/article-abstract/121/6/1183/4837271
by SUB Goettingen user
on 14 August 2018Karunarathne et al. — Niche divergence between cytotypes in Paspalum intermedium 1189
The spatial randomness test for the recorded occurrences of out of four mixed-ploidy populations were flowering; however,
the two cytotypes with Ripley’s K-function showed deviations ploidy levels of individuals were unknown during collection.
of λK(r) (the expected vs. observed number of points per unit The probability of blooming incidence per ploidy indicates that
area) from the Poisson (theoretical) distribution (paired-end diploids tend to flower early in the season (n = 24; P = 0.0074;
t-test P < 0.001) (Supplementary Data Fig. S3a). This indicates d.f. = 1) while the probability of finding tetraploids with flower-
a non-random distribution of ploidies among all geographically ing stems was the same for both the early and the late summer
dispersed data points. In addition, a Pearson χ2 goodness-of-fit periods (n = 47; P = 0.2108; d.f. = 1).
test using quadrat counts showed a deviation (χ2 = 161.14, P= 0 Generalized linear models with multiple error distribu-
.0001; Supplementary Data Fig. S3b) in the observed distribution tion (logistic regression) detected 15 environmental vari-
compared with the null distribution, thus confirming a clustering ables having significant differences between cytotypes (P ≤
of cytotypes along the observed North–South spatial separation 0.0147 in all cases; Table 2), indicating unique ecological
and East–West contact zone of sympatric and parapatric occur- and climatic preferences. Thus, most extreme cytotype dif-
rences (mixed-ploidy populations were considered both diploid ferences were found for Bio1, annual mean temperature
and tetraploid in the analysis; triploids were not considered). (P = 0.00019); Bio6, minimum temperature in the cold-
est month (P = 0.00037); and Bio15, precipitation sea-
sonality (P = 0.0114) (Supplementary Data Figs S4 and
S5). PAR and UV-B radiation (mean value for diploids,
Cytotype reproduction modes and ploidy as a proxy for reproductive
PAR = 0.532 ± 0.009 J m–2, UVB = 415 ± 79 J m–2; tetra-
biology
ploids, PAR = 0.511 ± 0.01 J m–2, UVB = 402 ± 92 J m–2;
A total of 500 seeds originating from 45 individuals (100 Supplementary Data Fig. S4) also showed strong association
seeds from nine diploids and 400 seeds from 36 tetraploids) with differences in climatic preferences between cytotypes
were analysed to assess reproductive modes of P. intermedium (P = 0.000138 and 0.00026, respectively). The elevation,
(Table 3). Single-seed histograms produced two types of peak however, did not show a strong correlation as the species
configurations, corresponding to different embryo to endo- distribution range is restricted to a topographically flat area
sperm DNA content ratios: peak configurations 2C:3C corres- (58–156 ± 18.2 m for 2x; 35–93 ± 12.9 m for 4x; Table 2;
pond to sexual seeds, carrying a diploid embryo and a triploid Supplementary Data Figs S4 and S5).
endosperm; peak configurations 2C:5C correspond to clonal Scenopoetic variables gathered from all localities defined the
seeds, carrying a parthenogenetic diploid embryo and a penta- realized niche of species and displayed divergent differences
ploid endosperm (see details in Supplementary Data Method between cytotypes (Supplementary Data Fig. S4), with tetra-
S2; Fig. S1c). In diploid plants, only seeds with a 2C:3C peak ploids occupying broader environmental ranges than diploids.
configuration were observed, and therefore diploids are consid- The diploid range was fully enclosed within the tetraploid range
ered as obligate sexuals (all seeds were produced after syngamy in eight out of 13 variables, and tetraploids included the core of
of meiotic gametes). Tetraploid plants presented a moderately the ecological preferences of diploids (i.e. interquartile ranges) in
low proportion of sexual seeds (70 %; Table 3). Hence, tetraploids are components explained the majority of environmental variation
considered as facultative apomicts. observed for the P. intermedium data set (see Supplementary
Since ploidy levels in P. intermedium (Norrmann et al., Data Fig. S5). PC1 (represented 44.1 % of the variation) was
1989; this study) as well as in other Paspalum spp. and grasses explained by temperature-related variables, vapour pressure,
(e.g. Galdeano et al., 2016) are tightly connected to divergent PAR, UV-B radiation, frost day frequency and soil type, and
reproductive syndromes, our reproductive screenings validate defined the Euclidean space of diploids. PC2 (represented 31.8 %
the use of ploidy as a priori information and a proxy for repro- of the variation) was best explained by precipitation-related vari-
ductive biology in P. intermedium. ables (Table 2; Supplementary Data Fig. S5). The PCA revealed
a shift in the Euclidean space between cytotypes along the PC1
axis and a large overlap along the PC2 axis, with tetraploids hav-
Phenological shift and intraspecific ecological differentiation of ing a greater niche breadth (Figs 2 and 3). The differentiation
of niche optima in Fig. 3 is defined as the Euclidean distance
cytotypes
between centroids of ellipses weighted by the inertia of the first
In our analysis of phenology, we recorded a total of 38 sites two axes after decomposition of inertia (six axes). The observed
in flowering during the early and late season trips and added 33 niche overlap of diploids and tetraploids (Schoener’s D = 0.25)
records of materials with known ploidy from herbaria. Three is significantly lower (P = 0.0099) than the simulated overlap
Table 3. Reproductive mode variation between cytotypes of P. intermedium in the study area
Ploidy n (pop.) n (ind.) Seeds PI ± s.d. Rep. path Proportion ± s.d.
Diploid 3 9 100 1.45 ± 0.039 Sex. 100 ± 0.0 %
Tetraploid 12 36 400 1.49 ± 0.089 Sex. 27.9 ± 7.0 %
2.40 ± 0.071 Apo. 72.1 ± 9.7
n (pop.), number of populations; n (ind.), number of individuals; Sex., sexuality (cross- and self-fertility); Apo., pseudogamous apomixis; PI, peak index or
endosperm:embryo peak ratio in flow cytometry analyses; Rep. path, reproductive pathway.
Downloaded from https://academic.oup.com/aob/article-abstract/121/6/1183/4837271
by SUB Goettingen user
on 14 August 20181190 Karunarathne et al. — Niche divergence between cytotypes in Paspalum intermedium
(mean = 0.65) under niche equivalency (Supplementary Data Ecological niche modelling and past distribution
Fig. S6a). On the other hand, the niche similarity test indicated
Model simulations produced high AUC scores (0.83 and 0.81
that the observed environmental space similarity is higher than
for diploids and tetraploids, respectively) and thereby highly
expected on a random basis (P = 0.297) (Supplementary Data
accurate predictions of climatic niche spaces which reflect
Fig. S6b). These reject the null hypothesis that diploids and tetra-
the realized range of distribution of each cytotype. Prediction
ploids occupy equal climatic niche spaces, and recognize that
scores >0.65 were considered strong signals for habitat suit-
both cytotypes occupy habitats with slightly dissimilar climatic
ability of the cytotypes (see Fig. 4). MaxEnt predictions show
regimes and environmental resources.
that the environmental niche spaces of both cytotypes nearly
The collective environmental gradient further shows this ten-
reflect their realized niches in the sampling area, with a few
dency by visualizing the probability density of cytotypes along
exceptions. For example, the climatic niche of diploids is
a continuous gradient representing all ecological settings of the
marginally expanded toward the North-east of their realized
species. Diploids are symmetrically centred and display infe-
distribution (Fig. 4; Supplementary Data Table S2), and the cli-
rior ecological amplitude compared with tetraploids (Fig. 2).
matic niche of tetraploids is expanded toward the North along
In contrast, tetraploids can grow in a wider range of environ-
a stretch of the Paraguay River, reaching Bolivia and Brazil
mental conditions, exhibiting a broader yet lower probability
(Fig. 4). Likewise, a surprisingly large area predicting a niche
density along the gradient with a median value and main eco-
overlap around the core distribution of diploids is not realized
logical preferences shifted away from those of diploids (Fig. 2).
for the distribution range of tetraploids. The complete absence
Overall, tetraploids display wider ecological amplitude and are
of tetraploids in this region suggests a zone of cytotype exclu-
‘generalists’, while diploids are ‘specialists’. Environmental
sion (Figs 1 and 4).
niche differentiation of P. intermedium cytotypes followed a
Projections of past environmental niche space of P. inter-
latitudinal gradient where tetraploids grow under more extreme
medium for both CCSM4 and BCC-CSM1-1 past climatic sce-
environmental conditions (e.g. lower temperatures and light
narios showed a temporo-spatial range shift in estimated spatial
radiation) and therefore can cope well with seasonal changes
distributions of cytotypes. Both ecological models indicated the
in southern areas.
absence of suitable habitats for either cytotype in our current
sampling area during the LGM (25 000 ybp), and the presence
of suitable climatic conditions for diploids in northern Bolivia
and central and southern parts of Brazil (Supplementary Data
1.0 Fig. S7). Towards the MH (approx. 6000 ybp), changes in en-
vironmental conditions in the South American continent moved
habitat suitability of diploids towards southern parts of Brazil,
Paraguay and northern Argentina, thus expanding its distribu-
0.5
tion area, and priming the conditions for a successful estab-
lishment of tetraploids as projected for northern Argentina and
southern Paraguay (Supplementary Data Fig. S7).
PCA 2 (8.27)
0
DISCUSSION
–0.5 Knowledge on plant distributions and intraspecific trait variabil-
ity is central to underpin ecological and physical factors affect-
ing evolutionary dynamics and history of species. Studies on
U
8 15
7
cytotype distributions and associated environmental and repro-
–1.0 10
S ductive traits provide valuable insights into diploid–polyploid
VP
19 F
C
4 dynamics and factors responsible for contraction–expansion
12
cycles (e.g. Cosendai and Hörandl, 2010; Caperta et al., 2016;
Sonnleitner et al., 2016). The present macro- and micro-scale
–1.0 –0.5 0 0.5 1.0 study on P. intermedium is an attempt to recognize environmen-
PCA 1 (11.43) tal factors and biological traits affecting cytotype coexistence,
population dynamics and ecological adaptation outlining early
Fig. 3. Multidimensional analysis of the ecological niche of P. intermedium events endowing polyploidization and speciation in plants.
and the shift in niche optima between cytotypes. The specialization of cyto-
types and differentiation of niche optima are reflected by the multidimensional
volume (here represented in a 2-D space) represented by the spatial distribution
of points (collection sites, each indicating a particular environmental set-up),
and the distance between centroids of ellipses. Main environmental variables Cytotype composition and distribution patterns
used in the ordination are shown in the correlation circle (r = 1; codes follow
Table 2). Red circles symbolize diploids, blue squares tetraploids and red-filled
The distribution range of P. intermedium is centred in north
blue squares heteroploid sites. Eigenvalues for inertia of the first two axes are and eastern Argentina with records spanning to Southern
given in parentheses. Red and blue arrows indicate the direction of the shift Brazil, eastern Paraguay and northern Uruguay (Zuloaga et al.,
in niche optima for diploid and tetraploid cytotypes. The grey-shaded ellipse 2012). The study revealed a North–South spatial segregation
represents the niche space of the species. Dotted ellipses indicate diploid (red) of the two cytotypes with a narrow East–West overlapping
and tetraploid (blue) niches.
Downloaded from https://academic.oup.com/aob/article-abstract/121/6/1183/4837271
by SUB Goettingen user
on 14 August 2018Karunarathne et al. — Niche divergence between cytotypes in Paspalum intermedium 1191
N
PARAGUAY
W E
S
ARGENTINA
BRAZIL
100 0 100 km
URUGUAY
BOLIVIA
PARAGUAY BRAZIL
ARGENTINA
Observed distribution
Observed 2× localities
Observed 4× localities
Mixed-ploidy populations
Predicted distribution 2×
>0.8
0.6–0.8
0.8
100 0 100 200 km
0.6–0.81192 Karunarathne et al. — Niche divergence between cytotypes in Paspalum intermedium
(further details below), a consequence of anthropogenic 2016). Nevertheless, achieving reproductive assurance through
activities (extensive human intervention in the area is evi- asexuality certainly shields polyploids from environmen-
dent through agricultural activities) or a combination of such tal stress (Freeling, 2017; see next section) and confer higher
factors. colonizing ability to tetraploids (Hörandl, 2006; Hojsgaard
and Hörandl, 2015). Molecular genetic analyses will benefit us
to better understand the origin of tetraploids, the competitive
dynamics between cytotypes within mixed populations, and the
Ecological specialization and niche differentiation between
effect of asexuality and environmental stressors on partitioning
cytotypes
genetic diversity and resource use.
In P. intermedium, the realized niche specialization based
on environmental parameters and background similarity tests,
niche breadth and cytotype densities showed significant dif- Population dynamics, ploidy shifts and ecological displacement
ferentiation on ecological requirements between cytotypes, between cytotypes
indicating that diploids are adapted to a narrow range of eco- The North–South distribution pattern of P. intermedium cyto-
logical settings compared with tetraploids. By having a broader types is defined by a divergence in cytotype-specific ecological
and transgressive niche breadth, tetraploids enclose the whole preferences. In core distribution areas, seasonal environmental
range of climatic preferences of diploids; a situation observed variables foster cytotype stability. Dispersion of cytotypes fol-
in other polyploid complexes as well (e.g. Claytonia perfo- lowing a seasonal–latitudinal gradient as observed in P. inter-
liata complex, McIntyre, 2012; Tolmeia, Visger et al., 2016), medium is not rare in nature (Španiel et al., 2008; Trávnícek
and expected in autopolyploids such as P. intermedium, recur- et al., 2011; Zozomová-Lihová et al., 2015). Diploid–tetraploid
rently originated from a diploid’s gene pool. However, unlike coexistence is possible by different pre- and post-zygotic iso-
in the C. perfoliata complex (McIntyre, 2012) and other auto- lation barriers (Husband and Sabara, 2003) or by character
polyploid systems such as Allium oleraceum (Duchoslav et al., displacement and ecological differentiation (Beans, 2014).
2016), in P. intermedium we observe a significant separation of Despite being rarely found in nature, niche displacement (i.e.
ecological optima between cytotypes, suggesting a segregation when the niche of a cytotype is affected by the presence of
of ploidy-related ecophysiological aptitudes for the exploitation another cytotype) through a shift in niche optima or breadth
of environmental resources after polyploidization. Recently plays an important role in enabling closely related species to
established polyploids usually display intermediate ecological coexist. For example, Sonnleitner et al. (2016) found that con-
preferences compared with diploids and established polyploids tact zones in Senecio carniolicus were stabilized and reinforced
(e.g. Maherali et al., 2009; Levin, 2011). Similarly, tetraploids by ecological differentiation of cytotypes as a result of habitat
from mixed populations in P. intermedium (presumably the displacement. Unlike in other species, in P. intermedium the
product of recent polyploidization events and therefore younger uneven replacement and local and regional spatial separation
than those occurring in southern areas) show ecological prefer- of cytotypes, the biased recruitment of young polyploid indi-
ences intermediate to those observed in diploids and general viduals in heteroploid populations and the discrepancy between
tetraploids, which further reinforces our observations of cyto- predicted and observed distributions in tetraploids suggest a
type dynamics. Different studies of niche shifts in autopoly- pattern of unstable temporal coexistence and directional turn-
ploids support the common hypothesis that polyploids evolve over during which one cytotype is locally displaced reliant on
to occupy wider or more extreme ranges than their progenitors ecological specialization and local environmental conditions.
(reviewed in Spoelhof et al., 2017). Accordingly, the directional The model prediction for the distribution of diploids is not
and opposed shift in niche optima observed between P. inter- significantly different from the observed distribution (Fig. 4).
medium cytotypes, the bimodal distribution of cytotypes and However, the prediction for tetraploids indicates that polyploids
skewness observed for tetraploids along the collective envir- should coexist along with diploids in its main distribution zone;
onmental gradient suggest the action of past disruptive selec- a situation that has not been realized according to our field
tion on established tetraploids favouring a divergent departure observations. This suggests the presence of a wide area of tetra-
between the ecological preferences of cytotypes. Niche differ- ploid exclusion. In addition, the current observation that only
entiation is a primary mechanism to avoid competitive exclu- a pure diploid population is found in an area in the core zone
sion by diploid progenitors and foster polyploid establishment of diploids where one tetraploid was collected 30 years ago
(e.g. Levin, 2003; Ramsey, 2011). Thus, establishment and (Norrmann et al., 1989), and that diploids are being replaced
persistence of P. intermedium polyploids apparently took place by tetraploids in peripheral areas of its distribution suggests
at the expense of becoming (sub-) adapted to a broader range that tetraploids may only overcome ecological competition in
of ecological conditions and less competitive in areas where the marginal zones of diploids with greater environmental het-
multidimensional space meets the niche optimum of diploids. erogeneity. Thus, tetraploids may fail to become locally estab-
The question remaining is whether the observed broader eco- lished in areas where optimal niche requirements of diploids
logical tolerance is due to an effect of polyploidy (e.g. Kearney, are successfully met. Reciprocal transplantation experiments
2005) or caused by the fact that asexuality is probably freezing would certainly provide more accurate conclusions on this
a range of genotypes among autopolyploid clones (carrying a observation.
sub-set of genes from the diploid ancestors) adapted to local By definition, boundaries of distribution in plants represent
narrow niches (Vrijenhoek, 1979). While a shift from sexuality zones of ecological transition, i.e. areas where environmental
to apomixis can partition the use of resources in polyploids, it conditions do not satisfy the main ecological preferences of a
may not necessarily affect the niche dynamics (Dellinger et al.,
Downloaded from https://academic.oup.com/aob/article-abstract/121/6/1183/4837271
by SUB Goettingen user
on 14 August 2018Karunarathne et al. — Niche divergence between cytotypes in Paspalum intermedium 1193
particular species or group (Grant, 1981). Even when plants and central and south Brazil during the LGM around 21 000 ybp,
exhibit plasticity to environmental conditions, their perform- in an area in southern Amazonia that was colder and drier than
ance at niche edges may decline due to the effects of biotic now, occupied by grasslands and savanna (e.g. Behling, 2002).
and abiotic factors on their reproductive success (Vergeer and During late Quaternary, neither tropical climates nor vegetation
Kunin, 2013). Cytotypes occupying habitats in areas of eco- were stable and, as climate started to warm up, deglaciation (14
logical transition, irrespective of the mode of coexistence (i.e. 000 to 8000 ybp) transformed global vegetation distributions,
sympatry or parapatry), are prone to ecophysiological sub- even in tropical zones (Comes and Kadereit, 1998; Williams,
adaptation. Changes in reproductive strategies (e.g. allogamy– 2009). Toward the MH (6000 ybp), the forest cover expanded
autogamy, sexuality–apomixis) and ploidy levels are known and thermophilous taxa moved to higher altitudes and latitudes,
to improve local and regional performance (Hörandl, 2006). reshuffling distributions of species with dramatic changes in
Mixed populations of P. intermedium appear in a region of spa- some cases. For example, Picea suffered a biogeographic shift
tial niche overlap between cytotypes, a zone of ecological tran- of around 2000 km northward from the central eastern USA
sition between diploid–tetraploid niche optima (Fig. 3) where (Williams, 2009). Similar regional to continental shifts in dis-
competition is expected to be stronger and driven not only by tributions took place in different species in South America (e.g.
ecological differences (as the ecological requirements of nei- Araucaria forest; Behling, 2002), which may have affected the
ther cytotype were fully met) and spatial segregation of cyto- distribution of diploid P. intermedium. The present climatic
types but also by reproductive changes. In fact, two out of four niche modelling showed a shift of diploid occurrence during
mixed populations (Hojs456 and Hojs470) found in the transi- the Holocene, from central-east Brazil to southern areas in nor-
tion area where ecological conditions resembled more those of thern Argentina and Paraguay, perhaps a consequence of spe-
the niche optima of diploids (interquartile range; Fig. 2) har- cies’ migration to track adaptive peaks as the fitness landscape
boured a significantly higher number of tetraploids. Similarly, changed (Supplementary Data Fig. S7). The presence of fossil
one of the other two populations (Hojs481) located in a transi- impressions of P. intermedium spikelets found in Gran Chaco
tion area where conditions resembled more those of the niche region (northern Argentina) suggests that the species lived in
optima of tetraploids was dominated by diploids, indicating the area around MH (Contreras et al., 2015), which agrees with
that the reproductive mode might have an effect, even if tem- model reconstructions of past vegetation types and distribution
porary, on local cytotype success. Apomixis is known to shel- in South America (Cerling et al., 1997; Piovano et al., 2009).
ter the polyploid from introgressive hybridizations, particularly Plant taxa primarily respond to climate variations via local
heteroploid hybridizations (Hörandl and Temsch, 2009). The changes in abundance and, consequently, climate change
observed incongruity between ecological conditions, niche shapes vegetation dynamics in the long run (Williams, 2009).
preferences and population composition mentioned above, In P. intermedium, climatic and fitness landscape changes
together with the documented ploidy shifts, suggests the exist- seem to have prompted geographic shifts to new environments.
ence of a temporal succession of polyploid establishment–dip- The question remains of whether diploids and tetraploids
loid displacement events. In this case, whenever a tetraploid is coexisted in those areas adapted to similar climatic niches
successfully established in the peripheral areas of diploids, the and diverged later, or whether tetraploids directly occupied
new heteroploid population will eventually reach a situation of vacant niches unfavourable for diploids while moving south.
asymmetric turnover between cytotypes which will most prob- In either case, niche divergence facilitated the spatial segre-
ably drive diploids to a local extinction. gation and establishment of both cytotypes. Since apomixis
In P. intermedium, a shift to apomixis not only shelters the and selfing are known to provide superior colonization abili-
polyploid from introgression of diploids (only one triploid ties in peripheral areas via uniparental reproduction (Baker’s
among 122 individuals in mixed populations), thus reduc- Law; Baker, 1955), niche availability and segregating eco-
ing fitness loss by infertile hybrids and avoiding minority physiological and reproductive traits may have delivered the
cytotype disadvantages (Levin, 1975), but also facilitates the appropriate background for polyploids to expand into southern
multiplication of superior genotypes better adapted to local en- habitats that are inaccessible to diploids where primary pro-
vironmental conditions. In marginal areas where both cytotypes duction and productivity measures are lower (Alcaraz-Segura
co-occur in sympatry, a generalist strategy with broader eco- et al., 2013). Broader ecophysiological tolerance of tetraploids
logical tolerance and a capacity clonally to propagate rare and and their habitat-associated characteristics featured by the
highly adapted genotypes may enhance the relative fitness of Mesopotamian water system that drains toward Parana delta
polyploids and their chances to displace diploids locally. Our to the Atlantic Ocean certainly favoured tetraploid dispersal,
observation of seven out of eight young P. intermedium plants which eventually shaped the currently observed North–South
sampled in a population with mixed ploidy being tetraploids distribution pattern.
and the non-random distribution of cytotypes within mixed
populations supports the interpretation of non-random turnover
and local displacement between cytotypes. SUPPLEMENTARY DATA
Supplementary data are available online at https://academic.
oup.com/aob and consist of the following. Table S1: details of
Reconstruction of past migrations, and evolutionary history of
collection sites, collection codes, number of individuals and
polyploid cytotypes
ploidy of P. intermedium materials collected in the present
Reconstruction of past climatic niches indicated that only study. Table S2: collections sites of P. intermedium plant materi-
diploids of P. intermedium may have existed in northern Bolivia, als with a known ploidy level from previous studies. Figure S1:
Downloaded from https://academic.oup.com/aob/article-abstract/121/6/1183/4837271
by SUB Goettingen user
on 14 August 2018You can also read